Basic Tools for Process Improvement
Basic Tools for Process Improvement
Basic Tools for Process Improvement

You also want an ePaper? Increase the reach of your titles
YUMPU automatically turns print PDFs into web optimized ePapers that Google loves.
<strong>Basic</strong> <strong>Tools</strong> <strong>for</strong> <strong>Process</strong> <strong>Improvement</strong><br />
Module 11<br />
HISTOGRAM<br />
HISTOGRAM 1
What is a Histogram?<br />
<strong>Basic</strong> <strong>Tools</strong> <strong>for</strong> <strong>Process</strong> <strong>Improvement</strong><br />
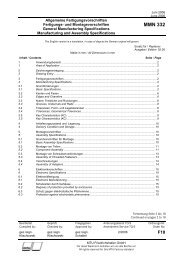
A Histogram is a vertical bar chart that depicts the distribution of a set of data. Unlike<br />
Run Charts or Control Charts, which are discussed in other modules, a Histogram<br />
does not reflect process per<strong>for</strong>mance over time. It's helpful to think of a Histogram<br />
as being like a snapshot, while a Run Chart or Control Chart is more like a movie<br />
(Viewgraph 1).<br />
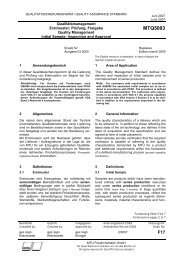
When should we use a Histogram?<br />
When you are unsure what to do with a large set of measurements presented in a<br />
table, you can use a Histogram to organize and display the data in a more userfriendly<br />
<strong>for</strong>mat. A Histogram will make it easy to see where the majority of values<br />
falls in a measurement scale, and how much variation there is. It is helpful to<br />
construct a Histogram when you want to do the following (Viewgraph 2):<br />
! Summarize large data sets graphically. When you look at Viewgraph 6,<br />
you can see that a set of data presented in a table isn’t easy to use. You can<br />
make it much easier to understand by summarizing it on a tally sheet<br />
(Viewgraph 7) and organizing it into a Histogram (Viewgraph 12).<br />
! Compare process results with specification limits. If you add the<br />
process specification limits to your Histogram, you can determine quickly<br />
whether the current process was able to produce "good" products.<br />
Specification limits may take the <strong>for</strong>m of length, weight, density, quantity of<br />
materials to be delivered, or whatever is important <strong>for</strong> the product of a given<br />
process. Viewgraph 14 shows a Histogram on which the specification limits,<br />
or "goalposts," have been superimposed. We’ll look more closely at the<br />
implications of specification limits when we discuss Histogram interpretation<br />
later in this module.<br />
! Communicate in<strong>for</strong>mation graphically. The team members can easily<br />
see the values which occur most frequently. When you use a Histogram to<br />
summarize large data sets, or to compare measurements to specification<br />
limits, you are employing a powerful tool <strong>for</strong> communicating in<strong>for</strong>mation.<br />
! Use a tool to assist in decision making. As you will see as we move<br />
along through this module, certain shapes, sizes, and the spread of data have<br />
meanings that can help you in investigating problems and making decisions.<br />
But always bear in mind that if the data you have in hand aren’t recent, or you<br />
don’t know how the data were collected, it’s a waste of time trying to chart<br />
them. Measurements cannot be used <strong>for</strong> making decisions or predictions<br />
when they were produced by a process that is different from the current one,<br />
or were collected under unknown conditions.<br />
2 HISTOGRAM
100<br />
80<br />
60<br />
40<br />
20<br />
0<br />
<strong>Basic</strong> <strong>Tools</strong> <strong>for</strong> <strong>Process</strong> <strong>Improvement</strong><br />
What Is a Histogram?<br />
0 5 10 15 20 25 30 35 40 45 50 55 60<br />
• A bar graph that shows the distribution of data<br />
• A snapshot of data taken from a process<br />
HISTOGRAM VIEWGRAPH 1<br />
When Are Histograms Used?<br />
• Summarize large data sets graphically<br />
• Compare measurements to specifications<br />
• Communicate in<strong>for</strong>mation to the team<br />
• Assist in decision making<br />
HISTOGRAM VIEWGRAPH 2<br />
HISTOGRAM 3
<strong>Basic</strong> <strong>Tools</strong> <strong>for</strong> <strong>Process</strong> <strong>Improvement</strong><br />
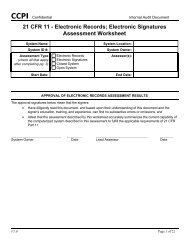
What are the parts of a Histogram?<br />
As you can see in Viewgraph 3, a Histogram is made up of five parts:<br />
1. Title: The title briefly describes the in<strong>for</strong>mation that is contained in the<br />
Histogram.<br />
2. Horizontal or X-Axis: The horizontal or X-axis shows you the scale of<br />
values into which the measurements fit. These measurements are generally<br />
grouped into intervals to help you summarize large data sets. Individual data<br />
points are not displayed.<br />
3. Bars: The bars have two important characteristics—height and width. The<br />
height represents the number of times the values within an interval occurred.<br />
The width represents the length of the interval covered by the bar. It is the<br />
same <strong>for</strong> all bars.<br />
4. Vertical or Y-Axis: The vertical or Y-axis is the scale that shows you the<br />
number of times the values within an interval occurred. The number of times<br />
is also referred to as "frequency."<br />
5. Legend: The legend provides additional in<strong>for</strong>mation that documents where<br />
the data came from and how the measurements were gathered.<br />
4 HISTOGRAM
4<br />
5<br />
F<br />
R<br />
E<br />
Q<br />
U<br />
E<br />
N<br />
C<br />
Y<br />
100<br />
80<br />
60<br />
40<br />
20<br />
<strong>Basic</strong> <strong>Tools</strong> <strong>for</strong> <strong>Process</strong> <strong>Improvement</strong><br />
Parts of a Histogram<br />
DAYS OF OPERATION PRIOR TO<br />
FAILURE FOR AN HF RECEIVER<br />
0<br />
0 5 10 15 20 25 30 35 40 45 50 55 60<br />
DAYS OF OPERATION<br />
MEAN TIME BETWEEN FAILURE (IN DAYS) FOR R-1051 HF RECEIVER<br />
Data taken at SIMA, Pearl Harbor, 15 May - 15 July 94<br />
1 Title 2 Horizontal / X-axis<br />
3 Bars 4 Vertical / Y-axis<br />
5 Legend<br />
HISTOGRAM VIEWGRAPH 3<br />
HISTOGRAM 5<br />
1<br />
3<br />
2
<strong>Basic</strong> <strong>Tools</strong> <strong>for</strong> <strong>Process</strong> <strong>Improvement</strong><br />
How is a Histogram constructed?<br />
There are many different ways to organize data and build Histograms. You can<br />
safely use any of them as long as you follow the basic rules. In this module, we will<br />
use the nine-step approach (Viewgraphs 4 and 5) described on the following pages.<br />
EXAMPLE: The following scenario will be used as an example to provide data as<br />
we go through the process of building a Histogram step by step:<br />
During sea trials, a ship conducted test firings of its MK 75,<br />
76mm gun. The ship fired 135 rounds at a target. An airborne<br />
spotter provided accurate rake data to assess the fall of shot<br />
both long and short of the target. The ship computed what<br />
constituted a hit <strong>for</strong> the test firing as:<br />
From 60 yards short of the target<br />
To 300 yards beyond the target<br />
6 HISTOGRAM
<strong>Basic</strong> <strong>Tools</strong> <strong>for</strong> <strong>Process</strong> <strong>Improvement</strong><br />
Constructing a Histogram<br />
Step 1 - Count number of data points<br />
Step 2 - Summarize on a tally sheet<br />
Step 3 - Compute the range<br />
Step 4 - Determine number of intervals<br />
Step 5 - Compute interval width<br />
HISTOGRAM VIEWGRAPH 4<br />
Constructing a Histogram<br />
Step 6 - Determine interval starting<br />
points<br />
Step 7 - Count number of points in<br />
each interval<br />
Step 8 - Plot the data<br />
Step 9 - Add title and legend<br />
HISTOGRAM VIEWGRAPH 5<br />
HISTOGRAM 7
<strong>Basic</strong> <strong>Tools</strong> <strong>for</strong> <strong>Process</strong> <strong>Improvement</strong><br />
Step 1 - Count the total number of data points you have listed. Suppose your<br />
team collected data on the miss distance <strong>for</strong> the gunnery exercise described in<br />
the example. The data you collected was <strong>for</strong> the fall of shot both long and short of<br />
the target. The data are displayed in Viewgraph 6. Simply counting the total<br />
number of entries in the data set completes this step. In this example, there are<br />
135 data points.<br />
Step 2 - Summarize your data on a tally sheet. You need to summarize your<br />
data to make it easy to interpret. You can do this by constructing a tally sheet.<br />
First, identify all the different values found in Viewgraph 6 (-160, -010. . .030,<br />
220, etc.). Organize these values from smallest to largest (-180, -120. . .380,<br />
410).<br />
Then, make a tally mark next to the value every time that value is present in<br />
the data set.<br />
Alternatively, simply count the number of times each value is present in the<br />
data set and enter that number next to the value, as shown in Viewgraph 7.<br />
This tally helped us organize 135 mixed numbers into a ranked sequence of 51<br />
values. Moreover, we can see very easily the number of times that each value<br />
appeared in the data set. This data can be summarized even further by <strong>for</strong>ming<br />
intervals of values.<br />
8 HISTOGRAM
How to Construct a Histogram<br />
Step 1 - Count the total number of data points<br />
Number of yards long (+ data) and yards short (- data) that a gun crew missed its target.<br />
-180 30 190 380 330 140 160 270 10 - 90<br />
- 10 30 60 230 90 120 10 50 250 180<br />
-130 220 170 130 - 50 - 80 180 100 110 200<br />
260 190 -100 150 210 140 -130 130 150 370<br />
160 180 240 260 - 20 - 80 30 80 240 130<br />
210 40 70 - 70 250 360 120 - 60 - 30 200<br />
50 20 30 280 410 70 - 10 20 130 170<br />
140 220 - 40 290 90 100 - 30 340 20 80<br />
210 130 350 250 - 20 230 180 130 - 30 210<br />
-30 80 270 320 30 240 120 100 20 70<br />
300 260 20 40 - 20 250 310 40 200 190<br />
110 -30 50 240 180 50 130 200 280 60<br />
260 70 100 140 80 190 100 270 140 80<br />
110 130 120 30 70<br />
TOTAL = 135<br />
HISTOGRAM VIEWGRAPH 6<br />
How to Construct a Histogram<br />
Step 2 - Summarize the data on a tally sheet<br />
DATA TALLY DATA TALLY DATA TALLY DATA TALLY DATA TALLY<br />
- 180 1 - 20 3 90<br />
- 130 2 - 10 2 100<br />
- 100 1 10 2 110<br />
- 90 1 20 5 120<br />
- 80 2 30 6 130<br />
- 70 1 40 3 140<br />
- 60 1 50 4 150 2 250 4 350 1<br />
- 50 1 60 2 160<br />
- 40 1 70 5 170<br />
- 30<br />
5<br />
<strong>Basic</strong> <strong>Tools</strong> <strong>for</strong> <strong>Process</strong> <strong>Improvement</strong><br />
80 5 180<br />
HISTOGRAM VIEWGRAPH 7<br />
HISTOGRAM 9<br />
2<br />
5<br />
3<br />
4<br />
8<br />
5<br />
2<br />
2<br />
5<br />
190<br />
200<br />
210<br />
220<br />
230<br />
240<br />
260<br />
270<br />
280<br />
4<br />
4<br />
4<br />
2<br />
2<br />
4<br />
4<br />
3<br />
2<br />
290<br />
300<br />
310<br />
320<br />
330<br />
340<br />
360<br />
370<br />
380<br />
410<br />
1<br />
1<br />
1<br />
1<br />
1<br />
1<br />
1<br />
1<br />
1<br />
1
<strong>Basic</strong> <strong>Tools</strong> <strong>for</strong> <strong>Process</strong> <strong>Improvement</strong><br />
Step 3 - Compute the range <strong>for</strong> the data set. Compute the range by subtracting<br />
the smallest value in the data set from the largest value. The range represents<br />
the extent of the measurement scale covered by the data; it is always a positive<br />
number. The range <strong>for</strong> the data in Viewgraph 8 is 590 yards. This number is<br />
obtained by subtracting -180 from +410. The mathematical operation broken<br />
down in Viewgraph 8 is:<br />
+410 - (-180) = 410 + 180 = 590<br />
Remember that when you subtract a negative (-) number from another number it<br />
becomes a positive number.<br />
Step 4 - Determine the number of intervals required. The number of intervals<br />
influences the pattern, shape, or spread of your Histogram. Use the following<br />
table (Viewgraph 9) to determine how many intervals (or bars on the bar graph)<br />
you should use.<br />
If you have this Use this number<br />
many data points: of intervals:<br />
Less than 50 5 to 7<br />
50 to 99 6 to 10<br />
100 to 250 7 to 12<br />
More than 250 10 to 20<br />
For this example, 10 has been chosen as an appropriate number of intervals.<br />
10 HISTOGRAM
<strong>Basic</strong> <strong>Tools</strong> <strong>for</strong> <strong>Process</strong> <strong>Improvement</strong><br />
How to Construct a Histogram<br />
Step 3 - Compute the range <strong>for</strong> the data set<br />
Largest value = + 410 yards past target<br />
Smallest value = - 180 yards short of target<br />
Range of values = 590 yards<br />
Calculation: + 410 - (- 180) = 410 + 180 = 590<br />
HISTOGRAM VIEWGRAPH 8<br />
How to Construct a Histogram<br />
Step 4 - Determine the number of intervals<br />
required<br />
IF YOU HAVE THIS<br />
MANY DATA POINTS<br />
Less than 50<br />
50 to 99<br />
100 to 250<br />
More than 250<br />
USE THIS NUMBER<br />
OF INTERVALS:<br />
5 to 7 intervals<br />
6 to 10 intervals<br />
7 to 12 intervals<br />
10 to 20 intervals<br />
HISTOGRAM VIEWGRAPH 9<br />
HISTOGRAM 11
<strong>Basic</strong> <strong>Tools</strong> <strong>for</strong> <strong>Process</strong> <strong>Improvement</strong><br />
Step 5 - Compute the interval width. To compute the interval width (Viewgraph<br />
10), divide the range (590) by the number of intervals (10). When computing the<br />
interval width, you should round the data up to the next higher whole number to<br />
come up with values that are convenient to use. For example, if the range of data<br />
is 17, and you have decided to use 9 intervals, then your interval width is 1.88.<br />
You can round this up to 2.<br />
In this example, you divide 590 yards by 10 intervals, which gives an interval<br />
width of 59. This means that the length of every interval is going to be 59 yards.<br />
To facilitate later calculations, it is best to round off the value representing the<br />
width of the intervals. In this case, we will use 60, rather than 59, as the interval<br />
width.<br />
Step 6 - Determine the starting point <strong>for</strong> each interval. Use the smallest data<br />
point in your measurements as the starting point of the first interval. The starting<br />
point <strong>for</strong> the second interval is the sum of the smallest data point and the interval<br />
width. For example, if the smallest data point is -180, and the interval width is 60,<br />
the starting point <strong>for</strong> the second interval is -120. Follow this procedure<br />
(Viewgraph 11) to determine all of the starting points (-180 + 60 = -120; -120 + 60<br />
= -60; etc.).<br />
Step 7 - Count the number of points that fall within each interval. These are<br />
the data points that are equal to or greater than the starting value and less than<br />
the ending value (also illustrated in Viewgraph 11). For example, if the first<br />
interval begins with -180 and ends with -120, all data points that are equal to or<br />
greater than -180, but still less than -120, will be counted in the first interval. Keep<br />
in mind that EACH DATA POINT can appear in only one interval.<br />
12 HISTOGRAM
Interval<br />
Width<br />
Step 5 - Compute the interval width<br />
Range<br />
Number of<br />
Intervals<br />
HISTOGRAM VIEWGRAPH 10<br />
INTERVAL<br />
NUMBER<br />
1<br />
2<br />
3<br />
4<br />
5<br />
6<br />
7<br />
8<br />
9<br />
10<br />
<strong>Basic</strong> <strong>Tools</strong> <strong>for</strong> <strong>Process</strong> <strong>Improvement</strong><br />
How to Construct a Histogram<br />
=<br />
STARTING<br />
VALUE<br />
-180<br />
-120<br />
-060<br />
000<br />
060<br />
120<br />
180<br />
240<br />
300<br />
360<br />
=<br />
590<br />
10<br />
Use Use 10 10 <strong>for</strong> <strong>for</strong> the the<br />
number of of intervals<br />
INTERVAL<br />
WIDTH<br />
60<br />
60<br />
60<br />
60<br />
60<br />
60<br />
60<br />
60<br />
60<br />
60<br />
ENDING<br />
VALUE<br />
=<br />
59<br />
Round up<br />
to 60<br />
How to Construct a Histogram<br />
Step 6 - Determine the starting point of each interval<br />
Step 7 - Count the number of points in each interval<br />
Equal to or greater than the<br />
STARTING VALUE<br />
HISTOGRAM VIEWGRAPH 11<br />
-120<br />
-060<br />
000<br />
060<br />
120<br />
180<br />
240<br />
300<br />
360<br />
420<br />
But less than the<br />
ENDING VALUE<br />
NUMBER OF<br />
COUNTS<br />
HISTOGRAM 13<br />
3<br />
5<br />
13<br />
20<br />
22<br />
24<br />
20<br />
18<br />
6<br />
4
<strong>Basic</strong> <strong>Tools</strong> <strong>for</strong> <strong>Process</strong> <strong>Improvement</strong><br />
Step 8 - Plot the data. A more precise and refined picture comes into view once<br />
you plot your data (Viewgraph 12). You bring all of the previous steps together<br />
when you construct the graph.<br />
! The horizontal scale across the bottom of the graph contains the intervals that<br />
were calculated previously.<br />
! The vertical scale contains the count or frequency of observations within each<br />
of the intervals.<br />
! A bar is drawn <strong>for</strong> the height of each interval. The bars look like columns.<br />
! The height is determined by the number of observations or percentage of the<br />
total observations <strong>for</strong> each of the intervals.<br />
! The Histogram may not be perfectly symmetrical. Variations will occur. Ask<br />
yourself whether the picture is reasonable and logical, but be careful not to let<br />
your preconceived ideas influence your decisions unfairly.<br />
Step 9 - Add the title and legend. A title and a legend provide the who, what,<br />
when, where, and why (also illustrated in Viewgraph 12) that are important <strong>for</strong><br />
understanding and interpreting the data. This additional in<strong>for</strong>mation documents<br />
the nature of the data, where it came from, and when it was collected. The legend<br />
may include such things as the sample size, the dates and times involved, who<br />
collected the data, and identifiable equipment or work groups. It is important to<br />
include any in<strong>for</strong>mation that helps clarify what the data describes.<br />
14 HISTOGRAM
S<br />
H<br />
O<br />
T<br />
C<br />
O<br />
U<br />
N<br />
T<br />
LEGEND:<br />
25<br />
20<br />
15<br />
10<br />
5<br />
0<br />
<strong>Basic</strong> <strong>Tools</strong> <strong>for</strong> <strong>Process</strong> <strong>Improvement</strong><br />
How to Construct a Histogram<br />
Step 8 - Plot the data<br />
Step 9 - Add the title and legend<br />
MISS DISTANCE FOR MK 75 GUN TEST FIRING<br />
MISSES<br />
-180 -120 -060 000 060 120 180 240 300 360 420<br />
YARDS SHORT<br />
TARGET<br />
HITS<br />
YARDS LONG<br />
MISSES<br />
USS CROMMELIN (FFG-37), PACIFIC MISSILE FIRING RANGE, 135 BL&P ROUNDS/MOUNT 31, 25 JUNE 94<br />
HISTOGRAM VIEWGRAPH 12<br />
HISTOGRAM 15
<strong>Basic</strong> <strong>Tools</strong> <strong>for</strong> <strong>Process</strong> <strong>Improvement</strong><br />
How do we interpret a Histogram?<br />
A Histogram provides a visual representation so you can see where most of the<br />
measurements are located and how spread out they are. Your Histogram might<br />
show any of the following conditions (Viewgraph 13):<br />
! Most of the data were on target, with very little variation from it, as in<br />
Viewgraph 13A.<br />
! Although some data were on target, many others were dispersed away from<br />
the target, as in Viewgraph 13B.<br />
! Even when most of the data were close together, they were located off the<br />
target by a significant amount, as in Viewgraph 13C.<br />
! The data were off target and widely dispersed, as in Viewgraph 13D.<br />
This in<strong>for</strong>mation helps you see how well the process per<strong>for</strong>med and how consistent it<br />
was. You may be thinking, "So what? How will this help me do my job better?" Well,<br />
with the results of the process clearly depicted, we can find the answer to a vital<br />
question:<br />
Did the process produce goods and services which are within specification limits?<br />
Looking at the Histogram, you can see, not only whether you were within<br />
specification limits, but also how close to the target you were (Viewgraph 14).<br />
16 HISTOGRAM
Interpreting Histograms<br />
Location and Spread of Data<br />
A<br />
C<br />
<strong>Basic</strong> <strong>Tools</strong> <strong>for</strong> <strong>Process</strong> <strong>Improvement</strong><br />
Target Target<br />
Target Target<br />
HISTOGRAM VIEWGRAPH 13<br />
Interpreting Histograms<br />
Is <strong>Process</strong> Within Specification<br />
Limits?<br />
WITHIN LIMITS OUT OF SPEC<br />
LSL Target USL LSL Target USL<br />
LSL = Lower specification limit<br />
USL = Upper specification limit<br />
HISTOGRAM VIEWGRAPH 14<br />
HISTOGRAM 17<br />
B<br />
D
<strong>Basic</strong> <strong>Tools</strong> <strong>for</strong> <strong>Process</strong> <strong>Improvement</strong><br />
Portraying your data in a Histogram enables you to check rapidly on the number, or<br />
the percentage, of defects produced during the time you collected data. But unless<br />
you know whether the process was stable (Viewgraph 15), you won’t be able to<br />
predict whether future products will be within specification limits or determine a<br />
course of action to ensure that they are.<br />
A Histogram can show you whether or not your process is producing products or<br />
services that are within specification limits. To discover whether the process is<br />
stable, and to predict whether it can continue to produce within spec limits, you need<br />
to use a Control Chart (see the Control Chart module). Only after you have<br />
discovered whether your process is in or out of control can you determine an<br />
appropriate course of action—to eliminate special causes of variation, or to make<br />
fundamental changes to your process.<br />
There are times when a Histogram may look unusual to you. It might have more than<br />
one peak, be discontinued, or be skewed, with one tail longer than the other, as<br />
shown in Viewgraph 16. In these circumstances, the people involved in the process<br />
should ask themselves whether it really is unusual. The Histogram may not be<br />
symmetrical, but you may find out that it should look the way it does. On the other<br />
hand, the shape may show you that something is wrong, that data from several<br />
sources were mixed, <strong>for</strong> example, or different measurement devices were used, or<br />
operational definitions weren't applied. What is really important here is to avoid<br />
jumping to conclusions without properly examining the alternatives.<br />
18 HISTOGRAM
Target<br />
Interpreting Histograms<br />
<strong>Process</strong> Variation<br />
Day 1<br />
Target<br />
Day 2<br />
Day 3 Day 4<br />
Target<br />
Target<br />
HISTOGRAM VIEWGRAPH 15<br />
Skewed<br />
(not symmetrical)<br />
<strong>Basic</strong> <strong>Tools</strong> <strong>for</strong> <strong>Process</strong> <strong>Improvement</strong><br />
Interpreting Histograms<br />
Common Histogram Shapes<br />
Discontinued<br />
Symmetrical<br />
(mirror imaged)<br />
HISTOGRAM VIEWGRAPH 16<br />
HISTOGRAM 19
<strong>Basic</strong> <strong>Tools</strong> <strong>for</strong> <strong>Process</strong> <strong>Improvement</strong><br />
How can we practice what we've learned?<br />
Two exercises are provided that will take you through the nine steps <strong>for</strong> developing a<br />
Histogram. On the four pages that follow the scenario <strong>for</strong> Exercise 1 you will find a<br />
set of blank worksheets (Viewgraphs 17 through 23) to use in working through both<br />
of the exercises in this module.<br />
You will find a set of answer keys <strong>for</strong> Exercise 1 after the blank worksheets, and <strong>for</strong><br />
Exercise 2 after the description of its scenario. These answer keys represent only<br />
one possible set of answers. It's all right <strong>for</strong> you to choose an interval width or a<br />
number of intervals that is different from those used in the answer keys. Even<br />
though the shape of your Histogram may vary somewhat from the answer key's<br />
shape, it should be reasonably close unless you used a very different number of<br />
intervals.<br />
EXERCISE 1: The source of data <strong>for</strong> the first exercise is the following scenario. A<br />
list of the data collected follows this description. Use the blank worksheets in<br />
Viewgraphs 17 through 23 to do this exercise. You will find answer keys in<br />
Viewgraphs 24 through 30.<br />
Your corpsman is responsible <strong>for</strong> the semiannual Physical<br />
Readiness Test (PRT) screening <strong>for</strong> percent body fat. Prior<br />
to one PRT, the corpsman recorded the percent of body fat<br />
<strong>for</strong> the 80 personnel assigned to the command. These are<br />
the data collected:<br />
PERCENT BODY FAT RECORDED<br />
11 22 15 7 13 20 25 12 16 19<br />
4 14 11 16 18 32 10 16 17 10<br />
8 11 23 14 16 10 5 21 26 10<br />
23 12 10 16 17 24 11 20 9 13<br />
24 10 16 18 22 15 13 19 15 24<br />
11 20 15 13 9 18 22 16 18 9<br />
14 20 11 19 10 17 15 12 17 11<br />
17 11 15 11 15 16 12 28 14 13<br />
20 HISTOGRAM
<strong>Basic</strong> <strong>Tools</strong> <strong>for</strong> <strong>Process</strong> <strong>Improvement</strong><br />
WORKSHEET<br />
Step 1 - Count the number of data points<br />
TOTAL NUMBER =<br />
HISTOGRAM VIEWGRAPH 17<br />
WORKSHEET<br />
Step 2 - Summarize the data on a tally sheet<br />
VALUE TALLY VALUE TALLY VALUE TALLY VALUE TALLY VALUE TALLY<br />
HISTOGRAM VIEWGRAPH 18<br />
HISTOGRAM 21
<strong>Basic</strong> <strong>Tools</strong> <strong>for</strong> <strong>Process</strong> <strong>Improvement</strong><br />
WORKSHEET<br />
Step 3 - Compute the range <strong>for</strong> the data set<br />
Largest value = _______________<br />
Smallest value = _______________<br />
________________________________________<br />
Range of values = _______________<br />
HISTOGRAM VIEWGRAPH 19<br />
WORKSHEET<br />
Step 4 - Determine the number of intervals<br />
IF YOU HAVE THIS<br />
MANY DATA POINTS<br />
Less than 50<br />
50 to 99<br />
100 to 250<br />
More than 250<br />
USE THIS NUMBER<br />
OF INTERVALS:<br />
5 to 7 intervals<br />
6 to 10 intervals<br />
7 to 12 intervals<br />
10 to 20 intervals<br />
HISTOGRAM VIEWGRAPH 20<br />
22 HISTOGRAM
Interval<br />
Width<br />
<strong>Basic</strong> <strong>Tools</strong> <strong>for</strong> <strong>Process</strong> <strong>Improvement</strong><br />
WORKSHEET<br />
Step 5 - Compute the interval width<br />
=<br />
Range<br />
Number of<br />
Intervals<br />
= =<br />
Round up to<br />
next higher<br />
whole number<br />
HISTOGRAM VIEWGRAPH 21<br />
WORKSHEET<br />
Step 6 - Determine the starting point of each interval<br />
Step 7 - Count the number of points in each interval<br />
INTERVAL STARTING INTERVAL ENDING NUMBER<br />
NUMBER VALUE WIDTH VALUE OF COUNTS<br />
1<br />
2<br />
3<br />
4<br />
5<br />
6<br />
7<br />
8<br />
9<br />
10<br />
HISTOGRAM VIEWGRAPH 22<br />
HISTOGRAM 23
<strong>Basic</strong> <strong>Tools</strong> <strong>for</strong> <strong>Process</strong> <strong>Improvement</strong><br />
WORKSHEET<br />
Step 8 - Plot the data<br />
Step 9 - Add title and legend<br />
HISTOGRAM VIEWGRAPH 23<br />
24 HISTOGRAM
EXERCISE 1 ANSWER KEY<br />
Step 1 - Count the number of data points<br />
11 22 15 7 13 20 25 12 16 19<br />
4 14 11 16 18 32 10 16 17 10<br />
8 11 23 14 16 10 5 21 26 10<br />
23 12 10 16 17 24 11 20 9 13<br />
24 10 16 18 22 15 13 19 15 24<br />
11 20 15 13 9 18 22 16 18 9<br />
14 20 11 19 10 17 15 12 17 11<br />
17 11 15 11 15 16 12 28 14 13<br />
TOTAL = 80<br />
HISTOGRAM VIEWGRAPH 24<br />
EXERCISE 1 ANSWER KEY<br />
Step 2 - Summarize the data on a tally sheet<br />
%<br />
FAT NO. OF PERS<br />
0 0<br />
1 0<br />
2 0<br />
3 0<br />
4 1<br />
5 1<br />
6 0<br />
7 1<br />
8 1<br />
9 3<br />
10 7<br />
<strong>Basic</strong> <strong>Tools</strong> <strong>for</strong> <strong>Process</strong> <strong>Improvement</strong><br />
%<br />
FAT NO. OF PERS<br />
11 9<br />
12 4<br />
13 5<br />
14 4<br />
15 7<br />
16 8<br />
17 5<br />
18 4<br />
19 3<br />
20 4<br />
21 1<br />
%<br />
FAT NO. OF PERS<br />
22 3<br />
23 2<br />
24 3<br />
25 1<br />
26 1<br />
27 0<br />
28 1<br />
29 0<br />
30 0<br />
31 0<br />
32 1<br />
HISTOGRAM VIEWGRAPH 25<br />
HISTOGRAM 25
<strong>Basic</strong> <strong>Tools</strong> <strong>for</strong> <strong>Process</strong> <strong>Improvement</strong><br />
EXERCISE 1 ANSWER KEY<br />
Step 3 - Compute the range <strong>for</strong> the data set<br />
Largest value = 32 Percent body fat<br />
Smallest value = 4 Percent body fat<br />
_________________________________________<br />
Range of values = 28 Percent body fat<br />
HISTOGRAM VIEWGRAPH 26<br />
EXERCISE 1 ANSWER KEY<br />
Step 4 - Determine the number of intervals<br />
IF YOU HAVE THIS<br />
MANY DATA POINTS<br />
Less than 50<br />
50 to 99<br />
100 to 250<br />
More than 250<br />
USE THIS NUMBER<br />
OF INTERVALS:<br />
5 to 7 intervals<br />
6 to 10 intervals<br />
7 to 12 intervals<br />
10 to 20 intervals<br />
HISTOGRAM VIEWGRAPH 27<br />
26 HISTOGRAM
Interval<br />
Width<br />
<strong>Basic</strong> <strong>Tools</strong> <strong>for</strong> <strong>Process</strong> <strong>Improvement</strong><br />
Equal to or greater than<br />
the STARTING VALUE<br />
EXERCISE 1 ANSWER KEY<br />
Step 5 - Compute the interval width<br />
=<br />
Range<br />
Number of<br />
Intervals<br />
Use 8 <strong>for</strong> the number<br />
of intervals<br />
28<br />
= =<br />
8<br />
HISTOGRAM VIEWGRAPH 28<br />
EXERCISE 1 ANSWER KEY<br />
Step 6 - Determine the starting point of each interval<br />
Step 7 - Count the number of points in each interval<br />
INTERVAL STARTING INTERVAL ENDING NUMBER<br />
NUMBER VALUE WIDTH VALUE OF COUNTS<br />
1 4 + 4 8 3<br />
2 8 + 4 12 20<br />
3 12 + 4 16 20<br />
4 16 + 4 20 20<br />
5 20 + 4 24 10<br />
6 24 + 4 28 5<br />
7 28 + 4 32 1<br />
8 32 + 4 36 1<br />
But less than<br />
the ENDING VALUE<br />
HISTOGRAM VIEWGRAPH 29<br />
3.5<br />
Round up<br />
to 4<br />
HISTOGRAM 27
NO. OF PERSONNEL<br />
20<br />
18<br />
16<br />
14<br />
12<br />
10<br />
8<br />
6<br />
4<br />
2<br />
0<br />
<strong>Basic</strong> <strong>Tools</strong> <strong>for</strong> <strong>Process</strong> <strong>Improvement</strong><br />
0<br />
EXERCISE 1 ANSWER KEY<br />
Step 8 - Plot the data<br />
Step 9 - Add title and legend<br />
JUNE 94 PRT PERCENT BODY FAT<br />
SATISFACTORY % BODY FAT<br />
4 8 12 16 20 24 28 32 36<br />
PERCENT BODY FAT<br />
LEGEND: USS LEADER (MSO-490), 25 JUNE 94, ALL 80 PERSONNEL SAMPLED<br />
HISTOGRAM VIEWGRAPH 30<br />
28 HISTOGRAM
<strong>Basic</strong> <strong>Tools</strong> <strong>for</strong> <strong>Process</strong> <strong>Improvement</strong><br />
EXERCISE 2: The source of data <strong>for</strong> the second exercise is the following scenario.<br />
A listing of the data collected follows this description. Use the blank worksheets in<br />
Viewgraphs 17 through 23 to do this exercise. You will find answer keys in<br />
Viewgraphs 31 through 37.<br />
A Marine Corps small arms instructor was per<strong>for</strong>ming an<br />
analysis of 9 mm pistol marksmanship scores to improve<br />
training methods. For every class of 25, the instructor<br />
recorded the scores <strong>for</strong> each student who occupied the<br />
first four firing positions at the small arms range. The<br />
instructor then averaged the scores <strong>for</strong> each class,<br />
maintaining a database on 105 classes. These are the<br />
data collected:<br />
AVERAGE SMALL ARMS SCORES<br />
160 190 155 300 280 185 250 285 200 165<br />
175 190 210 225 275 240 170 185 215 220<br />
270 265 255 235 170 175 185 195 200 260<br />
180 245 270 200 200 220 265 270 250 230<br />
255 180 260 240 245 170 205 260 215 185<br />
255 245 210 225 225 235 230 230 195 225<br />
230 255 235 195 220 210 235 240 200 220<br />
195 235 230 215 225 235 225 200 245 230<br />
220 215 225 250 220 245 195 235 225 230<br />
210 240 215 230 220 225 200 235 215 240<br />
220 230 225 215 225<br />
HISTOGRAM 29
EXERCISE 2 ANSWER KEY<br />
Step 1 - Count the number of data points<br />
160 190 155 300 280 185 250 285 200 165<br />
175 190 210 225 275 240 170 185 215 220<br />
270 265 255 235 170 175 185 195 200 260<br />
180 245 270 200 200 220 265 270 250 230<br />
255 180 260 240 245 170 205 260 215 185<br />
255 245 210 225 225 235 230 230 195 225<br />
230 255 235 195 220 210 235 240 200 220<br />
195 235 230 215 225 235 225 200 245 230<br />
220 215 225 250 220 245 195 235 225 230<br />
210 240 215 230 220 225 200 235 215 240<br />
220 230 225 215 225<br />
TOTAL = 105<br />
HISTOGRAM VIEWGRAPH 31<br />
155 1<br />
160 1<br />
165 1<br />
170 3<br />
175 2<br />
180 2<br />
185 4<br />
190 2<br />
195 5<br />
200 7<br />
<strong>Basic</strong> <strong>Tools</strong> <strong>for</strong> <strong>Process</strong> <strong>Improvement</strong><br />
EXERCISE 2 ANSWER KEY<br />
Step 2 - Summarize the data on a tally sheet<br />
SCORE TALLY SCORE TALLY SCORE TALLY<br />
205 1<br />
210 4<br />
215 7<br />
220 8<br />
225 11<br />
230 9<br />
235 8<br />
240 5<br />
245 5<br />
250 3<br />
255 4<br />
260 3<br />
265 2<br />
270 3<br />
275 1<br />
280 1<br />
285 1<br />
290 0<br />
295 0<br />
300 1<br />
HISTOGRAM VIEWGRAPH 32<br />
30 HISTOGRAM
<strong>Basic</strong> <strong>Tools</strong> <strong>for</strong> <strong>Process</strong> <strong>Improvement</strong><br />
EXERCISE 2 ANSWER KEY<br />
Step 3 - Compute the range <strong>for</strong> the data set<br />
Largest value = 300 Points<br />
Smallest value = 155 Points<br />
__________________________________<br />
Range of values = 145 Points<br />
HISTOGRAM VIEWGRAPH 33<br />
EXERCISE 2 ANSWER KEY<br />
Step 4 - Determine the number of intervals<br />
IF YOU HAVE THIS<br />
MANY DATA POINTS<br />
Less than 50<br />
50 to 99<br />
100 to 250<br />
More than 250<br />
USE THIS NUMBER<br />
OF INTERVALS:<br />
5 to 7 intervals<br />
6 to 10 intervals<br />
7 to 12 intervals<br />
10 to 20 intervals<br />
HISTOGRAM VIEWGRAPH 34<br />
HISTOGRAM 31
Interval<br />
Width<br />
<strong>Basic</strong> <strong>Tools</strong> <strong>for</strong> <strong>Process</strong> <strong>Improvement</strong><br />
EXERCISE 2 ANSWER KEY<br />
Step 5 - Compute the interval width<br />
=<br />
HISTOGRAM VIEWGRAPH 35<br />
EXERCISE 2 ANSWER KEY<br />
Step 6 - Determine the starting point of each interval<br />
Step 7 - Count the number of points in each interval<br />
INTERVAL STARTING INTERVAL ENDING NUMBER<br />
NUMBER VALUE WIDTH VALUE OF COUNTS<br />
1 155 + 15 170 3<br />
2 170 + 15 185 7<br />
3 185 + 15 200 11<br />
4 200 + 15 215 12<br />
5 215 + 15 230 26<br />
6 230 + 15 245 22<br />
7 245 + 15 260 12<br />
8 260 + 15 275 8<br />
9 275 + 15 290 3<br />
10 290 + 15 300 1<br />
Equal to or greater than<br />
the STARTING VALUE<br />
Range<br />
Number of<br />
Intervals<br />
Use 10 <strong>for</strong> the number<br />
of intervals<br />
145<br />
= =<br />
10<br />
But less than<br />
the ENDING VALUE<br />
14.5<br />
Round up<br />
to 15<br />
HISTOGRAM VIEWGRAPH 36<br />
32 HISTOGRAM
NO. OF PERSONNEL<br />
30<br />
25<br />
20<br />
15<br />
10<br />
5<br />
0<br />
<strong>Basic</strong> <strong>Tools</strong> <strong>for</strong> <strong>Process</strong> <strong>Improvement</strong><br />
EXERCISE 2 ANSWER KEY<br />
Step 8 - Plot the data<br />
Step 9 - Add title and legend<br />
MARKSMANSHIP SCORES FOR 9mm PISTOL<br />
155 170 185 200 215 230 245 260 275 290 300<br />
SCORES<br />
LEGEND: MCBH KANEOHE BAY, HI; AVERAGE OF 4 SCORES PER CLASS, 105 CLASSES, 1 JUNE 94 - 15 JULY 94<br />
HISTOGRAM VIEWGRAPH 37<br />
HISTOGRAM 33
REFERENCES:<br />
<strong>Basic</strong> <strong>Tools</strong> <strong>for</strong> <strong>Process</strong> <strong>Improvement</strong><br />
1. Brassard, M. (1988). The Memory Jogger, A Pocket Guide of <strong>Tools</strong> <strong>for</strong><br />
Continuous <strong>Improvement</strong>, pp. 36 - 43. Methuen, MA: GOAL/QPC.<br />
2. Department of the Navy (November 1992), Fundamentals of Total Quality<br />
Leadership (Instructor Guide), pp. 6-44 - 6-47. San Diego, CA: Navy Personnel<br />
Research and Development Center.<br />
3. Department of the Navy (September 1993). Systems Approach to <strong>Process</strong><br />
<strong>Improvement</strong> (Instructor Guide), pp. 10-17 - 10-38. San Diego, CA: OUSN Total<br />
Quality Leadership Office and Navy Personnel Research and Development<br />
Center.<br />
4. Naval Medical Quality Institute (Undated). Total Quality Leader's Course (Student<br />
Guide), pp. U-26 - U-28. Bethesda, MD.<br />
34 HISTOGRAM
HISTOGRAM VIEWGRAPH 1<br />
• A bar graph that shows the distribution of data<br />
• A snapshot of data taken from a process<br />
0 5 10 15 20 25 30 35 40 45 50 55 60<br />
0<br />
20<br />
40<br />
60<br />
80<br />
100<br />
What Is a Histogram?
HISTOGRAM VIEWGRAPH 2<br />
• Assist in decision making<br />
• Communicate in<strong>for</strong>mation to the team<br />
• Compare measurements to specifications<br />
• Summarize large data sets graphically<br />
When Are Histograms Used?
HISTOGRAM VIEWGRAPH 3<br />
5<br />
1 Title 2 Horizontal / X-axis<br />
3 Bars 4 Vertical / Y-axis<br />
5 Legend<br />
MEAN TIME BETWEEN FAILURE (IN DAYS) FOR R-1051 HF RECEIVER<br />
Data taken at SIMA, Pearl Harbor, 15 May - 15 July 94<br />
0 5 10 15 20 25 30 35 40 45 50 55 60<br />
DAYS OF OPERATION<br />
2<br />
0<br />
F<br />
R<br />
E<br />
Q<br />
U<br />
E<br />
N<br />
C<br />
Y<br />
20<br />
4<br />
40<br />
3<br />
60<br />
80<br />
100<br />
DAYS OF OPERATION PRIOR TO<br />
FAILURE FOR AN HF RECEIVER<br />
1<br />
Parts of a Histogram
HISTOGRAM VIEWGRAPH 4<br />
Step 5 - Compute interval width<br />
Step 4 - Determine number of intervals<br />
Step 3 - Compute the range<br />
Step 2 - Summarize on a tally sheet<br />
Step 1 - Count number of data points<br />
Constructing a Histogram
HISTOGRAM VIEWGRAPH 5<br />
Step 9 - Add title and legend<br />
Step 8 - Plot the data<br />
Step 7 - Count number of points in<br />
each interval<br />
Step 6 - Determine interval starting<br />
points<br />
Constructing a Histogram
HISTOGRAM VIEWGRAPH 6<br />
-180 30 190 380 330 140 160 270 10 - 90<br />
- 10 30 60 230 90 120 10 50 250 180<br />
-130 220 170 130 - 50 - 80 180 100 110 200<br />
260 190 -100 150 210 140 -130 130 150 370<br />
160 180 240 260 - 20 - 80 30 80 240 130<br />
210 40 70 - 70 250 360 120 - 60 - 30 200<br />
50 20 30 280 410 70 - 10 20 130 170<br />
140 220 - 40 290 90 100 - 30 340 20 80<br />
210 130 350 250 - 20 230 180 130 - 30 210<br />
-30 80 270 320 30 240 120 100 20 70<br />
300 260 20 40 - 20 250 310 40 200 190<br />
110 -30 50 240 180 50 130 200 280 60<br />
260 70 100 140 80 190 100 270 140 80<br />
110 130 120 30 70<br />
TOTAL = 135<br />
Number of yards long (+ data) and yards short (- data) that a gun crew missed its target.<br />
Step 1 - Count the total number of data points<br />
How to Construct a Histogram
HISTOGRAM VIEWGRAPH 7<br />
410<br />
1<br />
- 180 1 - 20 3 90 2 190 4 290 1<br />
- 130 2 - 10 2 100 5 200 4 300 1<br />
- 100 1 10 2 110 3 210 4 310 1<br />
- 90 1 20 5 120 4 220 2 320 1<br />
- 80 2 30 6 130 8 230 2 330 1<br />
- 70 1 40 3 140 5 240 4 340 1<br />
- 60 1 50 4 150 2 250 4 350 1<br />
- 50 1 60 2 160 2 260 4 360 1<br />
- 40 1 70 5 170 2 270 3 370 1<br />
- 30 5 80 5 180 5 280 2 380 1<br />
DATA TALLY DATA TALLY DATA TALLY DATA TALLY DATA TALLY<br />
Step 2 - Summarize the data on a tally sheet<br />
How to Construct a Histogram
HISTOGRAM VIEWGRAPH 8<br />
Calculation: + 410 - (- 180) = 410 + 180 = 590<br />
Range of values = 590 yards<br />
Smallest value = - 180 yards short of target<br />
Largest value = + 410 yards past target<br />
Step 3 - Compute the range <strong>for</strong> the data set<br />
How to Construct a Histogram
HISTOGRAM VIEWGRAPH 9<br />
More than 250<br />
10 to 20 intervals<br />
100 to 250<br />
7 to 12 intervals<br />
50 to 99<br />
6 to 10 intervals<br />
Less than 50<br />
5 to 7 intervals<br />
IF YOU HAVE THIS<br />
MANY DATA POINTS<br />
USE THIS NUMBER<br />
OF INTERVALS:<br />
Step 4 - Determine the number of intervals<br />
required<br />
How to Construct a Histogram
HISTOGRAM VIEWGRAPH 10<br />
Round up<br />
to 60<br />
Use Use 10 10 <strong>for</strong> <strong>for</strong> the the<br />
number of of intervals<br />
Number of<br />
Intervals<br />
Interval<br />
Width<br />
10<br />
=<br />
=<br />
=<br />
59<br />
Range<br />
590<br />
Step 5 - Compute the interval width<br />
How to Construct a Histogram
HISTOGRAM VIEWGRAPH 11<br />
Equal to or greater than the<br />
STARTING VALUE<br />
But less than the<br />
ENDING VALUE<br />
10<br />
360<br />
60<br />
420<br />
4<br />
9<br />
300<br />
60<br />
360<br />
6<br />
8<br />
240<br />
60<br />
300<br />
18<br />
7<br />
180<br />
60<br />
240<br />
20<br />
6<br />
120<br />
60<br />
180<br />
24<br />
5<br />
060<br />
60<br />
120<br />
22<br />
4<br />
000<br />
60<br />
060<br />
20<br />
3<br />
-060<br />
60<br />
000<br />
13<br />
2<br />
-120<br />
60<br />
-060<br />
5<br />
1<br />
-180<br />
60<br />
-120<br />
3<br />
INTERVAL<br />
NUMBER<br />
STARTING<br />
VALUE<br />
INTERVAL<br />
WIDTH<br />
ENDING<br />
VALUE<br />
NUMBER OF<br />
COUNTS<br />
Step 7 - Count the number of points in each interval<br />
Step 6 - Determine the starting point of each interval<br />
How to Construct a Histogram
HISTOGRAM VIEWGRAPH 12<br />
LEGEND:<br />
USS CROMMELIN (FFG-37), PACIFIC MISSILE FIRING RANGE, 135 BL&P ROUNDS/MOUNT 31, 25 JUNE 94<br />
TARGET<br />
YARDS SHORT<br />
YARDS LONG<br />
-180 -120 -060 000 060 120 180 240 300 360 420<br />
0<br />
C<br />
O<br />
U<br />
N<br />
T<br />
5<br />
10<br />
15<br />
S<br />
H<br />
O<br />
T<br />
20<br />
25<br />
MISSES<br />
MISSES<br />
HITS<br />
MISS DISTANCE FOR MK 75 GUN TEST FIRING<br />
Step 8 - Plot the data<br />
Step 9 - Add the title and legend<br />
How to Construct a Histogram
HISTOGRAM VIEWGRAPH 13<br />
Target Target<br />
C<br />
D<br />
Target Target<br />
A<br />
B<br />
Interpreting Histograms<br />
Location and Spread of Data
HISTOGRAM VIEWGRAPH 14<br />
LSL = Lower specification limit<br />
USL = Upper specification limit<br />
LSL Target USL LSL Target USL<br />
WITHIN LIMITS OUT OF SPEC<br />
Interpreting Histograms<br />
Is <strong>Process</strong> Within Specification<br />
Limits?
HISTOGRAM VIEWGRAPH 15<br />
Target<br />
Target<br />
Day 3 Day 4<br />
Target<br />
Target<br />
Day 1<br />
Day 2<br />
Interpreting Histograms<br />
<strong>Process</strong> Variation
HISTOGRAM VIEWGRAPH 16<br />
Symmetrical<br />
(mirror imaged)<br />
Discontinued<br />
Skewed<br />
(not symmetrical)<br />
Interpreting Histograms<br />
Common Histogram Shapes
HISTOGRAM VIEWGRAPH 17<br />
TOTAL NUMBER =<br />
Step 1 - Count the number of data points<br />
WORKSHEET
HISTOGRAM VIEWGRAPH 18<br />
VALUE TALLY VALUE TALLY VALUE TALLY VALUE TALLY VALUE TALLY<br />
Step 2 - Summarize the data on a tally sheet<br />
WORKSHEET
HISTOGRAM VIEWGRAPH 19<br />
Range of values = _______________<br />
________________________________________<br />
Smallest value = _______________<br />
Largest value = _______________<br />
Step 3 - Compute the range <strong>for</strong> the data set<br />
WORKSHEET
HISTOGRAM VIEWGRAPH 20<br />
More than 250<br />
10 to 20 intervals<br />
100 to 250<br />
7 to 12 intervals<br />
50 to 99<br />
6 to 10 intervals<br />
Less than 50<br />
5 to 7 intervals<br />
IF YOU HAVE THIS<br />
MANY DATA POINTS<br />
USE THIS NUMBER<br />
OF INTERVALS:<br />
Step 4 - Determine the number of intervals<br />
WORKSHEET
HISTOGRAM VIEWGRAPH 21<br />
Round up to<br />
next higher<br />
whole number<br />
Number of<br />
Intervals<br />
Interval<br />
Width<br />
=<br />
= =<br />
Range<br />
Step 5 - Compute the interval width<br />
WORKSHEET
HISTOGRAM VIEWGRAPH 22<br />
INTERVAL STARTING INTERVAL ENDING NUMBER<br />
NUMBER VALUE WIDTH VALUE OF COUNTS<br />
1<br />
2<br />
3<br />
4<br />
5<br />
6<br />
7<br />
8<br />
9<br />
10<br />
Step 7 - Count the number of points in each interval<br />
Step 6 - Determine the starting point of each interval<br />
WORKSHEET
HISTOGRAM VIEWGRAPH 23<br />
Step 8 - Plot the data<br />
Step 9 - Add title and legend<br />
WORKSHEET
HISTOGRAM VIEWGRAPH 24<br />
TOTAL = 80<br />
17 11 15 11 15 16 12 28 14 13<br />
14 20 11 19 10 17 15 12 17 11<br />
11 20 15 13 9 18 22 16 18 9<br />
24 10 16 18 22 15 13 19 15 24<br />
23 12 10 16 17 24 11 20 9 13<br />
8 11 23 14 16 10 5 21 26 10<br />
4 14 11 16 18 32 10 16 17 10<br />
11 22 15 7 13 20 25 12 16 19<br />
Step 1 - Count the number of data points<br />
EXERCISE 1 ANSWER KEY
HISTOGRAM VIEWGRAPH 25<br />
%<br />
FAT NO. OF PERS<br />
0 0<br />
1 0<br />
2 0<br />
3 0<br />
4 1<br />
5 1<br />
6 0<br />
7 1<br />
8 1<br />
9 3<br />
10 7<br />
%<br />
FAT NO. OF PERS<br />
11 9<br />
12 4<br />
13 5<br />
14 4<br />
15 7<br />
16 8<br />
17 5<br />
18 4<br />
19 3<br />
20 4<br />
21 1<br />
%<br />
FAT NO. OF PERS<br />
22 3<br />
23 2<br />
24 3<br />
25 1<br />
26 1<br />
27 0<br />
28 1<br />
29 0<br />
30 0<br />
31 0<br />
32 1<br />
Step 2 - Summarize the data on a tally sheet<br />
EXERCISE 1 ANSWER KEY
HISTOGRAM VIEWGRAPH 26<br />
Range of values = 28 Percent body fat<br />
_________________________________________<br />
Smallest value = 4 Percent body fat<br />
Largest value = 32 Percent body fat<br />
Step 3 - Compute the range <strong>for</strong> the data set<br />
EXERCISE 1 ANSWER KEY
HISTOGRAM VIEWGRAPH 27<br />
More than 250<br />
10 to 20 intervals<br />
100 to 250<br />
7 to 12 intervals<br />
50 to 99<br />
6 to 10 intervals<br />
Less than 50<br />
5 to 7 intervals<br />
IF YOU HAVE THIS<br />
MANY DATA POINTS<br />
USE THIS NUMBER<br />
OF INTERVALS:<br />
Step 4 - Determine the number of intervals<br />
EXERCISE 1 ANSWER KEY
HISTOGRAM VIEWGRAPH 28<br />
Round up<br />
to 4<br />
Use 8 <strong>for</strong> the number<br />
of intervals<br />
Number of<br />
Intervals<br />
Interval<br />
Width<br />
=<br />
3.5<br />
Range<br />
28<br />
= =<br />
8<br />
Step 5 - Compute the interval width<br />
EXERCISE 1 ANSWER KEY
HISTOGRAM VIEWGRAPH 29<br />
Equal to or greater than<br />
the STARTING VALUE<br />
But less than<br />
the ENDING VALUE<br />
7 28 + 4 32 1<br />
8 32 + 4 36 1<br />
5 20 + 4 24 10<br />
6 24 + 4 28 5<br />
3 12 + 4 16 20<br />
4 16 + 4 20 20<br />
1 4 + 4 8 3<br />
2 8 + 4 12 20<br />
INTERVAL STARTING INTERVAL ENDING NUMBER<br />
NUMBER VALUE WIDTH VALUE OF COUNTS<br />
Step 7 - Count the number of points in each interval<br />
Step 6 - Determine the starting point of each interval<br />
EXERCISE 1 ANSWER KEY
HISTOGRAM VIEWGRAPH 30<br />
LEGEND: USS LEADER (MSO-490), 25 JUNE 94, ALL 80 PERSONNEL SAMPLED<br />
0<br />
4 8 12 16 20 24 28 32 36<br />
PERCENT BODY FAT<br />
0<br />
2<br />
4<br />
NO. OF PERSONNEL<br />
6<br />
8<br />
10<br />
12<br />
14<br />
16<br />
18<br />
20<br />
SATISFACTORY % BODY FAT<br />
JUNE 94 PRT PERCENT BODY FAT<br />
Step 8 - Plot the data<br />
Step 9 - Add title and legend<br />
EXERCISE 1 ANSWER KEY
HISTOGRAM VIEWGRAPH 31<br />
TOTAL = 105<br />
220 230 225 215 225<br />
210 240 215 230 220 225 200 235 215 240<br />
220 215 225 250 220 245 195 235 225 230<br />
195 235 230 215 225 235 225 200 245 230<br />
230 255 235 195 220 210 235 240 200 220<br />
255 245 210 225 225 235 230 230 195 225<br />
255 180 260 240 245 170 205 260 215 185<br />
180 245 270 200 200 220 265 270 250 230<br />
270 265 255 235 170 175 185 195 200 260<br />
175 190 210 225 275 240 170 185 215 220<br />
160 190 155 300 280 185 250 285 200 165<br />
Step 1 - Count the number of data points<br />
EXERCISE 2 ANSWER KEY
HISTOGRAM VIEWGRAPH 32<br />
200 7<br />
250 3<br />
300 1<br />
195 5<br />
245 5<br />
295 0<br />
190 2<br />
240 5<br />
290 0<br />
185 4<br />
235 8<br />
285 1<br />
180 2<br />
230 9<br />
280 1<br />
175 2<br />
225 11<br />
275 1<br />
170 3<br />
220 8<br />
270 3<br />
165 1<br />
215 7<br />
265 2<br />
160 1<br />
210 4<br />
260 3<br />
155 1<br />
205 1<br />
255 4<br />
SCORE TALLY SCORE TALLY SCORE TALLY<br />
Step 2 - Summarize the data on a tally sheet<br />
EXERCISE 2 ANSWER KEY
HISTOGRAM VIEWGRAPH 33<br />
Range of values = 145 Points<br />
__________________________________<br />
Smallest value = 155 Points<br />
Largest value = 300 Points<br />
Step 3 - Compute the range <strong>for</strong> the data set<br />
EXERCISE 2 ANSWER KEY
HISTOGRAM VIEWGRAPH 34<br />
More than 250<br />
10 to 20 intervals<br />
100 to 250<br />
7 to 12 intervals<br />
50 to 99<br />
6 to 10 intervals<br />
Less than 50<br />
5 to 7 intervals<br />
IF YOU HAVE THIS<br />
MANY DATA POINTS<br />
USE THIS NUMBER<br />
OF INTERVALS:<br />
Step 4 - Determine the number of intervals<br />
EXERCISE 2 ANSWER KEY
HISTOGRAM VIEWGRAPH 35<br />
Round up<br />
to 15<br />
Use 10 <strong>for</strong> the number<br />
of intervals<br />
Number of<br />
Intervals<br />
Interval<br />
Width<br />
=<br />
14.5<br />
Range<br />
145<br />
= =<br />
10<br />
Step 5 - Compute the interval width<br />
EXERCISE 2 ANSWER KEY
HISTOGRAM VIEWGRAPH 36<br />
Equal to or greater than<br />
the STARTING VALUE<br />
But less than<br />
the ENDING VALUE<br />
1 155 + 15 170 3<br />
2 170 + 15 185 7<br />
3 185 + 15 200 11<br />
4 200 + 15 215 12<br />
5 215 + 15 230 26<br />
6 230 + 15 245 22<br />
7 245 + 15 260 12<br />
8 260 + 15 275 8<br />
9 275 + 15 290 3<br />
10 290 + 15 300 1<br />
INTERVAL STARTING INTERVAL ENDING NUMBER<br />
NUMBER VALUE WIDTH VALUE OF COUNTS<br />
Step 7 - Count the number of points in each interval<br />
Step 6 - Determine the starting point of each interval<br />
EXERCISE 2 ANSWER KEY
HISTOGRAM VIEWGRAPH 37<br />
LEGEND: MCBH KANEOHE BAY, HI; AVERAGE OF 4 SCORES PER CLASS, 105 CLASSES, 1 JUNE 94 - 15 JULY 94<br />
SCORES<br />
155 170 185 200 215 230 245 260 275 290 300<br />
NO. OF PERSONNEL<br />
30<br />
25<br />
20<br />
15<br />
10<br />
5<br />
0<br />
MARKSMANSHIP SCORES FOR 9mm PISTOL<br />
Step 9 - Add title and legend<br />
Step 8 - Plot the data<br />
EXERCISE 2 ANSWER KEY