Basic Tools for Process Improvement
Basic Tools for Process Improvement
Basic Tools for Process Improvement
You also want an ePaper? Increase the reach of your titles
YUMPU automatically turns print PDFs into web optimized ePapers that Google loves.
<strong>Basic</strong> <strong>Tools</strong> <strong>for</strong> <strong>Process</strong> <strong>Improvement</strong><br />
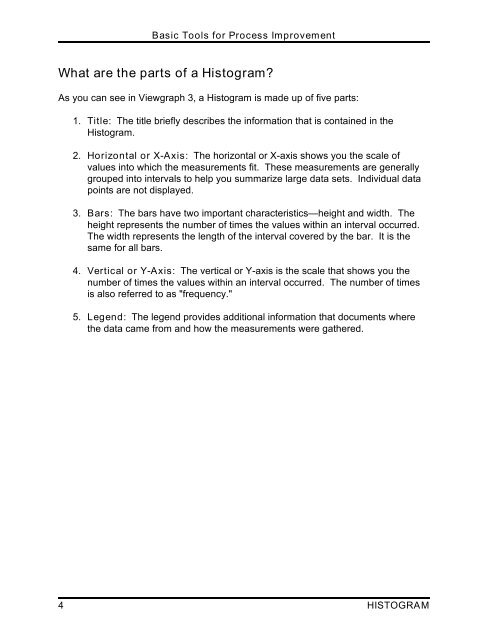
What are the parts of a Histogram?<br />
As you can see in Viewgraph 3, a Histogram is made up of five parts:<br />
1. Title: The title briefly describes the in<strong>for</strong>mation that is contained in the<br />
Histogram.<br />
2. Horizontal or X-Axis: The horizontal or X-axis shows you the scale of<br />
values into which the measurements fit. These measurements are generally<br />
grouped into intervals to help you summarize large data sets. Individual data<br />
points are not displayed.<br />
3. Bars: The bars have two important characteristics—height and width. The<br />
height represents the number of times the values within an interval occurred.<br />
The width represents the length of the interval covered by the bar. It is the<br />
same <strong>for</strong> all bars.<br />
4. Vertical or Y-Axis: The vertical or Y-axis is the scale that shows you the<br />
number of times the values within an interval occurred. The number of times<br />
is also referred to as "frequency."<br />
5. Legend: The legend provides additional in<strong>for</strong>mation that documents where<br />
the data came from and how the measurements were gathered.<br />
4 HISTOGRAM


