Basic Tools for Process Improvement
Basic Tools for Process Improvement
Basic Tools for Process Improvement

You also want an ePaper? Increase the reach of your titles
YUMPU automatically turns print PDFs into web optimized ePapers that Google loves.
<strong>Basic</strong> <strong>Tools</strong> <strong>for</strong> <strong>Process</strong> <strong>Improvement</strong><br />
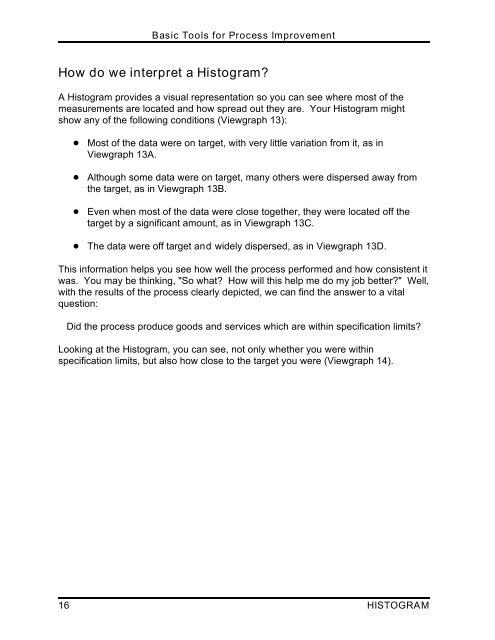
How do we interpret a Histogram?<br />
A Histogram provides a visual representation so you can see where most of the<br />
measurements are located and how spread out they are. Your Histogram might<br />
show any of the following conditions (Viewgraph 13):<br />
! Most of the data were on target, with very little variation from it, as in<br />
Viewgraph 13A.<br />
! Although some data were on target, many others were dispersed away from<br />
the target, as in Viewgraph 13B.<br />
! Even when most of the data were close together, they were located off the<br />
target by a significant amount, as in Viewgraph 13C.<br />
! The data were off target and widely dispersed, as in Viewgraph 13D.<br />
This in<strong>for</strong>mation helps you see how well the process per<strong>for</strong>med and how consistent it<br />
was. You may be thinking, "So what? How will this help me do my job better?" Well,<br />
with the results of the process clearly depicted, we can find the answer to a vital<br />
question:<br />
Did the process produce goods and services which are within specification limits?<br />
Looking at the Histogram, you can see, not only whether you were within<br />
specification limits, but also how close to the target you were (Viewgraph 14).<br />
16 HISTOGRAM