Basic Tools for Process Improvement
Basic Tools for Process Improvement
Basic Tools for Process Improvement

Create successful ePaper yourself
Turn your PDF publications into a flip-book with our unique Google optimized e-Paper software.
<strong>Basic</strong> <strong>Tools</strong> <strong>for</strong> <strong>Process</strong> <strong>Improvement</strong><br />
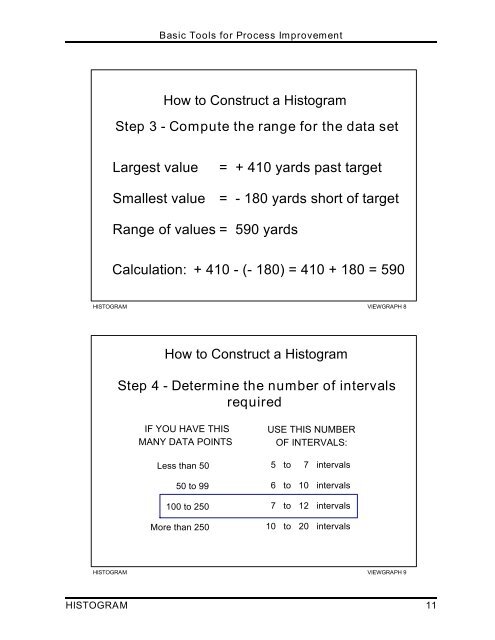
How to Construct a Histogram<br />
Step 3 - Compute the range <strong>for</strong> the data set<br />
Largest value = + 410 yards past target<br />
Smallest value = - 180 yards short of target<br />
Range of values = 590 yards<br />
Calculation: + 410 - (- 180) = 410 + 180 = 590<br />
HISTOGRAM VIEWGRAPH 8<br />
How to Construct a Histogram<br />
Step 4 - Determine the number of intervals<br />
required<br />
IF YOU HAVE THIS<br />
MANY DATA POINTS<br />
Less than 50<br />
50 to 99<br />
100 to 250<br />
More than 250<br />
USE THIS NUMBER<br />
OF INTERVALS:<br />
5 to 7 intervals<br />
6 to 10 intervals<br />
7 to 12 intervals<br />
10 to 20 intervals<br />
HISTOGRAM VIEWGRAPH 9<br />
HISTOGRAM 11