Basic Tools for Process Improvement
Basic Tools for Process Improvement
Basic Tools for Process Improvement

Create successful ePaper yourself
Turn your PDF publications into a flip-book with our unique Google optimized e-Paper software.
<strong>Basic</strong> <strong>Tools</strong> <strong>for</strong> <strong>Process</strong> <strong>Improvement</strong><br />
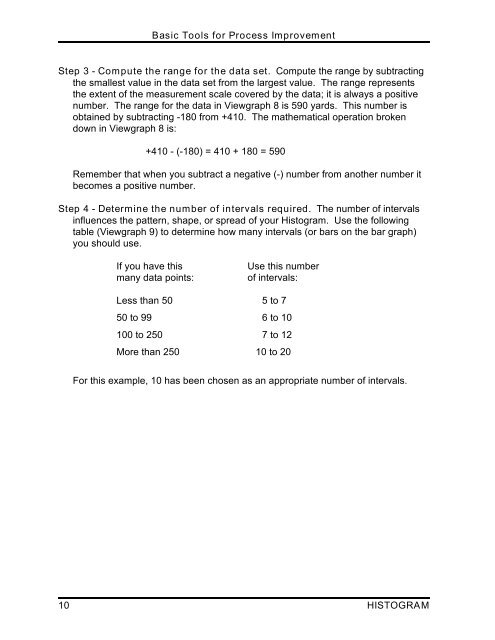
Step 3 - Compute the range <strong>for</strong> the data set. Compute the range by subtracting<br />
the smallest value in the data set from the largest value. The range represents<br />
the extent of the measurement scale covered by the data; it is always a positive<br />
number. The range <strong>for</strong> the data in Viewgraph 8 is 590 yards. This number is<br />
obtained by subtracting -180 from +410. The mathematical operation broken<br />
down in Viewgraph 8 is:<br />
+410 - (-180) = 410 + 180 = 590<br />
Remember that when you subtract a negative (-) number from another number it<br />
becomes a positive number.<br />
Step 4 - Determine the number of intervals required. The number of intervals<br />
influences the pattern, shape, or spread of your Histogram. Use the following<br />
table (Viewgraph 9) to determine how many intervals (or bars on the bar graph)<br />
you should use.<br />
If you have this Use this number<br />
many data points: of intervals:<br />
Less than 50 5 to 7<br />
50 to 99 6 to 10<br />
100 to 250 7 to 12<br />
More than 250 10 to 20<br />
For this example, 10 has been chosen as an appropriate number of intervals.<br />
10 HISTOGRAM