(LATO) IN LOWERED SEAWATER pH - Central Visayas Campus ...
(LATO) IN LOWERED SEAWATER pH - Central Visayas Campus ...
(LATO) IN LOWERED SEAWATER pH - Central Visayas Campus ...

Create successful ePaper yourself
Turn your PDF publications into a flip-book with our unique Google optimized e-Paper software.
GROWTH PERFORMANCE OF Caulerpa lentillifera (<strong>LATO</strong>)<br />
<strong>IN</strong> <strong>LOWERED</strong> <strong>SEAWATER</strong> <strong>pH</strong><br />
A Research Paper<br />
Presented to the<br />
Curriculum and Instruction Services Division<br />
Philippine Science High School-<strong>Central</strong> <strong>Visayas</strong> <strong>Campus</strong><br />
Talaytay, Argao, Cebu<br />
In Partial Fulfillment of the Requirements in Research II<br />
CHRIST<strong>IN</strong>E A. ILUSTRISIMO<br />
ISABEL C. PALMITOS<br />
RACHELDA D. SEÑAGAN<br />
March 2013
Republic of the Philippines<br />
Department of Science and Technology<br />
PHILIPP<strong>IN</strong>E SCIENCE HIGH SCHOOL – CENTRAL VISAYAS CAMPUS<br />
Talaytay, Argao, Cebu<br />
CERTIFICATE OF PANEL APPROVAL<br />
The research attached hereto, entitled “GROWTH PERFORMANCE<br />
OF Caulerpa lentillifera (<strong>LATO</strong>) <strong>IN</strong> <strong>LOWERED</strong> <strong>SEAWATER</strong> <strong>pH</strong>”,<br />
prepared and submitted by CHRIST<strong>IN</strong>E A. ILUSTRISIMO, ISABEL C.<br />
PALMITOS and RACHELDA D. SEÑAGAN is hereby recommended for<br />
approval.<br />
ALCO KENNETH C. TOLENT<strong>IN</strong>O _______________<br />
Research Adviser Date<br />
ELEAZAR B. GUIA __________________<br />
Panel Member Date<br />
REY GIOVANNI L.VILLAMORA __________________<br />
Panel Member Date<br />
This research paper is approved in fulfillment of the requirements in RESEARCH II.<br />
RECOMMEND<strong>IN</strong>G APPROVAL:<br />
SHERRY P. RAMAYLA JOSEPH P. HORTEZUELA<br />
Unit Head, Research Unit CISD Chief<br />
APPROVED BY:<br />
FLORITA A. PONTILLAS, ED.D.<br />
<strong>Campus</strong> Director<br />
ii
BIOGRAPHICAL DATA<br />
Researcher : Christine Albite Ilustrisimo<br />
Age : 16 years old<br />
Address : Lamacan, Argao, Cebu<br />
Date of Birth : December 19, 1996<br />
Mother : Teodora A. Ilustrisimo<br />
Father : Estanislao P. Ilustrisimo Jr.<br />
Siblings : Julie Ann A. Ilustrisimo<br />
Carl John A. Ilustrisimo<br />
Contact no. : 09295803297<br />
Email Address : ilustrisimo_christine@yahoo.com<br />
Researcher : Isabel Coritico Palmitos<br />
Age : 16 years old<br />
Address : Pig-ot, Loon, Bohol<br />
Date of Birth : August 7, 1996<br />
Mother : Milagros C. Palmitos<br />
Father : Roy D. Palmitos<br />
Sibling : Kaye Angel C. Palmitos<br />
Contact no. : 09217386060<br />
Email Address : isabelpalmitos@yahoo.com<br />
iii
Researcher : Rachelda Dinauanao Señagan<br />
Age : 16 years old<br />
Address : Colase, Samboan, Cebu<br />
Date of Birth : July 28, 1996<br />
Mother : Celedonia D. Señagan<br />
Father : Juanito F. Señagan<br />
Siblings : Richard Horace D. Señagan<br />
Rica Angela D. Señagan<br />
Richell Marie D. Señagan<br />
Ronald D. Señagan<br />
Contact no. : 09334085887<br />
Email Address : eldasenagan@yahoo.com<br />
iv
ACKNOWLEDGEMENT<br />
The researchers would like to thank the University of San Carlos-Talamban<br />
<strong>Campus</strong> (USC -TC), Talamban, Cebu City for allowing them to conduct the<br />
experimentation of their study there, and Philippine Science High School – <strong>Central</strong><br />
<strong>Visayas</strong> <strong>Campus</strong> (PSHS-CVisC) for the endless support they have given.<br />
The researchers would also like to thank Dr. Anthony S. Ilano and Professor<br />
Rolly V. Viesca from USC-TC for their help and guidance in the conduct of their<br />
study.<br />
The researchers would also like to express their deep appreciation and<br />
gratitude to the residents of Brgy. Kalawisan, Mactan, Cebu most especially to Brgy.<br />
Capt. Eduardo Binse, Brgy. Councilor Danilo Nuñez and Mr. Leopoldo Verame for<br />
their full help in the collection of their samples. And to Mr. Estanislao Quillosa for<br />
helping us get seawater.<br />
The researchers would also like to thank Mr. Paul Isaac Dizon and the<br />
Research II instructors including their adviser, Mr. Alco Kenneth Tolentino, and their<br />
panel members, Mr. Eleazar B. Guia and Mr. Rey Giovanni Villamora, for teaching<br />
them the concepts behind research and for sparing their time in editing and checking<br />
their research paper.<br />
The researchers would also like to express their deep appreciation to their<br />
batchmates for supporting them and serving as inspirations to finish their study.<br />
The researchers would also like to say thank you to their parents for<br />
constantly supporting them in everything they encounter and to our Almighty God.<br />
The researchers,<br />
CHRIST<strong>IN</strong>E ILUSTRISIMO ISABEL PALMITOS RACHELDA SEÑAGAN<br />
v
Ilustrisimo, C. A., I. C. Palmitos, R. D. Señagan. 2013. “Growth Performance of<br />
Caulerpa lentillifera in Lowered Seawater <strong>pH</strong>”. A Research Paper. Philippine Science<br />
High School – <strong>Central</strong> <strong>Visayas</strong> <strong>Campus</strong>, Talaytay, Argao, Cebu.<br />
ABSTRACT<br />
Ocean acidification, as a result of increased atmospheric carbon dioxide (CO2)<br />
concentrations, is predicted to lower the <strong>pH</strong> of seawater over the next 100 years<br />
(Clark et al. 2009). The aim of the study was to determine the growth performed by<br />
Caulerpa lentillifera as the test species in lowered seawater <strong>pH</strong>. To verify the growth<br />
performance of the species, an acidic environment was made with a range of lower<br />
seawater <strong>pH</strong> (<strong>pH</strong> 2.7 -3.3, 3.7-4.3, 5.7-6.3 and 7.7 to 8.3). Acidity was adjusted by<br />
adding a reagent grade of hydrochloric (HCl) acid. Species treated with <strong>pH</strong> 7.7 to 8.3<br />
were held as the controlled group. Experimental conditions (temperature, salinity,<br />
dissolved oxygen, and <strong>pH</strong>) were observed daily as accounted by Battistoni et al.<br />
(2007). Different physical changes (weight and color) were also observed. The<br />
amount of chlorophyll a content of the seaweed after the treatment was examined by<br />
reading its absorbance at 645 nm and 662 nm using UV-Vis spectrophotometer.<br />
Lowering <strong>pH</strong> resulted in a decrease in survival of the species. Species treated in <strong>pH</strong><br />
7.7 to 8.3 contains 11.92 mg/L chlorophyll a and was the highest amount of<br />
chlorophyll a content, followed by <strong>pH</strong> 5.7 to 6.3 which was 11.66 mg/L, <strong>pH</strong> 2.7 to 3.3<br />
which was 0.1551 mg/L and lastly, <strong>pH</strong> 3.7 to 4.3 containing 0.1198 mg/L. The<br />
statistical results proved that there was a significant difference on the weights of the<br />
samples in the three trials among the four groups. The study concluded that lowering<br />
seawater <strong>pH</strong> (ocean acidification) will result to a decrease in weight and chlorophyll a<br />
content of C. lentillifera, implying a negative effect on the growth of the species.<br />
vi
TABLE OF CONTENTS<br />
Title PAGE<br />
TITLE PAGE i<br />
CERTIFICATE OF PANEL APPROVAL ii<br />
BIOGRAPHICAL DATA iii<br />
ACKNOWLEDGEMENT v<br />
ABSTRACT vi<br />
TABLE OF CONTENTS vii<br />
LIST OF TABLES ix<br />
LIST OF FIGURES x<br />
CHAPTER I. <strong>IN</strong>TRODUCTION 1<br />
1.1 Background of the Study 1<br />
1.2 Objective of the Study 2<br />
1.3 Significance of the Study 3<br />
1.4 Scope and Limitations of the Study 3<br />
1.5 Definition of Terms 4<br />
CHAPTER II. REVIEW OF RELATED LITERATURE 5<br />
2.1 Ocean Acidification 5<br />
2.2 Ocean Acidification’s Effects on Growth Performance of<br />
Marine Organisms<br />
7<br />
2.3 Biological Classification of Caulerpa lentillifera 8<br />
2.4 Chlorophyll Concentrations 9<br />
2.5 Related Studies 10<br />
2.6 Physico-Chemical Conditions that Affect Seawater <strong>pH</strong> 11<br />
CHAPTER III. MATERIALS AND METHODS 13<br />
3.1 Research Design 13<br />
3.2 Collection of Species 13<br />
3.3 Experimental Set-up 13<br />
3.4 Growth Performance 14<br />
3.4.1 Measurement of the Species’ Growth Rate 14<br />
3.4.2 Color Changes of the Samples 15<br />
3.4.3 Measurement of Chlorophyll a Concentration 15<br />
3.4.3.1 Preparation of Sample 15<br />
3.4.3.2 Spectrophotometric Determination 16<br />
3.5 Statistical Analysis 16<br />
CHAPTER IV. RESULTS AND DISCUSSION 17<br />
4.1 Average Weight of Caulerpa lentillifera at Different <strong>pH</strong> 17<br />
4.2 Growth Performance 19<br />
4.3 Color Changes of the Samples 20<br />
vii
4.4 Chlorophyll a Concentration 21<br />
CHAPTER V. CONCLUSION AND RECOMMENDATIONS 23<br />
5.1 Conclusion 23<br />
5.2 Recommendations 23<br />
BIBLIOGRAPHY 25<br />
APPENDICES 29<br />
Appendix A. Raw Data of the Initial and Final Weight of the Species 29<br />
at Different <strong>pH</strong><br />
Appendix B. Raw Data of the Absorbance of Caulerpa lentillifera (Lato) 31<br />
at 645 and 662 Nanometers (nm)<br />
Appendix C. T-Test Statistics Results 32<br />
Appendix D. Photos 33<br />
viii
LIST OF TABLES<br />
TABLE PAGE<br />
1 t-Test Results 18<br />
2 Growth Rate of C. lentillifera at different <strong>pH</strong> 19<br />
3 Chlorophyll a Concentration of C. lentillifera 21<br />
A.1 The weight of Caulerpa lentillifera (Lato) in grams 29<br />
at <strong>pH</strong> 7.7 to 8.3<br />
A.2 The weight of Caulerpa lentillifera (Lato) in grams 29<br />
at <strong>pH</strong> 5.7 to 6.3<br />
A.3 The weight of Caulerpa lentillifera (Lato) in grams 29<br />
at <strong>pH</strong> 3.7 to 4.3<br />
A.4 The weight of Caulerpa lentillifera (Lato) in grams 30<br />
at <strong>pH</strong> 2.7 to 3.3<br />
B.1 The absorbance of Caulerpa lentillifera (Lato) at 31<br />
645 nanometers (nm)<br />
B.2 The absorbance of Caulerpa lentillifera (Lato) at 31<br />
662 nanometers (nm)<br />
C.1 Statistical Analysis of Samples 32<br />
C.2 Mass (in grams) of Caulerpa lentillifera at different <strong>pH</strong> 32<br />
ix
LIST OF FIGURES<br />
FIGURE PAGE<br />
1 Planting of C. lentillifera in the tank 14<br />
2 Mass (in grams) of C. lentillifera at different <strong>pH</strong> 17<br />
D.1 Fresh samples of Caulerpa lentillifera 33<br />
D.2 Samples after the treatment 33<br />
D.3 Experimental Setup 33<br />
x
1.1 Background of the Study<br />
CHAPTER I<br />
<strong>IN</strong>TRODUCTION<br />
Oceans act as important carbon sinks for anthropogenic emissions, reducing<br />
atmospheric concentrations of carbon dioxide by up to one-third (Doney et al., 2009).<br />
As oceans become saturated with CO2, the <strong>pH</strong> of seawater is predicted to drop from<br />
8.1 to 7.7-7.8 by the end of this century (Le Quere et al., 2007). This increased acidity<br />
may have dramatic effects on marine organisms, in part because it reduces the<br />
concentration of carbonate ions and the solubility of aragonite, a form of calcium<br />
carbonate used to create biological structures (Orr et al., 2005).<br />
A dire prediction that has raised a serious concern in the climate-alarmist-<br />
inspired campaign to force reductions in anthropogenic CO₂ emissions is the<br />
contention that continued increases in the air's CO₂ content will lead to ever more<br />
carbon dioxide dissolving in the surface waters of the world's oceans and lowering its<br />
<strong>pH</strong> values. This phenomenon is claimed to make biological calcification more<br />
difficult to occur in marine organisms. A <strong>pH</strong> reduction of the seawater is viewed by<br />
many as a cause for great concern, as it has been postulated to harm marine organisms<br />
most especially on calcifying marine life such as corals, not only by reducing their<br />
calcification rates, but by negatively impacting their metabolism, fertility, growth and<br />
survival. (http://www.co2science.org, 2011)<br />
As carbon dioxide mixes with water, the two molecules combine to become<br />
carbonic acid which makes the seawater slightly more acidic. As billions of<br />
molecules combine and go through this process, the overall <strong>pH</strong> of the oceans begins<br />
to change. This phenomenon is known to be ocean acidification, the lowering of sea-
water <strong>pH</strong> that can greatly alter the metabolism, fertility, growth and survival of<br />
different marine organisms. Thus, the effect of lowering of the seawater <strong>pH</strong> on the<br />
growth of Caulerpa lentillifera will be determined (http://www.co2science.org).<br />
In this study, a species of green algae in the family Caulerpaceae, Caulerpa<br />
lentillifera, was examined. This alga is stenohaline and cannot thrive in areas where<br />
salinity is less than 25%. Salinities lower than 30% would already result in crop loss<br />
(http://www.globinmed.com). Caulerpa lentillifera has become a source of food to<br />
mankind. It has nutritional contents which can serve as dietary alternatives. Moreover,<br />
this species is found out to be a potential source of food proteins ( Chirapart and<br />
Ratana-arporn, 2006).<br />
This study focused mainly on how lowered seawater <strong>pH</strong> affects the growth<br />
performance of Caulerpa lentillifera. Lowered seawater <strong>pH</strong> has been a vital factor on<br />
the destruction of marine life, most especially on the marine organisms.<br />
1.2 Objectives of the Study<br />
This study aimed to determine the growth performance of Caulerpa lentillifera<br />
in lowered seawater <strong>pH</strong>. Specifically, this study aimed to:<br />
determine the fresh weight of Caulerpa lentillifera (lato) in varying seawater<br />
<strong>pH</strong> before and after the treatment;<br />
compare the initial and final weight of C. lentillifera (lato) at the designated<br />
seawater <strong>pH</strong>;<br />
determine the color changes in C. lentillifera (lato) in the normal and lowered<br />
seawater <strong>pH</strong> treatments; and<br />
determine the amount of chlorophyll a present in the species treated with<br />
lowered seawater <strong>pH</strong>.<br />
2
1.3 Significance of the Study<br />
This study is essential to environmentalists and people who get their income<br />
from seaweeds such as Caulerpa lentillifera. By knowing the mechanism of such<br />
species in reacting to climate change, those people will be able to create and innovate<br />
ways on how to conserve and lessen the impact of climate change to the species.<br />
In addition, this study will greatly make a contribution to the scientific<br />
community. The results of this study will provide information and further knowledge<br />
to scientists on how C. lentillifera will react to a change in the environment,<br />
specifically, ocean acidification. Moreover, this study can be used as a reference for<br />
possible researches using the test species in its response to climate change.<br />
1.4 Scope and Limitations of the Study<br />
This study included only the growth performance of Caulerpa lentillifera in<br />
lowered seawater <strong>pH</strong>. A UV-Vis spectrophotometer was used to measure the level of<br />
chlorophyll a in the algae. The samples used were obtained from Carbon Market,<br />
Colon St., Cebu City. This experiment was only limited on the specified <strong>pH</strong> ranges<br />
and due to the lack of time, the period of experiment was only seven (7) days for each<br />
of the three trials. The <strong>pH</strong> ranges used were all below the normal seawater <strong>pH</strong> (about<br />
<strong>pH</strong> 8.0) because the focus of this study was only about ocean acidification. Only the<br />
optimal range of seawater <strong>pH</strong> and the three <strong>pH</strong> treatments were considered in this<br />
study. Experimental conditions were monitored, but the study was only focused on the<br />
seawater <strong>pH</strong>. The samples were exposed to sunlight during the experimentation. Each<br />
of the tank only contained 20 L of seawater.<br />
3
1.5 Definition of Terms<br />
Carbon dioxide (CO 2) is one of the most abundant gases in the air. It is the most<br />
important gas for plants to make food. For humans, carbon dioxide is a waste<br />
product of respiration.<br />
Caulerpa lentillifera is a stoloniferous plant that can grow up to 10 cm tall. It has<br />
branched stolons, cylindrical in cross-section and measuring 1-1.5(-2) mm in<br />
diameter. (Jenkins 2009)<br />
Lowered seawater <strong>pH</strong> is also known as ocean acidification. This happens when the<br />
normal seawater <strong>pH</strong>, which is about <strong>pH</strong> 8.0, decreases. This poses a dramatic<br />
effect on marine organisms and the life beyond. (Fabry et al., 2008)<br />
<strong>pH</strong> (potential of Hydrogen) is a measure of the acidity or alkalinity of a solution,<br />
numerically equal to 7 for neutral solutions, increasing with increasing<br />
alkalinity and decreasing with increasing acidity. The <strong>pH</strong> scale commonly in<br />
use ranges from 0 to 14. (http://dl.clackamas.edu/ch105-05/definiti.htm, 2000)<br />
Salinity is the saltiness or dissolved salt content of a body of water. It is a<br />
dimensionless quantity with no units ( http://www.thefreedictionary.com,<br />
2006).<br />
4
2.1 Ocean Acidification<br />
CHAPTER II<br />
REVIEW OF RELATED LITERATURE<br />
Over the last two centuries, atmospheric carbon dioxide has increased by more<br />
than 30%, from 280 to 380 ppm (parts per million) by 2007 (Doney et al., 2007). This<br />
causes more than 80% of the added heat to reside in the ocean, causing global<br />
warming. This increased CO2 concentration then leads to ocean acidification. Ocean<br />
acidification, the phenomenon of decreasing ocean <strong>pH</strong> due to the uptake of<br />
anthropogenic carbon dioxide (CO2), has been identified as an important consequence<br />
of rising CO2 emissions worldwide (Fabry et al., 2008).The magnitude and patterns of<br />
these changes are consistent with an attribution to human activities and not explained<br />
by natural variability alone (Doney et al., 2007).<br />
Over half of human carbon dioxide emissions to the atmosphere are absorbed<br />
by the ocean and land biospheres, and the excess carbon absorbed by the ocean results<br />
in increased ocean acidity (Gruber & Sarmiento, 2002). Once carbon dioxide enters<br />
the ocean, it combines with water to form carbonic acid and a series of acid-base<br />
products, resulting in a lowering of <strong>pH</strong> values. A small decrease in <strong>pH</strong> affects the<br />
chemical equilibrium of ocean water, reducing the availability of carbonate ions<br />
needed by a wide range of organisms to build and maintain structures of calcium<br />
carbonate (Science Daily, 2008).<br />
For at least 650, 000 years prior to the Industrial Revolution, atmospheric CO2<br />
concentrations varied between 180 and 300 ppm (Siegenthaler et al., 2005). As a<br />
result of human activity, today’s atmospheric CO2 concentration reaches 380 ppm and<br />
currently is rising at a rate of 0.5% to the year 2100 (Forster et al., 2007), which
is 100 times faster than any change during the past 650 000 years (Royal Society,<br />
2005; Siegenthaler et al., 2005). Elevated partial pressure of CO2 in seawater (also<br />
known as hypercapnia) can impact marine organisms both via decreased calcium<br />
carbonate (CaCO3) saturation, which affects calcification rates, and via disturbance to<br />
acid–base (metabolic) physiology. The oceanic uptake of anthropogenic CO 2 and the<br />
concomitant changes in seawater chemistry have adverse consequences for many<br />
calcifying organisms, and may result in changes to biodiversity, trophic interactions,<br />
and other ecosystem processes (Royal Society, 2005; Fabry et al., 2006).<br />
Climate change is a problem that is affecting people and the environment.<br />
Climate-focused agencies have been designing and implementing programs to help<br />
conserve the environment. Greater energy efficiency and new technologies hold<br />
promise for reducing greenhouse gases and solving this global challenge<br />
(http://www.epa.gov/climatechange, 2007).<br />
All across the world, people are taking action because climate change has<br />
serious impacts, locally and globally. For example, in 2007, scientists from the<br />
International Panel on Climate Change (IPCC) predicted that warming oceans and<br />
melting glaciers due to global warming and climate change could cause sea levels to<br />
rise 7-23 inches by the year 2100. Worldwide, densely populated coastal communities<br />
and infrastructure that supports them would be affected (such as city buildings and<br />
homes, roads, ports and wastewater treatment plants). Some would be flooded or<br />
more vulnerable to storm damage. In flat terrain, the shoreline could move many<br />
miles inland (http://www.ecy.wa.gov/climatechange/whatis.htm, 2007).<br />
6
2.2 Ocean Acidification’s Effects on Growth Performance of Aquatic Organisms<br />
The growth rate of a microalgal population is a measure of the increase in<br />
biomass over time and it is determined from the exponential phase. Growth rate, such<br />
as the change in biomass, is one important way of expressing the relative ecological<br />
success of a species or strain in adapting to its natural environment or the<br />
experimental environment imposed upon it. The duration of exponential phase in<br />
cultures depends upon the size of the innoculum, the growth rate and the capacity of<br />
the medium and culturing conditions to support algal growth. Cell count and dry<br />
weight are common units of biomass determination<br />
(http://www.marine.csiro.au/microalgae/methods/Growth%20rate.htm, 2007).<br />
The study conducted by Battistoni et al. in 2007 focused on the effects of<br />
ocean acidification on a turtle grass meadow. The results showed that ocean<br />
acidification negatively affected the health of turtle grass because of the decrease in<br />
growth and an increase in leaf senescence of plants in acidified treatments. They had<br />
also concluded that the acidic environment appeared to be detrimental to epiphytic<br />
calcifying algae. Another study conducted by Vijayan and Diwan (1995) focused<br />
on the influence of temperature, salinity, <strong>pH</strong>, and light on the molting and growth of<br />
the Indian white prawn Penaeus indicus under laboratory conditions. The study<br />
resulted in a depressed growth of the species. They also concluded that lowered<br />
seawater <strong>pH</strong> is eventually harmful to crustaceans.<br />
7
2.3 Caulerpa lentillifera<br />
Kingdom: Plantae<br />
Division: Chlorophyta<br />
Class: Bryopsidophyceae<br />
Order: Bryopsidales<br />
Family: Caulerpaceae<br />
Genus: Caulerpa<br />
Species: lentillifera<br />
The genus Caulerpa are fast-growing green algae with fronds (“leaves”) that<br />
come in a variety of shapes. The fronds between 15-30 cm (6-12 inches) in length are<br />
attached to long runners (“stems”) called rhizomes. Besides simply spreading<br />
outwards, Caulerpa can also propagate themselves vegetatively through sections of<br />
rhizome that break off the parent plant and become established elsewhere ( Jenkins,<br />
2009).<br />
Caulerpa lentillifera is one of the favored species of edible Caulerpa due to its<br />
soft and succulent texture. It is also known as sea grapes, green caviar, "ar-arosep", or<br />
"lato" in the Philippines. The pond cultivation of C. lentillifera has been very<br />
successful on Mactan Island, Cebu, Philippines, with markets in Cebu and Manila.<br />
About 400 hectares (ha) of ponds are under cultivation, producing 12-15 tonnes of<br />
fresh seaweed per hectare per year (McGugh, 2003).<br />
C. lentillifera is usually eaten raw with vinegar, as a snack or in a salad<br />
(Jenkins, 2009). It was also found to be a potential source of plant food proteins<br />
owing to its high protein levels and balanced amino acid profiles and mineral<br />
supplements (Chirapart and Ratana-arporn, 2006). The study conducted by Chirapart<br />
8
and Ratana-arporn in 2006 concluded that this seaweed can provide dietary<br />
alternatives due to its nutritional values. It was also found to have reasonable<br />
adsorption capacity for basic dyes, Astrazon ® Blue FGRL (AB), Astrazon ® Red<br />
GTLN (AR), and Astrazon ® Golden Yellow GL-E (AY) (Pimol et al., 2007). The<br />
biosorption of Cu(II), Cd(II), and Pb(II) by Caulerpa lentillifera was also investigated<br />
by Apiratikul and Pavasant in 2007. Their study had showed that ion exchange was<br />
one of the main sorption mechanisms of the species.<br />
2.4 Chlorophyll Concentration<br />
Chlorophyll is a green pigment found in cyanobacteria and the chloroplasts of<br />
algae and plants. In chlorophyll the central ion is magnesium, and the large organic<br />
molecule is a porphyrin. The porphyrin contains four nitrogen atoms that form bonds<br />
to magnesium in a square planar arrangement. Chlorophyll is one of the most<br />
important chelates in nature. It is capable of channelling the energy of sunlight into<br />
chemical energy through the process of photosynthesis. In photosynthesis, the energy<br />
absorbed by chlorophyll transforms carbon dioxide and water into carbohydrates and<br />
oxygen. Since animals and humans obtain their food supply by eating plants,<br />
photosynthesis can be said to be the source of our life.<br />
It has been shown that chlorophyll degradation products may at times<br />
constitute a significant fraction of the total green pigments present in seawater<br />
(Menzel and Yentsch, 1963). On a study conducted by Fay and Wyman ( 1986), the<br />
influence of light quantity on the underwater light climate and the growth and<br />
pigmentation of planktonic blue-green algae (cyanobacteria) was investigated. In<br />
light-limited cultures, the relative concentrations of chlorophyll and phycobiliproteins<br />
per cell decline at a similar rate with increasing irradiance. These pigment synthesis<br />
9
appear to be imposed by genotypic constraints on the maximum cell density and on<br />
the size of photosynthetic units rather than by either light or nutrient limitation of<br />
chlorophyll and phycobiliprotein synthesis.<br />
Another study by Beer et al. in 1993 focused on the photosynthetic<br />
performance and carboxylation capacity in a range of aquatic macrophytes of<br />
different growth forms. The low chlorophyll content and high chlorophyll specific<br />
photosynthesis of species with high carbon transport capability (i.e. particularly the<br />
marine algae) determine a large section on the water quality and thus, to the life in<br />
marine environment. This suggests that running costs associated with inorganic<br />
carbon assimilation are reduced when a CO2 concentrating system operates.<br />
According to the Australian Online Coastal Information, chlorophyll a<br />
concentrations are an indicator of phytoplankton abundance and biomass in coastal<br />
and estuarine waters. They can be an effective measure of trophic status, are potential<br />
indicators of maximum photosynthetic rate (P -max) and are a commonly used<br />
measure of water quality. High levels often indicate poor water quality and low levels<br />
often suggest good conditions. However, elevated chlorophyll a concentrations are<br />
not necessarily a bad thing in relation to water quality. It is the long-term persistence<br />
of elevated levels that is a problem. For this reason, annual median chlorophyll a<br />
concentrations in a waterway are an important indicator on the status of the<br />
environment.<br />
2.5 Related Studies<br />
Clark et al. (2009) had conducted a research about the response of sea urchin<br />
pluteus larvae (Echinodermata: Echinoidea ) to reduced seawater <strong>pH</strong>. The results<br />
showed that lowered seawater <strong>pH</strong> had affected the survival of the species used.<br />
10
Lowering <strong>pH</strong> resulted in a decrease in survival in all species, but only below <strong>pH</strong> 7.0.<br />
The size of larvae was reduced at lowered <strong>pH</strong>, but the external morphology (shape)<br />
was unaffected. Calcification of the larval skeleton was significantly reduced (13.8 –<br />
36.9% lower) under lowered <strong>pH</strong>, with the exception of the Antarctic species, which<br />
showed no significant difference.<br />
In a similar study done by Kurihara and Ishimatsu (2008), exposure to<br />
seawater equilibrated with high CO2 air did not significantly affect the survival rate of<br />
the copepod Acartia tsuensis, as well as with marine algae. Consequently, Clark et al.<br />
(2009) concluded that lowered <strong>pH</strong> levels will not have a direct effect on the survival<br />
of marine species. They may, however, exhibit decreased growth and calcification<br />
indices that could indirectly compromise their survival in the ocean.<br />
Elevated temperature (28-34°C) has been hypothesized as the primary cause of<br />
the loss of algal endo-symbionts in coral reef-associated invertebrates, a phenomenon<br />
observed on a world-wide scale over the last decade. In a related study conducted by<br />
Iglesias-Prieto et al. in 1992, elevated temperatures adversely affects photosynthesis<br />
of Symbiodinium microadriaticum in culture. Growth of the cells at different oxygen<br />
tensions did not also appear to have any direct influence on the temperature-related<br />
decrease in photosynthesis.<br />
2.6 Physico-Chemical Conditions that Affect Seawater <strong>pH</strong><br />
The <strong>pH</strong> of seawater responds to changes in: (1) the concentration of total<br />
dissolved CO2; (2) alkalinity; (3) temperature; and for deep waters, (4) pressure. In<br />
each case, the magnitude of change varies with salinity because the concentration of<br />
salt influences the various equilibrium constants and because several components of<br />
sea salt are involved in the acid-base reactions of seawater. The equilibrium <strong>pH</strong> of<br />
11
surface seawater, for a given temperature and salinity, is the <strong>pH</strong> of seawater in<br />
equilibrium with CO2 in the atmosphere (Skirrow and Riley, 1975).<br />
The seawater has a good buffer system. This means that it would keep in track<br />
the balance within its environment. The seawater’s buffer system equilibrates back<br />
and forth the changes and stresses it encounters and thus, <strong>pH</strong> stays relatively constant<br />
(http://www.livingreefs.com). However, when too much stress is encountered, the<br />
seawater’s buffer system lessens its capabilities to maintain the balance within its<br />
environment.<br />
Dissolved carbon dioxide occurs as carbonic acid and its presence in water<br />
lowers the <strong>pH</strong>. During the day when plants are illuminated and photosynthesis is<br />
occurring, the dissolved CO2 is taken up from the water and the <strong>pH</strong> rises. At night<br />
when no photosynthesis is taking place and the CO2 builds up thereby contributing to<br />
a falling <strong>pH</strong>. On the other hand, high alkalinity promotes calcification, encouraging<br />
the rapid growth of calcifying algae. High alkalinity combined with calcium dosing<br />
promotes the precipitation of phosphate and this limits algae growth<br />
(http://www.livingreefs.com). Temperature inversely controls the solubility of oxygen<br />
in water; as temperature increases, oxygen is less soluble. In contrast, there is a direct<br />
relationship between atmospheric pressure and DO; as the pressure increases due to<br />
weather or elevation changes, oxygen solubility increases<br />
(www.uwgb.edu/watershed). Low concentrations of dissolved oxygen leads to an<br />
acidic environment, or lowered seawater <strong>pH</strong> (RiverTrends Manual, 2010).<br />
12
3.1 Research Design<br />
CHAPTER III<br />
METHODOLOGY<br />
This is an experimental study which aimed to collect data on the growth<br />
performance of Caulerpa lentillifera in lowered seawater <strong>pH</strong>. The experiment was<br />
conducted in three trials with nine replicates per trial. Measurement of the chlorophyll<br />
a content with the use of the UV-VIS Spectrophotometer was done at the Department<br />
of Biology-University of San Carlos-Talamban <strong>Campus</strong>, Cebu Laboratory and the rest<br />
including <strong>pH</strong> treatment of the C. lentillifera were done in Philippine Science High<br />
School-<strong>Central</strong> <strong>Visayas</strong> <strong>Campus</strong>, Talaytay, Argao, Cebu Laboratory.<br />
3.2 Collection of Species<br />
One kilogram of fresh species of Caulerpa lentillifera was bought from<br />
Carbon Market, Colon St., Cebu City. The dark green samples were chosen as the<br />
planting materials.<br />
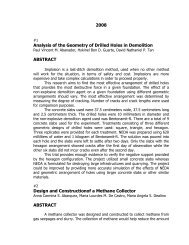
3.3 Experimental Set-up<br />
An acidic environment was created by filling three (3) clear, square tank<br />
which measures 18x12x12 inches of 45 L capacity filled with 20 L of seawater and<br />
specific <strong>pH</strong> adjusted initially with 1.0 M Hydrochloric acid (HCl). The seawater <strong>pH</strong><br />
was lowered in order to create an environment similar to what ocean acidification is.<br />
Each tank was provided with an aerator. The samples were selected and were held on<br />
a plastic screen placed in the tank using glove-covered hands at the start of the<br />
experimentation period (see Figure 1). After placing the species on the tanks, it was<br />
left untreated for three days to stabilize the samples. After three days of stabilization,
a reagent grade Hydrochloric acid of different volumes was added daily to each tank<br />
to obtain the following <strong>pH</strong> ranges: 2.7 to 3.3, 3.7 to 4.3 and 5.7 to 6.3. A GLX<br />
Explorer <strong>pH</strong> meter was used to monitor the specified <strong>pH</strong> ranges.<br />
Figure 1. Planting of C. lentillifera in the tank<br />
The <strong>pH</strong> ranges were checked again two (2) hours after adjustment to ensure<br />
that the <strong>pH</strong> was still within the desired ranges (Clark et al., 2009). A tank filled with<br />
20 L of seawater (<strong>pH</strong> 7.7 – 8.3) was also created which served as control. All of the<br />
tanks were placed strategically to expose it to sunlight.<br />
3.4 Growth Performance<br />
3.4.1 Measurement of the Species’ Growth Rate<br />
The growth performed by the species was determined by measuring its<br />
biomass using a digital weighing scale. The individual species’ weight was recorded<br />
before and after the treatment. The data on the average weight of the samples were<br />
plotted in a graph with the time on the x-axis and biomass on the y-axis. To determine<br />
the growth performance of the species, two points, N1 and N2, which are the<br />
extremes of the linear phase are taken and substituted into the equation below<br />
(Levasseur et al., 1993).<br />
14
where K = growth rate, N1 = initial weight and N2 = final weight at time1 (first day)<br />
and time2 (seventh day), respectively.<br />
3.4.2 Color Changes of the Samples<br />
The color of the samples was observed before and after treating them in<br />
lowered seawater <strong>pH</strong>. This was also true for the samples under the normal seawater<br />
<strong>pH</strong>. The color changes were classified to be green, pale green, or pale white.<br />
Photographs were used to compare the changes in the color of the samples.<br />
3.4.3 Measurement of Chlorophyll a Concentration<br />
The amount of chlorophyll a content of the seaweed was also determined<br />
using a UV-Vis spectrophotometer. This was used as a guide in the growth<br />
performance of the species. The methods used were based on the study conducted by<br />
Humphrey and Jeffrey (1975), Porra et al. (1989), and Dere et al. (1997).<br />
3.4.3.1 Preparation of Sample<br />
All the samples in each tank were weighed using a digital weighing scale.<br />
After weighing, ten (10) mL of 100% acetone was added to each sample. It was then<br />
homogenized using a homogenizer at 1000 rpm for one minute. The homogenate was<br />
filtered using filter paper, and was centrifuged at 2500 rpm for three minutes. The<br />
supernatant was then separated from the precipitate. The precipitate was discarded.<br />
This sample preparation was done at Philippine Science High School-<strong>Central</strong> <strong>Visayas</strong><br />
<strong>Campus</strong> Science Laboratory.<br />
15
3.4.3.2 Spectrophotometric Determination<br />
The supernatant for each treatment was analyzed for the determination of the<br />
chlorophyll a content using a UV-Vis spectrophotometer. The chlorophyll a<br />
concentration was determined by measuring the absorbance (optical density - OD) of<br />
the extract at wavelengths 645 nanometer and 662 nanometer. The resulting<br />
absorbance measurements were then applied to a standard equation (ESS Method<br />
150.1: Chlorophyll-Spectrophotometric).<br />
The formula below was used to calculate the amount of chlorophyll a:<br />
C = (11.75) (A662) – (2.350) (A645)<br />
where C = Chlorophyll a concentration,<br />
3.5 Statistical Analysis<br />
A662 = absorbance at 662 nanometer<br />
A645 = absorbance at 645 nanometer.<br />
Treatment effects on the weight of the species were statistically tested for<br />
significance at the 5% level using t-test (Kurihara and Ishimatsu 2008). The initial and<br />
final weights of the species for the three trials were used and compared statistically.<br />
The program used was Past software in computing the t-test.<br />
16
CHAPTER IV<br />
RESULTS AND DISCUSSION<br />
4.1 Average Weight of Caulerpa lentillifera at Different <strong>pH</strong><br />
Samples of Caulerpa lentillifera for four different <strong>pH</strong> levels were weighed<br />
before and after treating them at varying <strong>pH</strong>. These were then calculated and the<br />
average weight for the species in each tank were determined.<br />
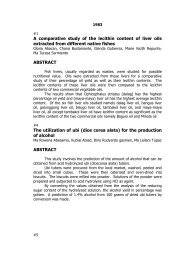
Figure 2. Mass (in grams) of C. lentillifera at different <strong>pH</strong><br />
Figure 1 shows the result of the average weight of the species. The graph of<br />
<strong>pH</strong> ranging from 7.7 to 8.3 has showed an increase in the mass while the graph of <strong>pH</strong><br />
ranging from 5.7 to 6.3, <strong>pH</strong> 3.7 to 4.3 and <strong>pH</strong> 2.7 to 3.3 showed a decrease in the<br />
mass. As the <strong>pH</strong> decreases compared to normal seawater <strong>pH</strong>, the final mass of C.<br />
lentillifera also decreases. This coincides to the fact that C. lentillifera can thrive on<br />
the normal seawater <strong>pH</strong> which is at around <strong>pH</strong> 8 (Battistoni et al., 2007).<br />
Using t-test, the computed t-values of the trials with <strong>pH</strong> 8.0±0.3, <strong>pH</strong> 6.0±0.3, <strong>pH</strong><br />
4.0±0.3 and <strong>pH</strong> 3.0±0.3 have values that are lesser than the significance level of 0.05.
At 5% level of significance, the data showed a significant difference on the weights of<br />
the samples in the three trials among the four groups. Table 1 shows the t-test<br />
statistical analysis results.<br />
Table 1. t-Test Results<br />
Variables<br />
F<br />
Values<br />
166.44<br />
p(eq)<br />
2.76E-10<br />
t 3.7264 0.001173<br />
Welch t 3.7264 0.003278<br />
Permutation t test: 0.001<br />
A related study conducted by Battistoni et al. in 2007 focused on the effects of<br />
ocean acidification on a turtle grass meadow. The results showed that ocean<br />
acidification negatively affected the health of turtle grass because of the decrease in<br />
growth and an increase in leaf senescence of plants in acidified treatments. They had<br />
also concluded that the acidic environment appeared to be detrimental to epiphytic<br />
calcifying algae, as algal cover on turtle grass leaves was reduced in the acidified<br />
tanks.<br />
Another study by Hauton et al. (2008) showed that changes in the <strong>pH</strong> of<br />
seawater will potentially cause a disruption to the internal acid/base balance in wider<br />
range of marine species. To some extent, this can result to hypercapnia which had<br />
been shown to cause metabolic suppression in protostome invertebrates, although it is<br />
clear that differences do occur and some species have a better tolerance than others<br />
(Michaelidis et al., 2004).<br />
18
These studies correlate with the results shown in the study. Lowering the<br />
seawater <strong>pH</strong> had brought a negative effect on the species’ weight. A negative effect<br />
was shown when the samples treated in lowered seawater <strong>pH</strong> decreased compared to<br />
its fresh weight.<br />
4.2 Growth Performance<br />
From the data in Table C.2 (see Appendix C), the growth performance of the<br />
species was calculated following Levasseur et al. (1993).<br />
Table 2. Growth Rate of C. lentillifera at different <strong>pH</strong><br />
<strong>pH</strong> Level Growth Rate (%)<br />
7.7 to 8.3 0.0069<br />
5.7 to 6.3 -0.039<br />
3.7 to 4.3 -0.061<br />
2.7 to 3.3 -0.089<br />
Table 2 shows the growth rate of the species treated at <strong>pH</strong> 8.0±0.3, 6.0±0.3,<br />
4.0±0.3 and 3.0±0.3. The species under the normal seawater <strong>pH</strong> had the highest<br />
growth rate, implying a positive impact on the species. It was followed by the species<br />
treated at <strong>pH</strong> 6.0±0.3, then <strong>pH</strong> 4.0±0.3 and <strong>pH</strong> 3.0±0.3. All of the species treated<br />
under lowered <strong>pH</strong> had negative coefficient. The negative coefficient implies a<br />
decreased growth on the species treated under their designated <strong>pH</strong> levels.<br />
Hinga (2002) reported that an ion balance effect may have occurred within the<br />
organism. At high or low <strong>pH</strong>, cells may have to spend energy maintaining an internal<br />
19
<strong>pH</strong> necessary for cell function. In addition, Hinga (2002) also concluded that the low<br />
concentrations of free CO2 may as well be the mechanism for reduced growth rate at<br />
low <strong>pH</strong>. The <strong>pH</strong> also affects the rates of primary production of marine algae.<br />
Accordingly, their growth rates change significantly with <strong>pH</strong> changes near the<br />
equilibrium <strong>pH</strong>.<br />
The results of the study showed that the growth rate of the species was<br />
reduced in lowered <strong>pH</strong>, which also coincided with the results on the study by Hinga<br />
(2002). At <strong>pH</strong> 8.0±0.3, the species are under their normal environment, enabling<br />
them to perform its activities well.<br />
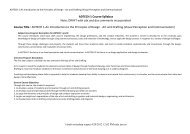
4.3 Color Changes of the Samples<br />
The samples treated at the acidic <strong>pH</strong> of 3.0±0.3 and 4.0±0.3 showed a change<br />
in color, most specifically from green to pale white. Also, 100% of the sample at these<br />
<strong>pH</strong> ranges did not survive the experimental period of 7 days. On the other hand, only<br />
about 20% of the species treated at <strong>pH</strong> 6.0±0.3 showed a change in color (see<br />
Appendix D). The species treated at <strong>pH</strong> 8.0±0.3 had shown an even darker green<br />
color, implying an increase in growth (Atkinson and Marubini, 1999).<br />
Chlorophyll is one of the most important part of a plant or algae. Chlorophyll<br />
presence is indicated by a green-colored characteristic in plants mainly because<br />
chlorophyll is green. The greener the algae, the more amount of chlorophyll it<br />
contains (Iglesias-Prieto et al., 1992).<br />
The results in the study by Iglesias-Prieto et al. in 1992 coincides with the<br />
observations in the experiment conducted. The samples at <strong>pH</strong> 8.0±0.3 showed a<br />
darker green color (see Appendix D), implying a higher chlorophyll a content<br />
compared to the samples treated in lowered seawater <strong>pH</strong>. The samples under <strong>pH</strong><br />
20
6.0±0.3 changed from green to pale green. However, the samples under <strong>pH</strong> 3.0±0.3<br />
and 4.0±0.3 changed their color to pale white. Since a greener color of the samples<br />
implies more chlorophyll a content, the samples treated under lowered seawater <strong>pH</strong><br />
were not in their viable environment.<br />
4.4 Chlorophyll a Concentration<br />
The amount of chlorophyll a content of the sample was determined using a<br />
UV-Vis spectrophotometer. This was also used to determine the growth performance<br />
of the species.<br />
Table 3. Chlorophyll a Concentration (in milligrams per liter) of C. lentillifera<br />
<strong>pH</strong> Levels Chlorophyll a Concentration<br />
7.7 to 8.3 10.97<br />
5.7 to 6.3 2.723<br />
3.7 to 4.3 1.721<br />
2.7 to 3.3 1.023<br />
Table 3 shows the chlorophyll a concentration of C. lentillifera at different <strong>pH</strong><br />
levels. The samples in the controlled setup contained the highest amount of<br />
chlorophyll a, which was found out to be 10.97 mg/L. However, the samples treated<br />
in lowered seawater <strong>pH</strong> showed a decreasing pattern on the chlorophyll a<br />
concentration. It was found to be 2.723 mg/L, 1.721 mg/L and 1.023 mg/L at <strong>pH</strong><br />
6.0±0.3, 4.0±0.3, and 3.0±0.3, respectively.<br />
21
A study conducted by Iglesias-Prieto et al. (1992) observed that<br />
photosynthetic rates of algae increased between 20°C and 30°C and consequently, at<br />
<strong>pH</strong> on or near the equilibrium <strong>pH</strong> in seawater, which is about <strong>pH</strong> 8. This observation<br />
coincides with the results shown on Table 3 above.<br />
Photosynthesis is a sensitive indicator of thermal stress in plants and has a<br />
central role in the nutrition of symbiotic invertebrates. Through photosynthesis, plants<br />
such as algae are capable to channel the energy of sunlight into chemical energy. As<br />
algae engage in photosynthesis, more chlorophyll is present, and the energy absorbed<br />
by chlorophyll transforms carbon dioxide and water into carbohydrates and oxygen.<br />
In most plants, photosynthesis takes place mainly in the leaves. Like other<br />
living things, plants are made up of tiny cells. The cells in a plant’s leaves contain<br />
even smaller, disc-shaped parts called chloroplasts. Chloroplasts contain chemical<br />
called chlorophyll, which is bright green. Chlorophyll gives plants their green color<br />
and makes photosynthesis work with the aid of sunlight, air, and water. This, in turn,<br />
produces beneficial products such as carbohydrates and oxygen.<br />
Algae under normal seawater <strong>pH</strong> engage in photosynthesis more actively.<br />
Hence, they can produce enough or even more of the products of photosynthesis.<br />
However, those species treated under low <strong>pH</strong> may encounter physiological stress as<br />
indicated in the study of Iglesias-Prieto et al. in 1992.<br />
22
5.1 Conclusion<br />
CHAPTER V<br />
CONCLUSION AND RECOMMENDATIONS<br />
Results showed in this study indicate that lowered seawater <strong>pH</strong> can negatively<br />
affect the survival of Caulerpa lentillifera (lato) under the experimental conditions<br />
used in the study. The species under <strong>pH</strong> 7.7 to 8.3 had shown a relatively positive<br />
growth compared to the others treated in lowered seawater <strong>pH</strong>. As the <strong>pH</strong> of the<br />
treatment decreased compared to the normal seawater <strong>pH</strong>, the final mass of the<br />
species also decreased.<br />
The chlorophyll a concentration of the species had also been a vital factor in<br />
the species’ growth performance. The chlorophyll a concentration of the species<br />
increased as the <strong>pH</strong> also increased. The highest concentration of the species was<br />
found to be 10.97 mg/L treated under <strong>pH</strong> 7.7 to 8.3. The statistical results proved that<br />
there was a significant difference on the weights of the samples in the three trials<br />
among the four groups. Caulerpa lentillifera (lato) has shown a negative growth as<br />
the <strong>pH</strong> of the seawater becomes lowered. Lowered seawater <strong>pH</strong> could therefore be<br />
detrimental to the survival and growth of C. lentillifera (lato).<br />
5.2 Recommendations<br />
In consideration of the lack of resources during the conduct of the study, the<br />
researchers recommend the following:<br />
1. Optimization of experimental conditions (temperature, dissolved oxygen and<br />
salinity) observed in the study.<br />
2. Determine the effects of lowered seawater <strong>pH</strong> in a longer period of time.
3. Use of other marine species for comparative analysis of the effects of lowered<br />
seawater <strong>pH</strong>.<br />
4. Examine the effects of elevated seawater <strong>pH</strong> (basic environment) on Caulerpa<br />
lentillifera.<br />
5. Shorten the period of time in which the extract of Caulerpa lentillifera (Lato)<br />
will be obtained and centrifuged before reading in the spectrophotometer.<br />
6. Choose a site in which the resources (seawater and Caulerpa lentillifera (Lato))<br />
needed in the study is near and abundant.<br />
7. Use tanks that are larger in size.<br />
24
BIBLIOGRAPHY<br />
Apiratikul, R. & Pavasant, P. (2007). Biosorption of Cu2+, Cd2+, Pb2+, and Zn2+<br />
using dried marine green macroalga Caulerpa lentillifera. Retrieved from<br />
http://www.ncbi.nlm.nih.gov/pubmed/16330209.<br />
Atkinson, M. J. & Marubini, F. (1999). Effects of Lowered <strong>pH</strong> and Elevated Nitrate<br />
on Coral Calcification. Marine Ecology Progress Series Volume 188: 117-<br />
121.<br />
Battistoni, M., Fitzgerald, K., Kelson, S. (2007). Effects of Ocean Acidification on a<br />
Turtle Grass Meadow. Ecology Journal of Science Volume 7: 40-42.<br />
Beer, S., Madsen, T. V., Sand-Jensen, K. (1993). Comparison of Photosynthetic<br />
Performance and Carboxylation Capacity in A Range of Aquatic Macrophytes<br />
of Different Growth Forms. Retrieved from<br />
http://www.sciencedirect.com/science/article/pii/030437709390078B.<br />
Caulerpa lentillifera. From http://www .globinmed.com/index.php? option=com<br />
_content &view=article&id=79160:caulerpa-lentillifera-j-agardh &ca<br />
tid=367:c.<br />
Chirapart, A. & Ratana-arporn, P. (2006). Nutritional Evaluation of Tropical Green<br />
Seaweeds Caulerpa lentillifera and Ulva reticulata. National Science Volume<br />
40: 75-83.<br />
Chlorophyll. From http://www.chm.bris.ac.uk/motm/chlorophyll/chlorophyll_h.htm.<br />
Chlorophyll a concentrations. From http://www.ozcoasts. gov.au/indicators/ chloro<br />
phyll_a.jsp.<br />
Clark, D., Lamare, M., Barker, M. (2009). Response of Sea Urchin Pluteus Larvae<br />
(Echinodermata: Echinoidea) to Reduced Seawater <strong>pH</strong>: A Comparison among<br />
a Tropical, Temperate, and a Polar Species. Marine Biology Volume 156:<br />
1125-1137.<br />
Climate Change. From http://www.ecy.wa.gov/climatechange/whatis.htm.<br />
Climate Change. From http://www.epa.gov/climatechange/.<br />
Dere, S., Gunes, T., & Sivaci, R. (1997). Spectrophotometric Determination of<br />
Chloro-phyll - A, B and Total Carotenoid Contents of Some Algae Species<br />
Using Different Solvents. Turkish Journal of Botany Volume 22: 13-17.<br />
Dissolved Oxygen. From www.uwgb.edu/watershed.
Diwan, A. D., Vijayan, K. K. (1995). Influence of Temperature, Salinity, <strong>pH</strong>, and<br />
Light on Molting and Growth in the Indian White Prawn Penaeus indicus<br />
(Crustacea: Decapoda: Penaeidae) Under Laboratory Conditions. Asian<br />
Fisheries Science Volume 8: 63-72.<br />
Doney, Fabry, Feely, Kleypas. (2009). Annual Reviews Marine Science, ©Elsevier,<br />
Luhe, Germany.<br />
Doney, S., Fabry, V., Feely, R., Kleypas, J. (2007). Ocean Acidification: The Other<br />
CO2 Problem. Pacific Marine Environmental Journal Volume 28: 21-33.<br />
Fabry, V., Feely, R., Orr, J., Seibel, B. (2008). Impacts of Ocean Acidification on<br />
Marine Fauna and Ecosystem Processes. Convention on Biological Diversity<br />
Volume 46: 3-23.<br />
Fabry, V., Feely, R., Kleypas, J., Langdon, C., Robbins, L., Sabine, C. (2006).<br />
Impacts of Ocean Acidification on Coral Reefs and Other Marine Calcifiers.<br />
Fay, P. & Wyman, M. (1986). Underwater Light Climate and the Growth and<br />
Pigmentation of Planktonic Blue-Green Algae (Cyanobacteria) I. The<br />
Influence of Light Quantity. Retrieved from<br />
http://adsabs.harvard.edu/abs/1986RSPSB.227..381W.<br />
Forster, P., Ramaswamy, V., Artaxo, P., Berntsen, T., Betts, R., Fahey, D. W.,<br />
Haywood, J., et al.( 2007). Changes in Atmospheric Constituents and In<br />
Radiative Forcing. In Climate Change: the Physical Science Volume 8: 129–<br />
234.<br />
Growth Rate. From http:// www. marine. csiro.au /microalga e/methods /Growth% 20<br />
rate.htm.<br />
Gruber, N. & Sarmiento, J. (2002). Physics Today,© American Institute of Physics,<br />
Maryland, West Virginia, USA.<br />
Hauton, C., Tyrrell, T., & Williams, J. (2008). The Subtle Effects of Sea Water<br />
Acidification on the Amphipod Gammarus locusta. Retrieved from<br />
http://www.biogeosciences.net/6/1479/2009/bg-6-1479-2009.html.<br />
Hinga, K. (2002). Effects of <strong>pH</strong> on Coastal Marine Phytoplankton. Marine Ecology<br />
Progress Series Volume 238: 281-300.<br />
Humphrey, G. F. & Jeffrey, S. W. (1975). New Spectrophotometric Equations for<br />
Determining Chlorophylls a, b, c1 and c2 in Higher Plants, Algae, and Natural<br />
Phytoplankton. Biochemistry & Physiology Volume 167: 191-194.<br />
Iglesias-Prieto, R., Matta J., Robins, W., & Trench, R. (1992). Photosynthetic<br />
Response to Elevated Temperature in the Symbiotic Dinoflagellate<br />
Symbiodinium microadriaticum in Culture. Retrieved from<br />
http://www.pnas.org/content/89/21/10302.abstract.<br />
26
Jenkins, A. (2009). A Closer Look at Caulerpa – Common Aquarium Species and<br />
Their Care. From http://www.wetwebmedia.com/ca/volume_6/volume_6_4<br />
/caulerpa. html.<br />
Kurihara, H. & Ishimatsu, A. (2008). Effects of High Carbon Dioxide Seawater on the<br />
Copepod ( Acartia tsuensis) Through All Life Stages and Subsequent<br />
Generations. Retrieved from http://www.ncbi.nlm.nih.gov/pubmed/18455195.<br />
Le Quere, J., Porra, K. & Stanley, J. (2007). Ocean Acidification. Science Volume<br />
316: 1735-1737.<br />
Levasseur, M., Harrison, P. & Thompson, P. (1993). Physiological Acclimation of<br />
Marine Phytoplankton to Different Nitrogen Sources. Journal of Phycology<br />
Volume 29: 587-595.<br />
McGugh, D. (2003). A Guide to the Seaweed Industry. FAO Fisheries Volume 441:<br />
73-98.<br />
Menzel, D. & Yentsch, C. (1963). A Method for the Determination of Phytoplankton<br />
Chlorophyll and Phaeophytin by Fluorescence. Retrieved from<br />
http://www.sciencedirect.com/science/article/pii/0011747163903589.<br />
Michaelidis, B., Ouzounis, C., Paleras, A., & Portner, H. (2004). Effects of Long -<br />
Term Moderate Hypercapnia on Acid-Base Balance and Growth Rate in<br />
Marine Mussels Mytilus galloprovincialis. Marine Ecology Progress Series<br />
Volume 293: 109-118.<br />
Ocean Acidification. From http:// www.co2s cience.org/ education/reports<br />
/prudentpath /ch10.php.<br />
Orr et. al. (2005). Anthropogenic Ocean Acidification Over the 21 st Century and Its<br />
Impact on Calcifying Organisms. Nature Volume 437: 681-686.<br />
Pattama Ratana-arporn and Anong Chirapart (2006). Nutritional Evaluation of<br />
Tropical Green Seaweeds Caulerpa lentillifera and Ulva reticulata. National<br />
Science Volume 40: 75-83.<br />
<strong>pH</strong>. From http://dl.clackamas.edu/ch105-05/definition.htm.<br />
Pimol, P., Khanidtha, M. & Prasert, P. (2007). Influence of particle size and salinity<br />
on adsorption of basic dyes by agricultural waste: dried Seagrape ( Caulerpa<br />
lentillifera). Environmental Science Volume 20: 760-768.<br />
Porra, R. J., Thompson, W.A., and Kriedemann, P.E. (1989). Determination of<br />
Accurate Extinction Coefficients and Simultaneous Equations for Assaying<br />
Chlorophylls a and b Extracted with Four Different Solvents: Verification of<br />
the Concentration of Chlorophyll Standards by Atomic Absorption<br />
Spectroscopy. Biochimica et Biophysica Volume 975: 384-394.<br />
Salinity. From http://www.thefreedictionary.com/.<br />
27
Science Daily (2008). Cosmic Rays Do Not Explain Gl obal Warming, Study Finds.<br />
From http://www.sciencedaily.com/releases/2008/12/081217075138.htm.<br />
Seawater buffer system. From http://www.livingreefs.com/sea-water-buffer-systemt358.html.<br />
Siegenthaler, U., Stocker, T. F., Monnin, E., Luethi, D., Schwander, J., Stauffer, B.,<br />
Raynaud, D., et al. (2005). Stable Carbon Cycle-Climate Relationship During<br />
the Late Pleistocene. Science Volume 310: 1313–1317.<br />
Skirrow, G. & Riley, S. (1975). Chemical Oceanography. Limnology and<br />
Oceanography Volume 21: 766.<br />
Tortell, P., Giocoma, R., Sigman, D. & Morel, F. (2005). Ocean Acidification Due To<br />
Increasing Atmospheric Carbon Dioxide. The Royal Society Volume 236: 37<br />
-43.<br />
Tukey Test Statistical Tool. Retrieved January 2013 from Past Software.<br />
Vijayan, K. K. & Diwan, A. D. (2008). Influence of Temperature, Salinity, <strong>pH</strong>, and<br />
Light on Molting and Growth in the Indian White Prawn Penaeus indicus<br />
(Crustacea: Decapoda: Penaeidae) Under Laboratory Conditions. Asian<br />
Fisheries Science Volume 8: 63-72.<br />
Warming Effect. From http://timeforchange.org/co2-concentration-causingtemperature-increase.<br />
Water Chemistry and Algae. From http://www.livingreefs.com.<br />
Water Quality. RiverTrends Manual. Retrieved from http://allianceforthebay.org/wpcontent/uploads/2010/12/Volunteer-Water-Quality-Manual.pdf.<br />
Wisconsin State Lab of Hygiene (1991). ESS Method 150.1: Chlorophyll-<br />
Spectrophotometric. Environmental Sciences Section Volume 14: 357-363.<br />
28
APPENDIX A<br />
RAW DATA OF THE <strong>IN</strong>ITIAL AND F<strong>IN</strong>AL WEIGHT OF THE SPECIES AT<br />
DIFFERENT <strong>pH</strong><br />
Table A.1 The weight of Caulerpa lentillifera (Lato) in grams at <strong>pH</strong> 7.7 to 8.3<br />
<strong>pH</strong> 7.7 to 8.3<br />
Weight T1 T2 T3 Average<br />
Initial 31.96 31.21 31.84 31.67<br />
Final 37.37 33.61 28.71 33.23<br />
Table A.2 The weight of Caulerpa lentillifera (Lato) in grams at <strong>pH</strong> 5.7 to 6.3<br />
<strong>pH</strong> 5.7 to 6.3<br />
Weight T1 T2 T3 Average<br />
Initial 31.99 31.88 31.35 31.74<br />
Final 33.36 20.47 18.57 24.13<br />
Table A.3 The weight of Caulerpa lentillifera (Lato) in grams at <strong>pH</strong> 3.7 to 4.3<br />
<strong>pH</strong> 3.7 to 4.3<br />
Weight T1 T2 T3 Average<br />
Initial 33.05 32.76 32.15 32.65<br />
Final 21.82 23.02 19.14 21.33
Table A.4 The weight of Caulerpa lentillifera (Lato) in grams at <strong>pH</strong> 2.7 to 3.3<br />
<strong>pH</strong> 2.7 to 3.3<br />
Weight T1 T2 T3 Average<br />
Initial 31.51 32.71 31.64 31.95<br />
Final 20.66 15.98 14.93 17.19<br />
30
APPENDIX B<br />
RAW DATA OF THE ABSORBANCE OF Caulerpa lentillifera (Lato) AT 645<br />
AND 662 NANOMETERS (nm)<br />
Table B.1 The absorbance of Caulerpa lentillifera (Lato) at 645 nanometers (nm)<br />
<strong>pH</strong> 8 <strong>pH</strong> 6 <strong>pH</strong> 4 <strong>pH</strong> 3<br />
645 nm 0.09833 0.25033 0.032 0.01367<br />
1.455 0.32833 0.264 0.11533<br />
1.79733 0.09733 0.261 0.20667<br />
Average 1.11689 0.22533 0.18567 0.11189<br />
Table B.2 The absorbance of Caulerpa lentillifera (Lato) at 662 nanometers (nm)<br />
<strong>pH</strong> 8 <strong>pH</strong> 6 <strong>pH</strong> 4 <strong>pH</strong> 3<br />
662 nm 0.09833 0.25033 0.032 0.01367<br />
1.45667 0.31267 0.26133 0.10833<br />
1.82967 0.103 0.24767 0.20367<br />
Average 1.15678 0.27678 0.18356 0.10944<br />
31
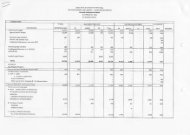
Table C.1 Statistical Analysis of Samples<br />
APPENDIX C<br />
T-TEST STATISTICS RESULTS<br />
Initial Weight Final Weight<br />
N 12 12<br />
Mean 32.004 23.97<br />
Variance 0.33314 55.446<br />
TABLE C.2 Mass (in grams) of Caulerpa lentillifera at different <strong>pH</strong><br />
<strong>pH</strong> Range Initial Weight Final Weight<br />
7.7 to 8.3 31.67 33.23 A<br />
5.7 to 6.3 31.74 24.13 B<br />
3.7 to 4.3 32.65 21.33 C<br />
2.7 to 3.3 31.95 17.19 D<br />
Note: The superscript symbol indicates the t-test statistical analysis results of the weights of the<br />
samples. Varying superscript symbol indicates a significant difference on the weights of the samples.<br />
32
APPENDIX D<br />
PHOTOS<br />
Figure D.1 Fresh samples of Figure D.2 Samples after the treatment<br />
Caulerpa lentillifera<br />
Figure D.3 Experimental Setup<br />
33