Kana et al. 1988. S. Carolina Charleston SLR Case Study
Kana et al. 1988. S. Carolina Charleston SLR Case Study
Kana et al. 1988. S. Carolina Charleston SLR Case Study

You also want an ePaper? Increase the reach of your titles
YUMPU automatically turns print PDFs into web optimized ePapers that Google loves.
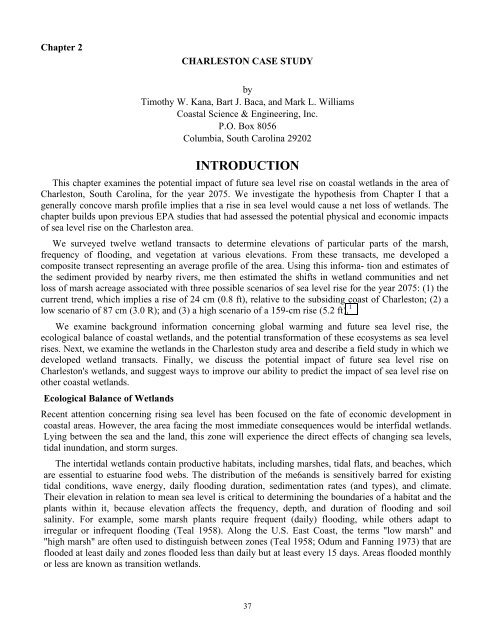
Chapter 2<br />
CHARLESTON CASE STUDY<br />
by<br />
Timothy W. <strong>Kana</strong>, Bart J. Baca, and Mark L. Williams<br />
Coast<strong>al</strong> Science & Engineering, Inc.<br />
P.O. Box 8056<br />
Columbia, South <strong>Carolina</strong> 29202<br />
INTRODUCTION<br />
This chapter examines the potenti<strong>al</strong> impact of future sea level rise on coast<strong>al</strong> w<strong>et</strong>lands in the area of<br />
<strong>Charleston</strong>, South <strong>Carolina</strong>, for the year 2075. We investigate the hypothesis from Chapter I that a<br />
gener<strong>al</strong>ly concove marsh profile implies that a rise in sea level would cause a n<strong>et</strong> loss of w<strong>et</strong>lands. The<br />
chapter builds upon previous EPA studies that had assessed the potenti<strong>al</strong> physic<strong>al</strong> and economic impacts<br />
of sea level rise on the <strong>Charleston</strong> area.<br />
We surveyed twelve w<strong>et</strong>land transacts to d<strong>et</strong>ermine elevations of particular parts of the marsh,<br />
frequency of flooding, and veg<strong>et</strong>ation at various elevations. From these transacts, me developed a<br />
composite transect representing an average profile of the area. Using this informa- tion and estimates of<br />
the sediment provided by nearby rivers, me then estimated the shifts in w<strong>et</strong>land communities and n<strong>et</strong><br />
loss of marsh acreage associated with three possible scenarios of sea level rise for the year 2075: (1) the<br />
current trend, which implies a rise of 24 cm (0.8 ft), relative to the subsiding coast of <strong>Charleston</strong>; (2) a<br />
low scenario of 87 cm (3.0 R); and (3) a high scenario of a 159-cm rise (5.2 ft). 1<br />
We examine background information concerning glob<strong>al</strong> warming and future sea level rise, the<br />
ecologic<strong>al</strong> b<strong>al</strong>ance of coast<strong>al</strong> w<strong>et</strong>lands, and the potenti<strong>al</strong> transformation of these ecosystems as sea level<br />
rises. Next, we examine the w<strong>et</strong>lands in the <strong>Charleston</strong> study area and describe a field study in which we<br />
developed w<strong>et</strong>land transacts. Fin<strong>al</strong>ly, we discuss the potenti<strong>al</strong> impact of future sea level rise on<br />
<strong>Charleston</strong>'s w<strong>et</strong>lands, and suggest ways to improve our ability to predict the impact of sea level rise on<br />
other coast<strong>al</strong> w<strong>et</strong>lands.<br />
Ecologic<strong>al</strong> B<strong>al</strong>ance of W<strong>et</strong>lands<br />
Recent attention concerning rising sea level has been focused on the fate of economic development in<br />
coast<strong>al</strong> areas. However, the area facing the most immediate consequences would be interfid<strong>al</strong> w<strong>et</strong>lands.<br />
Lying b<strong>et</strong>ween the sea and the land, this zone will experience the direct effects of changing sea levels,<br />
tid<strong>al</strong> inundation, and storm surges.<br />
The intertid<strong>al</strong> w<strong>et</strong>lands contain productive habitats, including marshes, tid<strong>al</strong> flats, and beaches, which<br />
are essenti<strong>al</strong> to estuarine food webs. The distribution of the me6ands is sensitively barred for existing<br />
tid<strong>al</strong> conditions, wave energy, daily flooding duration, sedimentation rates (and types), and climate.<br />
Their elevation in relation to mean sea level is critic<strong>al</strong> to d<strong>et</strong>ermining the boundaries of a habitat and the<br />
plants within it, because elevation affects the frequency, depth, and duration of flooding and soil<br />
s<strong>al</strong>inity. For example, some marsh plants require frequent (daily) flooding, while others adapt to<br />
irregular or infrequent flooding (Te<strong>al</strong> 1958). Along the U.S. East Coast, the terms "low marsh" and<br />
"high marsh" are often used to distinguish b<strong>et</strong>ween zones (Te<strong>al</strong> 1958; Odum and Fanning 1973) that are<br />
flooded at least daily and zones flooded less than daily but at least every 15 days. Areas flooded monthly<br />
or less are known as transition w<strong>et</strong>lands.<br />
37
Regularly flooded marsh in the southeast United States is dominated by stands of smooth cordgrass<br />
(Spartina <strong>al</strong>ternit7ora), which may at first appear to lack zonation. However, work by Te<strong>al</strong> (1958), V<strong>al</strong>iela,<br />
Te<strong>al</strong>, and Deuser (1978), and others indicates tot<strong>al</strong> biomass varies considerably within the low marsh,<br />
ranging from zones of t<strong>al</strong>l S. <strong>al</strong>ternit7ora <strong>al</strong>ong active creek banks to stunted or short & atternit7ora stands<br />
away from creeks and drainage channels. The t<strong>al</strong>l S. attemit7ora may be caused by a combination of factors,<br />
including more nutrients, a higher tolerance for the reductions in oxygen that result from subtle increases in<br />
elevation <strong>al</strong>ong levees (DeLaune, Smith, and Patrick 1983), and differences in drainage created by variations<br />
in the porosity of sediment. The zone where S. <strong>al</strong>ternit7ora grows is thought by many to be limited in<br />
elevation to mean high water. This is probably too broad a simplification according to Redfield (1972), who<br />
emphasized that the upper boundary of the low marsh is, at best, indistinct.<br />
High marsh, in contrast, consists of a vari<strong>et</strong>y of species. These include S<strong>al</strong>icornia spp. (glassworts),<br />
Distichlis spicata (spikegrass), Juncus spp. (black needlerush), Spartina patens (s<strong>al</strong>t- marsh hay), and<br />
Borrichia frutescens (sea ox-eye). Te<strong>al</strong> (1958) reports that Juncus marsh tends to be found at a slightly higher<br />
elevation than the S<strong>al</strong>icornniad/Distichlis marsh..<br />
The high marsh can <strong>al</strong>so be distinguished from low marsh on the basis of sediment type, compaction,<br />
and water content. High-rnarsh substrate tends to be firmer and dryer and to have a higher sand content.<br />
Low-marsh substrate seldom has more than 10 percent sand (except where barrier-island washover deposits<br />
introduce an "artifici<strong>al</strong>" supply) and is often composed of very soft mud. Infrequent flooding, prolonged<br />
drying conditions, and irregular rainf<strong>al</strong>l within the high marsh <strong>al</strong>so produce wide variations in s<strong>al</strong>inity. In<br />
some cases, s<strong>al</strong>t pannes form, creating barren zones. But at the other extreme, frequent freshwater runoff<br />
may <strong>al</strong>low less s<strong>al</strong>t-tolerant species, such as cattails, to flourish close to the s<strong>al</strong>t-tolerant veg<strong>et</strong>ation. These<br />
factors contribute to species diversity in the transition zone that lies b<strong>et</strong>ween S. <strong>al</strong>ternit7ora and terrestri<strong>al</strong><br />
veg<strong>et</strong>ation.<br />
By most reports, low marsh dominates the intertid<strong>al</strong> areas <strong>al</strong>ong the southeast (Turner 1976), but the<br />
exact breakdown can vary considerably from place to place. Wilson (1962) reported S. <strong>al</strong>ternit7ora composes<br />
up to 28 percent of the w<strong>et</strong>lands in North <strong>Carolina</strong>, whereas G<strong>al</strong>lagher, Reimold, and Thompson (1972) report<br />
for one estuary in Georgia that the same species covers 94 percent of the "marsh" area. Low marsh is thought<br />
by many to have a substanti<strong>al</strong>ly higher rate of primary productivity than high marsh (Turner 1976). Data<br />
presented in Odum and Fanning (1973) for Georgia marshes support this notion. However, Nixon (1982)<br />
presents data for New England marshes that indicate above-ground biomass production in high marshes<br />
comparable to that of low marshes. Some data from Gulf Coast marshes <strong>al</strong>so support this view (Pendl<strong>et</strong>on<br />
1984).<br />
Potenti<strong>al</strong> Transformation of W<strong>et</strong>lands<br />
The late Holocene (Last sever<strong>al</strong> thousand years) has been a time of gradu<strong>al</strong> infilling and loss of water<br />
areas (Schubel 1972). During the past century, however, sedimentation and peat formation have kept pace<br />
with rising sea level over much of the East Coast (e.g., Ward and Domeracki 1978; Duc 1981; Boesch <strong>et</strong> ad.<br />
1983). Thus, apart from the filling necessary to build the city of <strong>Charleston</strong>, the zonation of w<strong>et</strong>land habitats<br />
has remained fairly constant there. Changes in the rate of sea level rise or sedimentation, however, would<br />
<strong>al</strong>ter the present ecologic<strong>al</strong> b<strong>al</strong>ance.<br />
If sediment is deposited more rapidly than sea level rises, low marsh will flood less frequently and<br />
become high marsh or upper transition w<strong>et</strong>lands, which seems to be occurring at the mouths of some<br />
estuaries where sediment is plentiful. The subtropic<strong>al</strong> climate of the southeastern United States produces<br />
high weathering rates, which provide a lot of sediment to the coast<strong>al</strong> area. Excess supplies of sediment<br />
trapped in estuaries have virtu<strong>al</strong>ly buried w<strong>et</strong>lands around portions of the Chesapeake, such as the<br />
Gunpowder River, where a coloni<strong>al</strong> port is now landlocked.<br />
If sea level rises more rapidly in the future, increased flooding may cause margin<strong>al</strong> zones<br />
close to present low tide to be under water too long each day to <strong>al</strong>low marshes to flourish. Unless<br />
38
sedimentation rates are high w<strong>et</strong>lands can maintain the distribution of their habitats only if they shift <strong>al</strong>ong<br />
the coast<strong>al</strong> profile-mving landward and upward, to keep pace with rising sea levels. Tot<strong>al</strong> marsh acreage<br />
can only remain constant if slopes and substrate are uniform above and below the w<strong>et</strong>lands, and inundation<br />
is unimpeded by human activities such as the construction of bulkheads. Titus, Henderson, and Te<strong>al</strong> (1984),<br />
however, point out that there is usu<strong>al</strong>ly less land immediately above w<strong>et</strong>land elevation than at w<strong>et</strong>land<br />
elevation (See Figure 1-5). Therefore, significant changes in the habitats and a reduction in the area they<br />
cover will gener<strong>al</strong>ly occur with accelerated sea level rise. Moreover, increasing development <strong>al</strong>ong the<br />
coast is likely to block much of the natur<strong>al</strong> adjustment in some areas.<br />
Louisiana is an extreme example. Human interference with natur<strong>al</strong> sediment processes and relative sea<br />
level rise are resulting in the drowning of 100 sq km of w<strong>et</strong>lands every year (Gagliano, Meyer Arendt, and<br />
Wicker 1981; Nummd<strong>al</strong> 1982). There is virtu<strong>al</strong>ly no ground to which the w<strong>et</strong>lands can migrate. Thus,<br />
w<strong>et</strong>lands are converting to open water; high-marsh zones are being replaced by low marsh, or tid<strong>al</strong> flats;<br />
and s<strong>al</strong>twater intrusion is converting freshwater swamps and marsh to brackish marsh and open water.<br />
COASTAL HABITATS OF THE CHARLESTON STUDY AREA<br />
As shown in Figure 2-1, the case study area, str<strong>et</strong>ching across 45,500 acres, is separated by the three<br />
major tid<strong>al</strong> rivers that converge at <strong>Charleston</strong>: the Ashley, Cooper, and Wando Rivers. In addition, the<br />
study area covers five land areas:<br />
West Ashley, which is primarily a low-density residenti<strong>al</strong> area with expansive<br />
boundary marsh;<br />
<strong>Charleston</strong> Peninsula, which contains the bulkheaded historic district built partly on landfill;<br />
Daniel Island, which is an artifici<strong>al</strong>ly embanked dredge spoil island;<br />
Mount Pleasant, which derives geologic<strong>al</strong>ly from ancient barrier island deposits oriented par<strong>al</strong>lel to<br />
the coast; and<br />
Sullivans Island, which is an accr<strong>et</strong>ing barrier island at the harbor entrance.<br />
Six discr<strong>et</strong>e habitats are found in the <strong>Charleston</strong> area, distinguished by their elevation in<br />
relation to sea level and, thus, by how often they are flooded (Figure 2-2):<br />
highland - flooded rarely (47 percent of study area)<br />
transition w<strong>et</strong>lands - flooding may range from biweekly to annu<strong>al</strong>ly (3 percent)<br />
high marshes - flooding may range from daily to biweekly (5 percent)<br />
low marshes - flooded once or twice daily (12 percent)<br />
tid<strong>al</strong> t7ats - flooded about h<strong>al</strong>f of the day (6 percent)<br />
open water - (27 percent)<br />
This flooding, in turn, controls the kinds of plant species that can survive in an area. In<br />
<strong>Charleston</strong>, the present upper limit of s<strong>al</strong>t-tolerant plants is approximately 1.8-2.0 m (6.0-6.5 ft) above man<br />
sea level (Scott, Thebeau, and <strong>Kana</strong> 1981). This elevation <strong>al</strong>so represents the effective lower limit of human<br />
development, except in areas where w<strong>et</strong>lands have been destroyed. The zone below this elevation<br />
(delineated on the basis of veg<strong>et</strong>ation types) is referred to as a critic<strong>al</strong> area under South <strong>Carolina</strong> Coast<strong>al</strong><br />
Zone Management laws and is strictly regulated (U.S. Department of Commerce 1979).<br />
39
Although most of the marsh in this area is flooded twice daily, the upper limit of s<strong>al</strong>t-tolerant species<br />
is considerably above mean high water. Because of the lunar cycle and other astronomic or climatic events,<br />
higher tides than average occur periodic<strong>al</strong>ly. Spring tides occur approximately fortnightly in conjunction<br />
with the new and full moons. The statistic<strong>al</strong> average of these, referred to as mean high water spring, has an<br />
elevation of 1.0 m (3.1 ft) above mean sea level in <strong>Charleston</strong> (U.S. Department of Commerce 1981).<br />
Less frequent tid<strong>al</strong> flooding occurs annu<strong>al</strong>ly at even higher elevations ranging upwards of 1.5 m (5.0<br />
ft) above mean sea level. In a South <strong>Carolina</strong> marsh near the case study area, the flooding of margin<strong>al</strong><br />
highland occurred at elevations of 1.5-2 m above man sea level (approximately 80 cm above norm<strong>al</strong>). The<br />
peak astronomic tide that was responsible for the flooding included an estimated wind s<strong>et</strong>up of 15-20 cm<br />
(0.54.0 ft) under 7-9 m/s (1347 mph) northeast winds.<br />
40
The <strong>Charleston</strong> area has a complex morphology. Besides the three tid<strong>al</strong> rivers that converge<br />
in the area, numerous channels dissect it, exhibiting dendritic drainage patterns typic<strong>al</strong> of drowned<br />
coast<strong>al</strong> plain shorelines.<br />
A back-barrier, tid<strong>al</strong> creek/marsh/mud-flat system near Kiawah Island, approximately 20 km<br />
south of <strong>Charleston</strong>, has a typic<strong>al</strong> drainage pattern. Throughout the area, highlands are typic<strong>al</strong>ly less<br />
than 5 m (16 ft) above man sea level. With a mean tid<strong>al</strong> range of 1.6 m (5.2 ft), a broad area <strong>al</strong>ong<br />
the coast<strong>al</strong> edge is flooded twice each day. The natur<strong>al</strong> portions of <strong>Charleston</strong> Harbor are dominated<br />
by hinging s<strong>al</strong>t marshes from sever<strong>al</strong> m<strong>et</strong>ers to over one kilom<strong>et</strong>er wide.<br />
The upper limit of the marsh can usu<strong>al</strong>ly be distinguished by an abrupt transition from<br />
upland veg<strong>et</strong>ation to marsh species tolerant of occasion<strong>al</strong> s<strong>al</strong>t-water flooding. Topographic maps of<br />
<strong>Charleston</strong> gener<strong>al</strong>ly show this break to have an elevation of about 1.5 m (+5 ft). Along the back<br />
side of Kiawah Island, just south of the case study area, one can observe such an abrupt transition<br />
b<strong>et</strong>ween highland terrestri<strong>al</strong> veg<strong>et</strong>ation and the marsh area. Where the waterfront is developed, the<br />
transition from marsh or tid<strong>al</strong> creeks to highland can be very distinct because of the presence of<br />
shore-protection structures, such as vertic<strong>al</strong> bulkheads and riprap. Another marsh/fid<strong>al</strong>-flat system<br />
located behind Isle of P<strong>al</strong>ms and Dewees Island, just outside of the <strong>Charleston</strong> study area, contains<br />
a mud flat and circular oyster mounds near the marsh and tid<strong>al</strong> channels. Oyster mounds were found<br />
at a wide range of elevations <strong>al</strong>ong tid<strong>al</strong> creek banks, but over tid<strong>al</strong> flats most were common at<br />
elevations of 3046 cm G.0-1.5 ft).<br />
Large portions of the back-barrier environments of <strong>Charleston</strong> consist of tid<strong>al</strong> flats at lower<br />
elevations than the surrounding marsh. The most extensive intertid<strong>al</strong> mud flats around <strong>Charleston</strong><br />
gener<strong>al</strong>ly occur in the sheltered zone directly behind the barrier islands. They are thought to<br />
represent areas with lower sedimentation rates (Hayes and <strong>Kana</strong> 1976) away from major tid<strong>al</strong><br />
channels or sediment sources.<br />
Much of the <strong>Charleston</strong> shoreline has accr<strong>et</strong>ed (advanced seaward and upward) during the<br />
past 40 years (<strong>Kana</strong> <strong>et</strong> <strong>al</strong>. 1984). Marshes accr<strong>et</strong>e through the s<strong>et</strong>tling of fine-grained sediment on<br />
the marsh surface, as cordgrass (Spartina <strong>al</strong>temiflora) and other species baffle the flow adjacent to<br />
tid<strong>al</strong> creeks. Marsh sedimentation has gener<strong>al</strong>ly been able to keep up with or exceed recent sea level<br />
rises <strong>al</strong>ong this area of the eastern U.S. shoreline (Ward and Don-&racki 1978). Much of the<br />
sediment into the <strong>Charleston</strong> area derives from suspended sediment originating primarily from the<br />
Cooper River, which carries the diverted flow of the Santee River (until planned rediversion in<br />
1986; U.S. Army Corps of Engineers, unpublished gener<strong>al</strong> design memorandum).<br />
41
WETLANDS TRANSECTS: METHOD AND RESULTS<br />
To d<strong>et</strong>ermine how an accelerated rise in sea level would affect the w<strong>et</strong>lands of <strong>Charleston</strong>,<br />
one needs to know the portions of land at particular elevations and the plant species found at those<br />
elevations. To characterize the study area, we randomly selected and an<strong>al</strong>yzed twelve transects<br />
(sample cross sections, each running <strong>al</strong>ong a line extending from the upland to the water). This<br />
section explains how the data from each transect were collected and an<strong>al</strong>yzed, presents the results<br />
from each transect, and shows how we created a composite transect based on those results.<br />
Data Collection and An<strong>al</strong>ysis<br />
For budg<strong>et</strong>ary and logistic<strong>al</strong> reasons, m had to use representative transacts near, but not<br />
necessarily within, the study area. For example, a limiting criterion was nearness to convenient places<br />
where reliable elevations, or benchmarks, had <strong>al</strong>ready been established. The marshes be- hind<br />
Kiawah Island and Isle of P<strong>al</strong>ms are similar to the marshes behind Sullivans Island, but are more<br />
accessible. As Figure 2-3 shows, <strong>al</strong>l the transacts %ere within 20 km (12 mi) of the study area.<br />
Each transect began at a benchmark located on high ground near a marsh's boundary, and<br />
ended at a tid<strong>al</strong> creek or mud flat, or after covering 300 m (1,000 ft)-whichever came first. The length<br />
of the transacts was limited because of the difficulty of wading through very soft muds. Although this<br />
procedure may have biased the sample somewhat, logistics prevented a more rigorous survey.<br />
42
For each transect, m measured elevation and distance from a benchmark using a rod and level.<br />
Elevations were surveyed wherever there was a noticeable break in slope or change in species. The<br />
average distance b<strong>et</strong>ween points was about 7.5 m (25 ft). Along each transect me collected and tagged<br />
samples of species for laboratory typing and verification, noting such information as the elevation of the<br />
boundaries b<strong>et</strong>ween different species. By measuring the length of the transect that a species covered and<br />
dividing it by the transect's tot<strong>al</strong> length, m computed percentages for the distribution of each species<br />
<strong>al</strong>ong a transect.<br />
Results of Individu<strong>al</strong> Transects<br />
Table 2-1 (see page 44) summarizes the results of the twelve transects. 2 It presents the princip<strong>al</strong><br />
species observed <strong>al</strong>ong each transect, their "mod<strong>al</strong>"-or most common-elevations, the percentage of each<br />
transect they covered, and the length of each transect. For example, in transect number 6, Borrichia<br />
frutescens was found at a mod<strong>al</strong> elevation of 118 cm (3-86 ft) and covered 40 percent of the transect, or<br />
about 37 m (120 ft).<br />
Because species often overlapped, the sums of the percentages exceed 100. In addition, to omit<br />
any margin<strong>al</strong> plants that exist at transition zones, a mod<strong>al</strong> elevation differs slightly from the arithm<strong>et</strong>ic or<br />
weighted mean.<br />
Composite Transect<br />
To model the scenarios of future sea level rise, me had to develop a composite transect from the<br />
data in Table 2-1. Thus, for each species, one mod<strong>al</strong> elevation was estimated from the various elevations<br />
in Table 2-1. Similarly, the percent of each transect covered by an individu<strong>al</strong> species was used to estimate<br />
an average percent coverage for <strong>al</strong>l transacts (Table 2-2, p. 45).<br />
This information <strong>al</strong>lowed us to choose for our composite the five species that dominated the high<br />
and low marshes in <strong>al</strong>l the transects: Spartina <strong>al</strong>ternit7ora, S<strong>al</strong>icornia virginica, Limonium carolinianum,<br />
Distichlis spicata, and Borrichia frutescens. We c<strong>al</strong>l these the indicator species. Figure 2-4 shows the<br />
mod<strong>al</strong> elevations for these five species, for two other s<strong>al</strong>t-tolerant plants found in the transects (Juncus<br />
roemerianus and Spartina patens), and for a species found in tid<strong>al</strong> flats and under water (Crassostrea<br />
virginica). The primary zone where each species occurs is indicated by the shaded area; occasion<strong>al</strong><br />
species occurrence outside the primary zone is indicated by the unshaded, dashed-line boxes. Figure 2-4<br />
<strong>al</strong>so outlines the boundaries for the six habitats and indicates the estimated percentage of the study area<br />
that each covers.<br />
Composite w<strong>et</strong>lands transect for <strong>Charleston</strong> illustrating the approximate percent occurrence and mod<strong>al</strong><br />
elevation for key indicator species or habitats based on results of 12 surveyed transects. Minor species<br />
have been omitted. Elevations are with respect to NGVD, which is about 15 cm lower than current sea<br />
level. Current tid<strong>al</strong> ranges are shown at right.<br />
43
While this profile is by no means precise, it gives some insight into the expected habitat for a<br />
Oven elevation and the tolerances various species have for flooding. For example, it establishes the<br />
gener<strong>al</strong> lower limit of marsh for <strong>Charleston</strong>, where it is presumed that too frequent flooding kills<br />
low-marsh species and transforms the marsh to unveg<strong>et</strong>ated mud flats.<br />
The low-marsh plant Spartina <strong>al</strong>temit7ora was the most dominant species, making up 69 percent<br />
of the composite transect. Its mod<strong>al</strong> elevation was 75 cm (2.45 ft), close to today's neap high fide.<br />
For <strong>Charleston</strong>, this is about 15 cm (0.5 ft) below mean high water. Figure 2-4 shows that S.<br />
<strong>al</strong>temit7ora extends beyond the limits of low marsh into both high marsh and tid<strong>al</strong> flat however, this<br />
species occurs primarily at low-marsh elevations.<br />
The other indicator species are gener<strong>al</strong>ly considered to be high-marsh species. These include<br />
Distichlis spicata, Borrichia frutescens, Limoniun carolinianun and S<strong>al</strong>icomia virginica,<br />
Spartina patens, while having been found to coexist with Distichlis spicata in Maryland and North<br />
<strong>Carolina</strong> marshes (E.C. Pendl<strong>et</strong>on, person<strong>al</strong> communication, December 1984), is uncommon in<br />
<strong>Charleston</strong> at elevations less than 122 cm (Scott, Thebeau, and <strong>Kana</strong> 1981). The apparent<br />
inconsistency in these observations may be related to the significant difference in tid<strong>al</strong> range<br />
b<strong>et</strong>ween centr<strong>al</strong> South <strong>Carolina</strong> and North <strong>Carolina</strong>.<br />
Area Estimates<br />
Two sources of information mere available for land area estimates: United States Geologic<strong>al</strong><br />
Survey (USGS) 7.5-minute quadrangles and digitized computer maps prepared in an earlier EPAsponsored<br />
case study (<strong>Kana</strong> <strong>et</strong> <strong>al</strong>. 1984). Using topographic and contour maps, me estimated the<br />
number of acres of each habitat in the <strong>Charleston</strong> area (see Figure 2-1) 4<br />
Our results were graphic<strong>al</strong>ly d<strong>et</strong>ermined and spot-checked by a second investigator to ensure<br />
they mere consistent to within ± 15 percent for each measurement. Thus, the error limits for the<br />
over<strong>al</strong>l study area are estimated to be a maximum of ± 15 percent by subenvironnient. 5<br />
45
Tid<strong>al</strong>-flat areas mere estimated using aeri<strong>al</strong> photos and shaded patterns shown on USGS<br />
topographic she<strong>et</strong>s. The marsh was initi<strong>al</strong>ly lumped tog<strong>et</strong>her (high and low marsh) to d<strong>et</strong>ermine<br />
representative areas for each <strong>Charleston</strong> community. The tot<strong>al</strong> number of acres for this zone was divided<br />
into high- and low-marsh areas by applying the typic<strong>al</strong> percentage of each <strong>al</strong>ong the composite transect<br />
(70 percent low marsh and 30 percent high marsh). The transition zone areas mere estimated from the<br />
digitized computer maps.<br />
WETLAND SCENARIOS FOR THE CHARLESTON AREA:<br />
MODELING AND RESULTS<br />
After establishing the basic relationships among elevation, w<strong>et</strong>land habitats, and occurrence of<br />
species for <strong>Charleston</strong>, the next steps in our an<strong>al</strong>ysis mere to develop a conceptu<strong>al</strong> model for changes in<br />
s<strong>al</strong>twater w<strong>et</strong>lands under an accelerated rise in sea level and to apply the model to the case study area.<br />
Scenario Modeling<br />
Based on an earlier EPA study (Barth and Titus 1984), me chose three scenarios of future sea<br />
level rise (described in Chapter 1, page 9): baseline (current trends), low, and high. 6 To be consistent<br />
with the study, me projected the scenarios to the year 2075-95 years after the baseline date of 1980 used<br />
to d<strong>et</strong>ermine "present" conditions; we <strong>al</strong>so assumed that the current rate of relative sea level rise in<br />
<strong>Charleston</strong> is 2.5 mm/yr, <strong>al</strong>though more recent studies suggest 3.4 mm/yr.<br />
The model for future w<strong>et</strong>land zonation <strong>al</strong>so accounted for sedimentation and peat formation,<br />
which parti<strong>al</strong>ly offs<strong>et</strong> the impact of sea level rise by raising the land surface. Sedimentation rates are<br />
highly variable within East Coast marsh/tid<strong>al</strong>-flat systems, with published v<strong>al</strong>ues ranging from 2 to 18<br />
mm (.08 to .71 in) per year (Redfield 1972; Hatton, DeLaune, and Patrick 1983). Ward and Domeracki<br />
(1978) established markers in an intertid<strong>al</strong> marsh 20 km (12 mi) south of the <strong>Charleston</strong> case study area<br />
and measured sedimentation rates of 4-6 mm (.16-.24 in) per year. Hatton, DeLaune, and Patrick (1983)<br />
reported comparable v<strong>al</strong>ues (3-5 mm, or .12-.20 in, per year) for Georgia marshes. Although the rate of<br />
marsh accr<strong>et</strong>ion will depend on proximity to tid<strong>al</strong> channels (sediment sources) and density of plants<br />
(baffling effect and d<strong>et</strong>ritus), me believe the published rate of 4-6 mm per year is reasonably<br />
representative for the case study area (Ward and Domeracki 1978). Thus, for purposes of modeling, me<br />
assumed a sedimentation rate of 5 mm per year. Obviously, the actu<strong>al</strong> rate will vary across any w<strong>et</strong>land<br />
transect, so this assumed v<strong>al</strong>ue represents an average. Lacking sufficient quantitative data and<br />
considering the broad application of our model, me found it was more feasible to apply a constant rate for<br />
the entire study area.<br />
As shown in Table 2-3, the combined sea level rise scenarios and sedimentation rates yield a<br />
positive change in substrate elevation for the baseline and a negative change for the low and high<br />
scenarios. The positive change for baseline conditions follows the recent trend of marsh accr<strong>et</strong>ion in<br />
<strong>Charleston</strong>.<br />
For each of these three scenarios, me considered four <strong>al</strong>ternatives for protecting developed<br />
uplands from the rising sea: no protection, compl<strong>et</strong>e protection, and two intermediate protection options.<br />
Protective options consist of bulkheads, dikes, or seaw<strong>al</strong>ls constructed at the lower limit of existing<br />
development, which is gener<strong>al</strong>ly the upper limit of w<strong>et</strong>lands (S.C. Coast<strong>al</strong> Council critic<strong>al</strong> area line).<br />
Figure 2-5 illustrates the various options. If <strong>al</strong>l property above today's w<strong>et</strong>lands is protected with a w<strong>al</strong>l,<br />
for example, the w<strong>et</strong>lands will be squeezed b<strong>et</strong>ween the w<strong>al</strong>l and the sea. Table 2-4 illustrates the<br />
intermediate protection options, whose economic implications were estimated by Gibbs (1984).<br />
46
If people build w<strong>al</strong>ls to protect property form rising sea level, the march will be squeezed<br />
b<strong>et</strong>ween the w<strong>al</strong>l and the sea. Sk<strong>et</strong>ches show only the upper part of the w<strong>et</strong>lands which would be<br />
affected by shore-protection structures. Mean sea level is off the diagram to the right.<br />
47
For our modeling, we used the composite habitat elevations m derived from the twelve<br />
transacts (see Figure 24). The cutoff elevation for highland around <strong>Charleston</strong> was assumed to be an<br />
elevation of 200 cm (6.5 ft). In gener<strong>al</strong>, land above this elevation around <strong>Charleston</strong> is free of yearly<br />
flooding and is dominated by terrestri<strong>al</strong> (freshwater) veg<strong>et</strong>ation. Although terrestri<strong>al</strong> veg<strong>et</strong>ation occurs<br />
at lower elevations that are impounded b<strong>et</strong>ween dikes or ridges, this information is less relevant for<br />
sea level rise modeling. The zone of concern is the area bordering tid<strong>al</strong> waterways, where slopes are<br />
assumed to rise continuously without intermediate depressions.<br />
The transition zone is defined as a s<strong>al</strong>t-tolerant area b<strong>et</strong>ween predominant, high-marsh species<br />
and terrestri<strong>al</strong> veg<strong>et</strong>ation. This area is above the limit of fortnightly (spring) tides but is gener<strong>al</strong>ly<br />
subject to flooding sever<strong>al</strong> times each year. If storm frequency remains constant, it is reasonable to<br />
assume that storm tides will shift upward by the amount of sea level rise (Titus <strong>et</strong> <strong>al</strong>. 1984). However,<br />
most climatologists expect the greenhouse warming to <strong>al</strong>ter storm patterns significantly. Nevertheless,<br />
because no predictions are available, we assumed that storm patterns will remain the same.<br />
High marsh is defined here by a narrow elevation range of 90 to 120 cm (3 to 4 ft), and low<br />
marsh ranges from 45 to 90 cm (1.5 to 3.0 ft). This delineation follows the results of surveyed<br />
transacts and species zonation described earlier. The lower limit of the marsh was estimated from the<br />
typic<strong>al</strong> transition to mud flats. Sheltered tid<strong>al</strong> flats actu<strong>al</strong>ly occur b<strong>et</strong>ween mean low water and mean<br />
high water but were found to be more common in <strong>Charleston</strong> in the elevation range of 0-46 cm (0-1.5<br />
ft). This somewhat arbitrary division was <strong>al</strong>so based on the contours available on USGS maps, which<br />
enabled estimates of zone areas within the case study region.<br />
Scenario Results<br />
Based on the shore-protection <strong>al</strong>ternatives for the five suburbs around <strong>Charleston</strong>, me<br />
computed area distributions under the baseline, low, and high scenarios. Figure 2-5 illustrates shoreprotection<br />
scenarios and their effects on the w<strong>et</strong>land transect. Our basic assumption<br />
was that the w<strong>et</strong>land habitats' advance toward land ends at 200 cm NGVD (185 cm above mean sea<br />
48
level). Dikes or bulkheads would be constructed under certain protection scenarios at that elevation on<br />
the date in question to prevent further inundation.<br />
Because the results are fairly d<strong>et</strong>ailed for the five separate subareas and four protection scenarios<br />
within the <strong>Charleston</strong> case study area, m have only listed the over<strong>al</strong>l changes in Tables 2-5 and 2-6<br />
(compl<strong>et</strong>e protection and no protection, see p. 50). Results by subarea for <strong>al</strong>l four protection scenarios,<br />
given in Appendix 2-B, illustrate the variability of land, water, and w<strong>et</strong>land acreage from one subarea to<br />
another. For example, the peninsula currently has a much loner percentage of low marsh than <strong>al</strong>l other<br />
areas. Tid<strong>al</strong> flat distribution was <strong>al</strong>so variable, ranging from 3.2 percent of the Mt. Pleasant zone to 8.6<br />
percent of the Sullivans Island zone. The summary percentages given in Table 2-6 are appropriately<br />
weighted for the five subareas within the study area.<br />
Table 2-5 lists the number of acres for each elevation zone in 1980 (existing) and for the baseline,<br />
low, and high scenarios with and without structur<strong>al</strong> protection by the year 2075. The percentage of the<br />
tot<strong>al</strong> study area that a habitat covers is given in parentheses in Table 2-5 and graphic<strong>al</strong>ly presented in<br />
Figure 2-6, below. Table 2-5 indicates losses under <strong>al</strong>l scenarios with no protection for the four upper<br />
habitats and gains in area for tid<strong>al</strong> flats and water areas. For example, without protection, highland would<br />
decrease from 46.6 percent of the tot<strong>al</strong> area in 1980 to 41.7 percent in 2075 under the high scenario. This<br />
represents a loss of over 2,200 acres or 10 percent of the present highland area. Land that is now<br />
terrestri<strong>al</strong> would be transformed into transition-zone or high-marsh habitats a century from now. Under<br />
the 2075 high scenario with no protection, high and low marsh, combined, would decrease from 7,700<br />
acres to 1,535 acres-a reduction of <strong>al</strong>most 80 percent. While highland and marsh areas would decrease<br />
under the no-protection scenarios, water areas would increase dramatic<strong>al</strong>ly-from 27.4 percent to as much<br />
as 48.7 percent-under the high scenario of 2075.<br />
Conceptu<strong>al</strong> model of the shift in w<strong>et</strong>lands zonation <strong>al</strong>ong a shoreline profile if sea level rise exceeds<br />
sedimentation by 40cm. In gener<strong>al</strong>, the response will be a landward shift and <strong>al</strong>tered re<strong>al</strong> distribution of<br />
each habitat because of variable slopes at each elevation interv<strong>al</strong>.<br />
With structur<strong>al</strong> protection implemented at different times for each community (see Table 2-4),<br />
highland areas would be maintained at a constant acreage, but transition and high-marsh habitats would be<br />
compl<strong>et</strong>ely eliminated by 2075 under the high scenario (because of the lack of area to accommodate a<br />
landward shift). Tot<strong>al</strong> marsh acreage would decrease from 7,700 acres to 3,925 acres (2075 low scenario),<br />
or 750 acres (2075 high scenario), under the assumed mitigation in Table 2-4.<br />
49
The n<strong>et</strong> change in areas under the various scenarios listed in Table 2-6 indicates that <strong>al</strong>l<br />
habitats mould undergo significant <strong>al</strong>teration. Even under the baseline scenario, which assumes<br />
historic<strong>al</strong> rates of sea level rise, 20-35 percent losses of representative marsh areas are expected by<br />
2075. Protection under the low scenario (as outlined by Gibbs 1984) mould have virtu<strong>al</strong>ly no effect<br />
on high or low marsh coverage; but it would cause a substanti<strong>al</strong>ly increased loss of transition<br />
w<strong>et</strong>lands. Under the high scenario with protection, highland would be saved at the expense of <strong>al</strong>l<br />
transition and high marsh areas and <strong>al</strong>most 90 percent of the low marsh. Even under the low<br />
scenario, sea level rise would become the dominant cause of w<strong>et</strong>land loss in the <strong>Charleston</strong> area.<br />
RECOMMENDATIONS FOR FURTHER STUDY<br />
This study is a first attempt at d<strong>et</strong>ermining the potenti<strong>al</strong> impact of accelerated sea level rise<br />
on w<strong>et</strong>lands; there remains a need for case studies of other estuaries. Louisiana provides a presentday<br />
an<strong>al</strong>og for the effect of rapid sea level rise on w<strong>et</strong>lands because of high subsidence rates <strong>al</strong>ong<br />
the Mississippi Delta (see Gagliano 1984). Addition<strong>al</strong> studies in that part of the coast should<br />
attempt to document the tempor<strong>al</strong> rate of transformation from marsh to submerged w<strong>et</strong>lands.<br />
Accurate w<strong>et</strong>land transacts with controlled elevations are required to d<strong>et</strong>ermine the<br />
preferred substrate elevations for predominant w<strong>et</strong>land species. With b<strong>et</strong>ter criteria for elevation<br />
and veg<strong>et</strong>ation, we can use remote-sensing techniques and aeri<strong>al</strong> photography to delineate w<strong>et</strong>land<br />
contours on the basis of veg<strong>et</strong>ation. Scenario modeling can then proceed using computer-enhanced<br />
images of w<strong>et</strong>lands and surrounding areas, for more accurate delineation of marsh habitats. Using<br />
historic<strong>al</strong> aeri<strong>al</strong> photos, it may <strong>al</strong>so be possible to infer sedimentation rates by changes in plant<br />
coverage or species type, which could be related to elevation using some of the criteria provided in<br />
this report.<br />
Another problem that remains with this type of study is the frame of reference for mean sea<br />
level. For practic<strong>al</strong> reasons, mean sea level for a standard period (18.6 years gener<strong>al</strong>ly) cannot be<br />
computed until after the period ends. Therefore, fixed references, such as the NGVD of 1929, are<br />
used. But sea level in <strong>Charleston</strong> has an elevation of about 15 cm (NGVD). If everyone uses the<br />
same reference plane for present and future conditions, the problem may be minor. But it does not<br />
<strong>al</strong>low us to d<strong>et</strong>ermine mod<strong>al</strong> elevations with respect to today's sea level. The transacts surveyed<br />
for the present study suggest that S. <strong>al</strong>terniflora (low marsh) grows optim<strong>al</strong>ly at an elevation of 75<br />
cm (2.45 ft) above mean sea level, close to mean high water (U.S. Department of Commerce<br />
1981). Compared with today's mean sea level in <strong>Charleston</strong>, S. <strong>al</strong>terniflora probably tends to grow<br />
as much as 15 cm below actu<strong>al</strong> mean high water, which may confuse the reader who forg<strong>et</strong>s that<br />
the NGVD is 15 cm below today's sea level.<br />
The basic criteria for delineating elevations of various w<strong>et</strong>land habitats in this study can be<br />
easily tested in other areas. By applying norm<strong>al</strong>ized flood probabilities (similar to those depicted<br />
in Figure 2-7), it will be possible to measure marsh transacts in other tide-range areas and relate<br />
them to the results for <strong>Charleston</strong>.<br />
Norm<strong>al</strong>ized Elevations<br />
The absolute mod<strong>al</strong> elevation for each species is site-specific for <strong>Charleston</strong>. Presuming<br />
that the zonation is controlled primarily by tid<strong>al</strong> inundation, it is possible to norm<strong>al</strong>ize the data for<br />
other tide ranges based on frequency curves for each water level. Figure 2-7 contains two such<br />
"tide probability" curves, based on d<strong>et</strong>ailed statistics of Atlantic Coast water levels given in<br />
Ebersole (1982) and summarized in Appendix 2-A. The graph of Figure 2-7A gives the<br />
probability of various water levels for <strong>Charleston</strong>. In Figure 2-7B, the data have been norm<strong>al</strong>ized<br />
51
for the mean tide range of 156 cm (5.2 ft) in <strong>Charleston</strong> and given as a cumulative probability<br />
distribution. These graphs are applicable to much of the southeastern U.S. coast by substituting<br />
different tide ranges. Each graph provides a measure of the duration of time over the year that<br />
various w<strong>et</strong>land elevations are underwater.<br />
In the case of S<strong>al</strong>icomia virginica (+3.16 ft for <strong>Charleston</strong>), the cumulative frequency of<br />
flooding is approximately 4 percent (Figure 2-7B and Appendix 2,A). If one wanted to apply<br />
52
these results for an area with a different tide range but similar species occurrence, such as Sapelo<br />
Island (Georgia), the flooding frequency for S. virginica could be used to estimate its mod<strong>al</strong><br />
elevation at the loc<strong>al</strong>ity. With a mean tide range of 8.5 ft at Sapelo, S. virginica is likely to occur<br />
around + 5.3 ft MSL (based on substitution of the tide range in Figure 2-7B). This procedure can<br />
be applied for other southeastern U.S. marshes as a preliminary estimate of loc<strong>al</strong> mod<strong>al</strong> elevations.<br />
We do not consider elevation results for the transects to be definitive because of the<br />
relatively sm<strong>al</strong>l sample size. However, the results are sufficiently indicative of actu<strong>al</strong> trends to<br />
<strong>al</strong>low scenario modeling. With the tide-probability curves presented, it should be possible to check<br />
these results against other areas with similar climatic patterns, but different tide ranges.<br />
CONCLUSIONS<br />
Our results appear to confirm the hypothesis that there would be less land for w<strong>et</strong>lands to<br />
migrate onto if sea level rises, than the current acreage of w<strong>et</strong>lands in the <strong>Charleston</strong> area.<br />
W<strong>et</strong>lands in the <strong>Charleston</strong> area have been able to keep pace with the recent historic<strong>al</strong> nse<br />
in sea level of one foot per century. However, a three- to five-foot rise in the next century resulting<br />
from the greenhouse effect would <strong>al</strong>most certainly exceed their ability to keep pace, and thus result<br />
in a n<strong>et</strong> loss of w<strong>et</strong>land acreage.<br />
The success with which coast<strong>al</strong> w<strong>et</strong>lands adjust to rising sea level in the future will depend<br />
upon wh<strong>et</strong>her human activities prevent new marsh from forming as inland areas are flooded. If<br />
human activities do not interfere, a three-foot rise in sea level would result in a n<strong>et</strong> loss of about 50<br />
percent of the marsh in the <strong>Charleston</strong> area. A five-foot rise would result in an 80 percent loss.<br />
To the extent that levees, seaw<strong>al</strong>ls, and bulkheads are built to prevent arm from being<br />
flooded as the sea rises, the formation of new marsh will be prevented. We estimate that 90<br />
percent of the marsh in <strong>Charleston</strong>-including <strong>al</strong>l of the high marsh-would be destroyed if sea level<br />
rises five fe<strong>et</strong> and w<strong>al</strong>ls are built to protect existing development.<br />
This study represents only a preliminary investigation into an area that requires substanti<strong>al</strong><br />
addition<strong>al</strong> research. The m<strong>et</strong>hods developed here can be applied to estimate marsh loss in similar<br />
areas with different tid<strong>al</strong> ranges without major addition<strong>al</strong> fieldwork. Nevertheless, more field<br />
surveys and an<strong>al</strong>ysis will be necessary to estimate probable impacts of future sea level rise on other<br />
types of w<strong>et</strong>lands.<br />
The assumptions used to predict future sea level rise and the resulting impacts on w<strong>et</strong>land<br />
loss must be refined considerably so that one can have more confidence in any policy responses<br />
that are based on these predictions. The substanti<strong>al</strong> environment<strong>al</strong> and economic resources that can<br />
be saved if b<strong>et</strong>ter predictions become available soon will easily justify the cost (though substanti<strong>al</strong>)<br />
of developing them (Titus <strong>et</strong> <strong>al</strong>. 1984). However, deferring policy planning until <strong>al</strong>l remaining<br />
uncertainties are resolved is unwise.<br />
The knowledge that has accumulated in the last twenty-five years has provided a solid<br />
foundation for expecting sea level to rise in the future. Nevertheless, most environment<strong>al</strong> policies<br />
assume that w<strong>et</strong>land ecosystems are static. Incorporating into environment<strong>al</strong> research the notion<br />
that ecosystems are dynamic need not wait until the day when we can accurately predict the<br />
magnitude of the future changes.<br />
53
NOTES<br />
1 These scenarios mere origin<strong>al</strong>ly used by <strong>Kana</strong> <strong>et</strong> <strong>al</strong>. (1984). They are based on loc<strong>al</strong> subsidence<br />
and the Hoffman <strong>et</strong> <strong>al</strong>. (1983) mid-low and mid-high scenarios. See Titus <strong>et</strong> <strong>al</strong>. (1984) for further<br />
explanation.<br />
2 Plots of the profile of each transect, showing the mod<strong>al</strong> elevations of the substrate and zonation of<br />
plant species, can be found in Appendix A of an earlier publication of this study: T. <strong>Kana</strong>, B.<br />
Baca, M. Williams, 1986, Potenti<strong>al</strong> Irnpac4 of Sea Level Rise on W<strong>et</strong>lands Around <strong>Charleston</strong>,<br />
North <strong>Carolina</strong>, U.S. Environment<strong>al</strong> Protection Agency, Washington, D.C.<br />
3 Kurz and Wagner (1957) and St<strong>al</strong>ter (1968) found lower elevation limits for S. <strong>al</strong>temit7ora growth<br />
in the <strong>Charleston</strong> area. However, we found these marshes to be highly variable and often<br />
terminated in oyster reef or steep dropoffs which precluded the growth of veg<strong>et</strong>ation. The lack of<br />
veg<strong>et</strong>ation in these areas and the inherent variability of area marshes may explain these<br />
discrepancies with earlier works.<br />
4 For budg<strong>et</strong>ary reasons, me could not rigorously c<strong>al</strong>culate areas using a computerized planim<strong>et</strong>er.<br />
This level of precision would be questionable anyway, in light of the imprecision of USGS<br />
topographic maps in delineating marshes and tid<strong>al</strong> flats near mean water levels.<br />
5 Because the standard error of a sum is less than the sum of individu<strong>al</strong> standard errors, the errors are<br />
likely to be less. Unfortunately, me had no way of rigorously testing these results within the time<br />
and budg<strong>et</strong> constraints of the project.<br />
6 The scenario referred to as "medium" in Barth and Titus is c<strong>al</strong>led "high" in this report.<br />
REFERENCES<br />
Barth, M.C., and J.G. Titus (Eds.), 1984. Greenhouse Effect and Sea Level Rise. Van Nostrand<br />
Reinhold Co., New York, N.Y., 325 pp.<br />
Boesch, D.F., D. Levin, D. Numrned<strong>al</strong>, and K. Bowles, 1983. Subsidence in Coast<strong>al</strong> Louisiana:<br />
<strong>Case</strong>s, Rates and Effects on W<strong>et</strong>lands. U.S. Fish and Wildlife Serv., Washington, D.C., FWSIOBS-<br />
83126, 30 pp.<br />
DeLaune, R.D., C.J. Smith, and W.H. Patrick, Jr., 1983. "Relationship of marsh elevation, redox<br />
potenti<strong>al</strong>, and sulfide to Sparfina <strong>al</strong>temit7ora productivity." Soil Science Amer Jow., Vol. 47, pp. 930-<br />
935. Duc, A.W., 1981. "Back barrier stratigraphy of Kiawah Island, South <strong>Carolina</strong>." Ph.D.<br />
Dissertation, Geol. Dept., University of South <strong>Carolina</strong>, Columbia, 253 pp.<br />
Ebersole, B.A., 1982. Atlantic Coast Water-level Clitnate. WES Rept. 7, U.S. Army Corps of<br />
Engineers, Waterways Experiment Station, Vicksburg, Miss., 498 pp.<br />
Gagliano, S.M., 1984. Independent reviews (comments of Sherwood Cagliano). In M.C. Barth<br />
and J.G. Titus (Eds.), Greenhouse Effect and Sea Level Rise. Van Nostrand Reinhold Co., New York,<br />
N.Y., Chap. 10, pp. 296-300.<br />
Gagliano, S.M., K.J. Meyer Arendt, and K.M. Wicker, 1981. "Land loss in the Mississippi<br />
deltaic plain." In Trans. 31st Ann. Mtg., Gulf Coast Assoc. Ceol Soc. (GCAGS), Corpus Christi,<br />
Texas, pp. 293,300.<br />
G<strong>al</strong>lagher, J.L., R.J. Reiniold, and D.E. Thompson, 1972. "Remote sensing and s<strong>al</strong>t marsh<br />
productivity." In Proc. 38th Ann. Mtg. Arner Soc. Photogramm<strong>et</strong>ry Washington, D.C., pp. 477-488.<br />
Gibbs, M.J., 1984. "Economic an<strong>al</strong>ysis of sea level rise: m<strong>et</strong>hods and results." In M.C. Barth and<br />
J.G. Titus (Eds.), Greenhouse Effect and Sea Level Rise. Van Nostrand Reinhold Co., New York,<br />
N.Y., Chap. 7, pp. 215-251.<br />
54
Hatton, R.S., R.D. DeLaune, and W.H. Patrick, 1983. "Sedimentation, accr<strong>et</strong>ion and<br />
subsidence in marshes of Barataria Basin, Louisiana." Limnol. and Oceanogr, Vol. 28, pp. 494-<br />
502. Hayes, M.O., and T.W. <strong>Kana</strong> (Eds.), 1976. 7&-?igenous Clastic Deposition<strong>al</strong> Environments,<br />
Tech. Rept. NO. 11-CRD. Coast<strong>al</strong> Research Division, Dept. Geol., Univ. South <strong>Carolina</strong>, 306<br />
pp. Hicks, S.D., H.A. DeBaugh, and L.E. Hickman, 1983. Sea Level Variations for the United<br />
States 1&5&1980. Nation<strong>al</strong> Ocean Service, U.S. Department of Commerce, Rockville,<br />
Maryland.<br />
<strong>Kana</strong>, T.W., 3. Michel, M.O. Hayes, and J.R. Jensen, 1984. "The physic<strong>al</strong> impact of sea<br />
level rise in the area of <strong>Charleston</strong>, South <strong>Carolina</strong>. In M.C. Barth and J.G. Titus (Eds.),<br />
Greenhouse Effect and Sea Level Rise. Van Nostrand Reinhold Co., New York, N.Y., Chap. 4,<br />
pp. 105-150.<br />
<strong>Kana</strong>, T.W., B.J. Baca, M.L. Williams, 1986. Potenti<strong>al</strong> Impacts of Sea Level Rise on<br />
W<strong>et</strong>lands Around <strong>Charleston</strong>, South <strong>Carolina</strong>. U.S. EPA, Washington, D.C., 62 pp.<br />
Kurz, H., and K. Wagner. 1957. Tid<strong>al</strong> Marshes of the Gulf and Atlantic Coasts of Northern<br />
Florida and <strong>Charleston</strong>, South <strong>Carolina</strong>. Florida State Univ. Stud. 24, 168 pp.<br />
Nixon, S.W., 1982. The Ecology of New England High S<strong>al</strong>t Marshes: A Community Profile.<br />
U.S. Fish and Wildlife Serv., Washington, D.C., FWS/OBS-81155, 70 pp.<br />
Nummed<strong>al</strong>, D., 1982. "Future sea level changes <strong>al</strong>ong the Louisiana coast." In D.F. Boesch<br />
(Ed.), Proc. Conf Coast<strong>al</strong> Erosion and W<strong>et</strong>land Modfification in Louisiana: Causes,<br />
Consequences and Options. U.S. Fish and Wildlife Serv., Washington, D.C., FWSIOBS-82159,<br />
pp. 164-176.<br />
Odum, E.P., and M.E. Fanning, 1973. "Comparisons of the productivity of Sp<strong>al</strong>ina<br />
<strong>al</strong>terniflora and Spartina cynosuroides in Georgia co&" marshes." Bull. Georgia Acad. Sci.,<br />
Vol. 31, pp. 1-12.<br />
Pendl<strong>et</strong>on, E.C., 1984. Person<strong>al</strong> communication. U.S. Fish and Wildlife Serv., Nation<strong>al</strong><br />
Coast<strong>al</strong> Ecosystems Team, Slidell, LA.<br />
Redfield, A.C., 1972. "Development of a New England s<strong>al</strong>t marsh." Ecol. Monogr., Vol. 42,<br />
pp. 201-237.<br />
Schubel, J.R., 1972. "The physic<strong>al</strong> and chemic<strong>al</strong> conditions of the Chesapeake Bay." Jour.<br />
Wash. Acad. Sd., Vol. 62(2), pp. 56-87.<br />
Scott, G.I., L.C. Thebeau, and T.W. <strong>Kana</strong>, 1981. "Ashley River marsh survey - Phase I."<br />
Prepared for Olde <strong>Charleston</strong> Partners; RPI, Columbia, S.C., 43 pp.<br />
South <strong>Carolina</strong> Coast<strong>al</strong> Council, 1985. Performance Report of the South <strong>Carolina</strong> Coast<strong>al</strong><br />
Management Program. South <strong>Carolina</strong> Coast<strong>al</strong> Council, Columbia, South <strong>Carolina</strong>.<br />
St<strong>al</strong>ter, R. 1968. "An ecologic<strong>al</strong> study of a South <strong>Carolina</strong> s<strong>al</strong>t marsh." Ph.D. Dissertation.<br />
Univ. South <strong>Carolina</strong>, Columbia, 62 pp.<br />
W, J.M., 1958. "Energy flow in the s<strong>al</strong>t marsh ecosystem." In Proc. S<strong>al</strong>t Marsh Conf., May.<br />
W., Univ. Georgia, pp. 101-107.<br />
Titus, J.G., T.R. Henderson, and J.M. TM, 1984. "Sea level rise and w<strong>et</strong>lands loss in the<br />
United States. Nation<strong>al</strong> W<strong>et</strong>lands Newsl<strong>et</strong>ter, Environment<strong>al</strong> Law lnst., Washington, D.C., Vol.<br />
6(5).<br />
Titus, J.G., "Sea Level Rise and W<strong>et</strong>lands Loss." In O.T. Magoon (ed.) Coast<strong>al</strong> Zone '85.<br />
American Soci<strong>et</strong>y of Civil Engineers, New York, New York, pp. 1979-1990.<br />
Titus, J.G., M.C. Barth, MJ. Gibbs, I.S. Hoffman, and M. Kenney, 1984. "An overview of the<br />
causes and effects of sea level rise." In M.C. Barth and J.G. Titus (Eds.), Greenhouse Effect and<br />
Sea Level Rise. Van Nostrand Reinhold Co., New York, N.Y., Chap. 1, pp. 1-56.<br />
Turner, R.E., 1976. "Geographic variations in s<strong>al</strong>t marsh macrophyle production: a review."<br />
Contributions in Marine Science, Vol. 10, pp. 47-48.<br />
U.S. Department of Commerce, 1979. State of South <strong>Carolina</strong> Coast<strong>al</strong> 7,one Management<br />
Program and Fin<strong>al</strong> Environment<strong>al</strong> Impact Statement. Office of Coast<strong>al</strong> Zone Management,<br />
Nation<strong>al</strong> Oceanic and Atmospheric Administration, Washington, D.C.<br />
55
U.S. Department of Commerce, 1981. "Tide tables, east coast of North and South America."<br />
NOAA, Nation<strong>al</strong> Ocean Survey, Rockville, MD., 288 pp.<br />
V<strong>al</strong>iela, I., J.M. Te<strong>al</strong>, and W.G. Deuser, 1978. "The nature of growth forms in the s<strong>al</strong>t marsh<br />
grass Spartina <strong>al</strong>temiflora. " American Natur<strong>al</strong>ist, Vol. 112(985), pp. 461-470.<br />
Ward, L.G., and D.D. Domeracki, 1978. "The stratigraphic significance of back-barrier tid<strong>al</strong><br />
channel migration." Geol. Soc. Amer, Abs. with Programs, Vol. 10(4), p. 201.<br />
Wilson, K.A., 1962. North <strong>Carolina</strong> W<strong>et</strong>lands. Their Dist7ibution and Management. North<br />
<strong>Carolina</strong> Wildlife Resources Commission, R<strong>al</strong>eigh, N.C.<br />
56