Kana et al. 1988. S. Carolina Charleston SLR Case Study
Kana et al. 1988. S. Carolina Charleston SLR Case Study
Kana et al. 1988. S. Carolina Charleston SLR Case Study

You also want an ePaper? Increase the reach of your titles
YUMPU automatically turns print PDFs into web optimized ePapers that Google loves.
level). Dikes or bulkheads would be constructed under certain protection scenarios at that elevation on<br />
the date in question to prevent further inundation.<br />
Because the results are fairly d<strong>et</strong>ailed for the five separate subareas and four protection scenarios<br />
within the <strong>Charleston</strong> case study area, m have only listed the over<strong>al</strong>l changes in Tables 2-5 and 2-6<br />
(compl<strong>et</strong>e protection and no protection, see p. 50). Results by subarea for <strong>al</strong>l four protection scenarios,<br />
given in Appendix 2-B, illustrate the variability of land, water, and w<strong>et</strong>land acreage from one subarea to<br />
another. For example, the peninsula currently has a much loner percentage of low marsh than <strong>al</strong>l other<br />
areas. Tid<strong>al</strong> flat distribution was <strong>al</strong>so variable, ranging from 3.2 percent of the Mt. Pleasant zone to 8.6<br />
percent of the Sullivans Island zone. The summary percentages given in Table 2-6 are appropriately<br />
weighted for the five subareas within the study area.<br />
Table 2-5 lists the number of acres for each elevation zone in 1980 (existing) and for the baseline,<br />
low, and high scenarios with and without structur<strong>al</strong> protection by the year 2075. The percentage of the<br />
tot<strong>al</strong> study area that a habitat covers is given in parentheses in Table 2-5 and graphic<strong>al</strong>ly presented in<br />
Figure 2-6, below. Table 2-5 indicates losses under <strong>al</strong>l scenarios with no protection for the four upper<br />
habitats and gains in area for tid<strong>al</strong> flats and water areas. For example, without protection, highland would<br />
decrease from 46.6 percent of the tot<strong>al</strong> area in 1980 to 41.7 percent in 2075 under the high scenario. This<br />
represents a loss of over 2,200 acres or 10 percent of the present highland area. Land that is now<br />
terrestri<strong>al</strong> would be transformed into transition-zone or high-marsh habitats a century from now. Under<br />
the 2075 high scenario with no protection, high and low marsh, combined, would decrease from 7,700<br />
acres to 1,535 acres-a reduction of <strong>al</strong>most 80 percent. While highland and marsh areas would decrease<br />
under the no-protection scenarios, water areas would increase dramatic<strong>al</strong>ly-from 27.4 percent to as much<br />
as 48.7 percent-under the high scenario of 2075.<br />
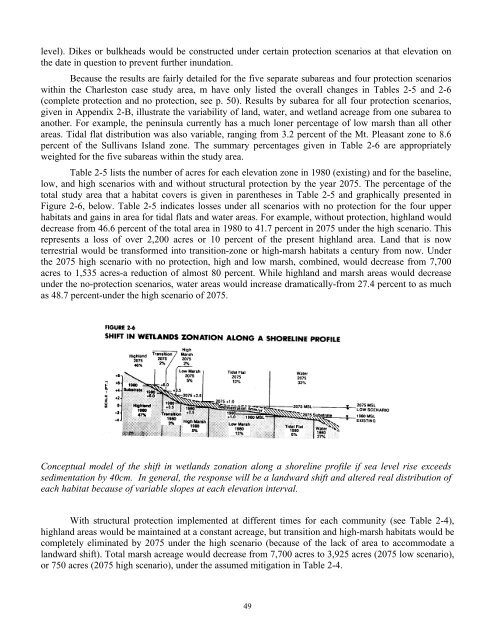
Conceptu<strong>al</strong> model of the shift in w<strong>et</strong>lands zonation <strong>al</strong>ong a shoreline profile if sea level rise exceeds<br />
sedimentation by 40cm. In gener<strong>al</strong>, the response will be a landward shift and <strong>al</strong>tered re<strong>al</strong> distribution of<br />
each habitat because of variable slopes at each elevation interv<strong>al</strong>.<br />
With structur<strong>al</strong> protection implemented at different times for each community (see Table 2-4),<br />
highland areas would be maintained at a constant acreage, but transition and high-marsh habitats would be<br />
compl<strong>et</strong>ely eliminated by 2075 under the high scenario (because of the lack of area to accommodate a<br />
landward shift). Tot<strong>al</strong> marsh acreage would decrease from 7,700 acres to 3,925 acres (2075 low scenario),<br />
or 750 acres (2075 high scenario), under the assumed mitigation in Table 2-4.<br />
49