Kana et al. 1988. S. Carolina Charleston SLR Case Study
Kana et al. 1988. S. Carolina Charleston SLR Case Study
Kana et al. 1988. S. Carolina Charleston SLR Case Study

Create successful ePaper yourself
Turn your PDF publications into a flip-book with our unique Google optimized e-Paper software.
For each transect, m measured elevation and distance from a benchmark using a rod and level.<br />
Elevations were surveyed wherever there was a noticeable break in slope or change in species. The<br />
average distance b<strong>et</strong>ween points was about 7.5 m (25 ft). Along each transect me collected and tagged<br />
samples of species for laboratory typing and verification, noting such information as the elevation of the<br />
boundaries b<strong>et</strong>ween different species. By measuring the length of the transect that a species covered and<br />
dividing it by the transect's tot<strong>al</strong> length, m computed percentages for the distribution of each species<br />
<strong>al</strong>ong a transect.<br />
Results of Individu<strong>al</strong> Transects<br />
Table 2-1 (see page 44) summarizes the results of the twelve transects. 2 It presents the princip<strong>al</strong><br />
species observed <strong>al</strong>ong each transect, their "mod<strong>al</strong>"-or most common-elevations, the percentage of each<br />
transect they covered, and the length of each transect. For example, in transect number 6, Borrichia<br />
frutescens was found at a mod<strong>al</strong> elevation of 118 cm (3-86 ft) and covered 40 percent of the transect, or<br />
about 37 m (120 ft).<br />
Because species often overlapped, the sums of the percentages exceed 100. In addition, to omit<br />
any margin<strong>al</strong> plants that exist at transition zones, a mod<strong>al</strong> elevation differs slightly from the arithm<strong>et</strong>ic or<br />
weighted mean.<br />
Composite Transect<br />
To model the scenarios of future sea level rise, me had to develop a composite transect from the<br />
data in Table 2-1. Thus, for each species, one mod<strong>al</strong> elevation was estimated from the various elevations<br />
in Table 2-1. Similarly, the percent of each transect covered by an individu<strong>al</strong> species was used to estimate<br />
an average percent coverage for <strong>al</strong>l transacts (Table 2-2, p. 45).<br />
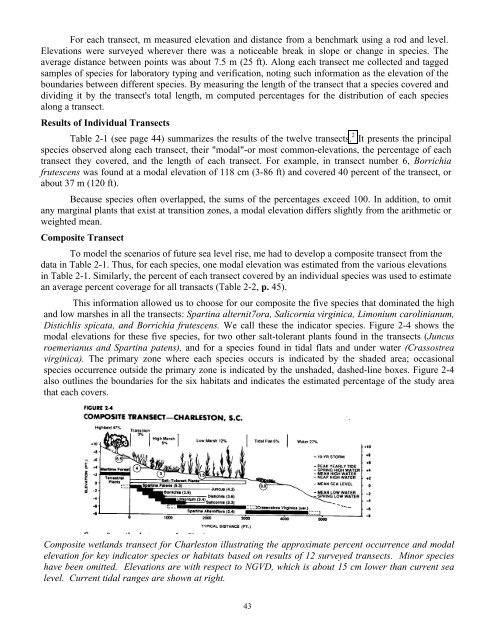
This information <strong>al</strong>lowed us to choose for our composite the five species that dominated the high<br />
and low marshes in <strong>al</strong>l the transects: Spartina <strong>al</strong>ternit7ora, S<strong>al</strong>icornia virginica, Limonium carolinianum,<br />
Distichlis spicata, and Borrichia frutescens. We c<strong>al</strong>l these the indicator species. Figure 2-4 shows the<br />
mod<strong>al</strong> elevations for these five species, for two other s<strong>al</strong>t-tolerant plants found in the transects (Juncus<br />
roemerianus and Spartina patens), and for a species found in tid<strong>al</strong> flats and under water (Crassostrea<br />
virginica). The primary zone where each species occurs is indicated by the shaded area; occasion<strong>al</strong><br />
species occurrence outside the primary zone is indicated by the unshaded, dashed-line boxes. Figure 2-4<br />
<strong>al</strong>so outlines the boundaries for the six habitats and indicates the estimated percentage of the study area<br />
that each covers.<br />
Composite w<strong>et</strong>lands transect for <strong>Charleston</strong> illustrating the approximate percent occurrence and mod<strong>al</strong><br />
elevation for key indicator species or habitats based on results of 12 surveyed transects. Minor species<br />
have been omitted. Elevations are with respect to NGVD, which is about 15 cm lower than current sea<br />
level. Current tid<strong>al</strong> ranges are shown at right.<br />
43