Kana et al. 1988. S. Carolina Charleston SLR Case Study
Kana et al. 1988. S. Carolina Charleston SLR Case Study
Kana et al. 1988. S. Carolina Charleston SLR Case Study

Create successful ePaper yourself
Turn your PDF publications into a flip-book with our unique Google optimized e-Paper software.
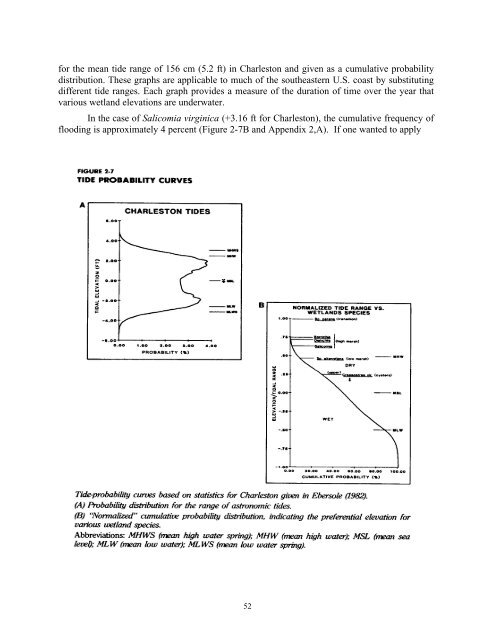
for the mean tide range of 156 cm (5.2 ft) in <strong>Charleston</strong> and given as a cumulative probability<br />
distribution. These graphs are applicable to much of the southeastern U.S. coast by substituting<br />
different tide ranges. Each graph provides a measure of the duration of time over the year that<br />
various w<strong>et</strong>land elevations are underwater.<br />
In the case of S<strong>al</strong>icomia virginica (+3.16 ft for <strong>Charleston</strong>), the cumulative frequency of<br />
flooding is approximately 4 percent (Figure 2-7B and Appendix 2,A). If one wanted to apply<br />
52