Special Eurobarometer 'European social reality'
Special Eurobarometer 'European social reality'
Special Eurobarometer 'European social reality'

You also want an ePaper? Increase the reach of your titles
YUMPU automatically turns print PDFs into web optimized ePapers that Google loves.
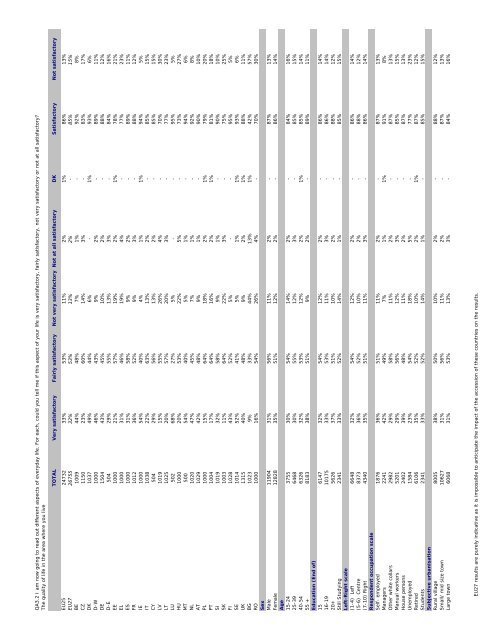
QA3.2 I am now going to read out different aspects of everyday life. For each, could you tell me if this aspect of your life is very satisfactory, fairly satisfactory, not very satisfactory or not at all satisfactory?<br />
The quality of life in the area where you live<br />
TOTAL Very satisfactory Fairly satisfactory Not very satisfactory Not at all satisfactory DK Satisfactory Not satisfactory<br />
EU25 24732 33% 53% 11% 2% 1% 86% 13%<br />
EU27 26755 32% 53% 13% 2% - 85% 15%<br />
BE 1009 44% 48% 7% 1% - 92% 8%<br />
CZ 1150 23% 60% 14% 3% - 83% 17%<br />
DK 1037 49% 44% 6% - 1% 93% 6%<br />
D-W 1000 46% 43% 9% 2% - 89% 11%<br />
DE 1504 43% 45% 10% 2% - 88% 12%<br />
D-E 504 29% 55% 13% 3% - 84% 16%<br />
EE 1000 21% 57% 19% 2% 1% 78% 21%<br />
EL 1000 31% 46% 19% 4% - 77% 23%<br />
ES 1000 31% 58% 9% 2% - 89% 11%<br />
FR 1012 36% 52% 9% 3% - 88% 12%<br />
IE 1000 54% 40% 4% 1% 1% 94% 5%<br />
IT 1038 22% 63% 13% 2% - 85% 15%<br />
CY 504 29% 56% 13% 2% - 85% 15%<br />
LV 1019 15% 55% 26% 4% - 70% 30%<br />
LT 1025 20% 57% 20% 3% - 77% 23%<br />
LU 502 68% 27% 5% - - 95% 5%<br />
HU 1000 20% 53% 22% 5% - 73% 27%<br />
MT 500 54% 40% 5% 1% - 94% 6%<br />
NL 1020 47% 45% 7% 1% - 92% 8%<br />
AT 1029 42% 48% 9% 1% - 90% 10%<br />
PL 1000 15% 64% 18% 2% 1% 79% 20%<br />
PT 1004 17% 64% 16% 2% 1% 81% 18%<br />
SI 1019 32% 58% 9% 1% - 90% 10%<br />
SK 1003 11% 64% 22% 3% - 75% 25%<br />
FI 1028 43% 52% 5% - - 95% 5%<br />
SE 1014 52% 41% 5% 1% 1% 93% 6%<br />
UK 1315 40% 48% 9% 2% 1% 88% 11%<br />
BG 1023 9% 33% 44% 13% 1% 42% 57%<br />
RO 1000 16% 54% 26% 4% - 70% 30%<br />
Sex<br />
Male 11904 31% 56% 11% 2% - 87% 13%<br />
Female 12828 35% 51% 12% 2% - 86% 14%<br />
Age<br />
15-24 3755 30% 54% 14% 2% - 84% 16%<br />
25-39 6468 30% 55% 12% 3% - 85% 15%<br />
40-54 6326 32% 53% 12% 2% 1% 85% 14%<br />
55 + 8183 38% 51% 9% 2% - 89% 11%<br />
Education (End of)<br />
15 6147 32% 54% 12% 2% - 86% 14%<br />
16-19 10175 33% 53% 11% 3% - 86% 14%<br />
20+ 5626 37% 51% 10% 2% - 88% 12%<br />
Still Studying 2341 33% 52% 14% 1% - 85% 15%<br />
Left-Right scale<br />
(1-4) Left 6648 32% 54% 12% 2% - 86% 14%<br />
(5-6) Centre 8373 36% 52% 10% 2% - 88% 12%<br />
(7-10) Right 4340 35% 51% 11% 3% - 86% 14%<br />
Respondent occupation scale<br />
Self- employed 1876 36% 51% 11% 2% - 87% 13%<br />
Managers 2241 42% 49% 7% 1% 1% 91% 8%<br />
Other white collars 2982 29% 58% 11% 2% - 87% 13%<br />
Manual workers 5201 29% 56% 12% 3% - 85% 15%<br />
House persons 2402 39% 48% 11% 2% - 87% 13%<br />
Unemployed 1584 23% 54% 18% 5% - 77% 23%<br />
Retired 6106 35% 52% 10% 2% 1% 87% 12%<br />
Students 2341 33% 52% 14% 1% - 85% 15%<br />
Subjective urbanisation<br />
Rural village 8005 38% 50% 10% 2% - 88% 12%<br />
Small/ mid size town 10627 31% 56% 11% 2% - 87% 13%<br />
Large town 6068 31% 53% 13% 3% - 84% 16%<br />
EU27 results are purely indicative as it is impossible to anticipate the impact of the accession of these countries on the results.