Special Eurobarometer 'European social reality'
Special Eurobarometer 'European social reality'
Special Eurobarometer 'European social reality'

Create successful ePaper yourself
Turn your PDF publications into a flip-book with our unique Google optimized e-Paper software.
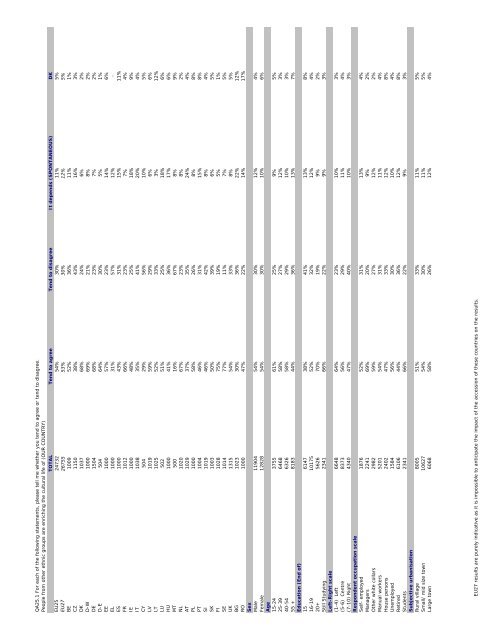
QA25.1 For each of the following statements, please tell me whether you tend to agree or tend to disagree.<br />
People from other ethnic groups are enriching the cultural life of (OUR COUNTRY)<br />
TOTAL Tend to agree Tend to disagree It depends (SPONTANEOUS) DK<br />
EU25 24732 54% 30% 11% 5%<br />
EU27 26755 53% 30% 12% 5%<br />
BE 1009 52% 36% 11% 1%<br />
CZ 1150 38% 43% 16% 3%<br />
DK 1037 68% 24% 6% 2%<br />
D-W 1000 69% 21% 8% 2%<br />
DE 1504 68% 23% 7% 2%<br />
D-E 504 64% 30% 5% 1%<br />
EE 1000 57% 23% 14% 6%<br />
EL 1000 31% 57% 12% -<br />
ES 1000 43% 31% 15% 11%<br />
FR 1012 66% 23% 7% 4%<br />
IE 1000 48% 25% 18% 9%<br />
IT 1038 35% 41% 20% 4%<br />
CY 504 29% 56% 10% 5%<br />
LV 1019 59% 29% 6% 6%<br />
LT 1025 52% 33% 3% 12%<br />
LU 502 51% 25% 18% 6%<br />
HU 1000 41% 36% 17% 6%<br />
MT 500 16% 67% 8% 9%<br />
NL 1020 67% 23% 8% 2%<br />
AT 1029 37% 35% 24% 4%<br />
PL 1000 58% 26% 8% 8%<br />
PT 1004 46% 31% 15% 8%<br />
SI 1019 46% 42% 8% 4%<br />
SK 1003 50% 39% 6% 5%<br />
FI 1028 75% 19% 5% 1%<br />
SE 1014 77% 11% 7% 5%<br />
UK 1315 54% 33% 8% 5%<br />
BG 1023 30% 36% 22% 12%<br />
RO 1000 47% 22% 14% 17%<br />
Sex<br />
Male 11904 54% 30% 12% 4%<br />
Female 12828 54% 30% 10% 6%<br />
Age<br />
15-24 3755 61% 25% 9% 5%<br />
25-39 6468 58% 27% 12% 3%<br />
40-54 6326 58% 29% 10% 3%<br />
55 + 8183 44% 36% 13% 7%<br />
Education (End of)<br />
15 6147 38% 41% 13% 8%<br />
16-19 10175 52% 32% 12% 4%<br />
20+ 5626 70% 19% 9% 2%<br />
Still Studying 2341 66% 22% 9% 3%<br />
Left-Right scale<br />
(1-4) Left 6648 64% 23% 10% 3%<br />
(5-6) Centre 8373 56% 29% 11% 4%<br />
(7-10) Right 4340 47% 40% 10% 3%<br />
Respondent occupation scale<br />
Self- employed 1876 52% 31% 13% 4%<br />
Managers 2241 69% 20% 9% 2%<br />
Other white collars 2982 59% 27% 12% 2%<br />
Manual workers 5201 54% 31% 11% 4%<br />
House persons 2402 47% 33% 12% 8%<br />
Unemployed 1584 56% 30% 10% 4%<br />
Retired 6106 44% 36% 12% 8%<br />
Students 2341 66% 22% 9% 3%<br />
Subjective urbanisation<br />
Rural village 8005 51% 33% 11% 5%<br />
Small/ mid size town 10627 54% 30% 11% 5%<br />
Large town 6068 58% 26% 12% 4%<br />
EU27 results are purely indicative as it is impossible to anticipate the impact of the accession of these countries on the results.