Special Eurobarometer 'European social reality'
Special Eurobarometer 'European social reality'
Special Eurobarometer 'European social reality'

You also want an ePaper? Increase the reach of your titles
YUMPU automatically turns print PDFs into web optimized ePapers that Google loves.
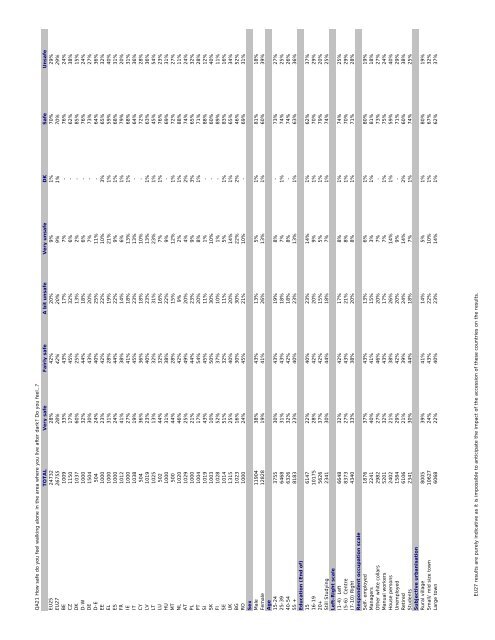
QA21 How safe do you feel walking alone in the area where you live after dark? Do you feel…?<br />
TOTAL Very safe Fairly safe A bit unsafe Very unsafe DK Safe Unsafe<br />
EU25 24732 28% 42% 20% 9% 1% 70% 29%<br />
EU27 26755 28% 42% 20% 9% 1% 70% 29%<br />
BE 1009 33% 43% 17% 7% - 76% 24%<br />
CZ 1150 17% 45% 32% 6% - 62% 38%<br />
DK 1037 60% 25% 13% 2% - 85% 15%<br />
D-W 1000 32% 44% 18% 6% - 76% 24%<br />
DE 1504 30% 43% 20% 7% - 73% 27%<br />
D-E 504 24% 40% 25% 11% - 64% 36%<br />
EE 1000 23% 42% 22% 10% 3% 65% 32%<br />
EL 1000 31% 28% 19% 21% 1% 59% 40%<br />
ES 1000 24% 44% 22% 9% 1% 68% 31%<br />
FR 1012 41% 38% 14% 6% 1% 79% 20%<br />
IE 1000 27% 41% 18% 13% 1% 68% 31%<br />
IT 1038 19% 45% 23% 13% - 64% 36%<br />
CY 504 36% 36% 18% 10% - 72% 28%<br />
LV 1019 23% 40% 23% 13% 1% 63% 36%<br />
LT 1025 13% 32% 31% 23% 1% 45% 54%<br />
LU 502 44% 32% 16% 7% 1% 76% 23%<br />
HU 1000 31% 38% 22% 9% - 69% 31%<br />
MT 500 44% 28% 15% 12% 1% 72% 27%<br />
NL 1020 46% 42% 9% 2% 1% 88% 11%<br />
AT 1029 25% 49% 20% 4% 2% 74% 24%<br />
PL 1000 21% 44% 23% 9% 3% 65% 32%<br />
PT 1004 17% 54% 20% 8% 1% 71% 28%<br />
SI 1019 43% 45% 11% 1% - 88% 12%<br />
SK 1003 10% 50% 30% 10% - 60% 40%<br />
FI 1028 52% 37% 10% 1% - 89% 11%<br />
SE 1014 51% 32% 11% 5% 1% 83% 16%<br />
UK 1315 25% 40% 20% 14% 1% 65% 34%<br />
BG 1023 16% 30% 30% 22% 2% 46% 52%<br />
RO 1000 24% 45% 21% 10% - 69% 31%<br />
Sex<br />
Male 11904 38% 43% 13% 5% 1% 81% 18%<br />
Female 12828 19% 41% 26% 13% 1% 60% 39%<br />
Age<br />
15-24 3755 30% 43% 19% 8% - 73% 27%<br />
25-39 6468 31% 43% 18% 7% 1% 74% 25%<br />
40-54 6326 32% 42% 18% 8% - 74% 26%<br />
55 + 8183 23% 40% 23% 13% 1% 63% 36%<br />
Education (End of)<br />
15 6147 22% 40% 23% 14% 1% 62% 37%<br />
16-19 10175 28% 42% 20% 9% 1% 70% 29%<br />
20+ 5626 37% 42% 15% 5% 1% 79% 20%<br />
Still Studying 2341 30% 44% 18% 7% 1% 74% 25%<br />
Left-Right scale<br />
(1-4) Left 6648 32% 42% 17% 8% 1% 74% 25%<br />
(5-6) Centre 8373 27% 43% 21% 8% 1% 70% 29%<br />
(7-10) Right 4340 33% 38% 20% 8% 1% 71% 28%<br />
Respondent occupation scale<br />
Self- employed 1876 37% 43% 13% 6% 1% 80% 19%<br />
Managers 2241 40% 41% 15% 3% 1% 81% 18%<br />
Other white collars 2982 27% 46% 20% 7% - 73% 27%<br />
Manual workers 5201 32% 43% 17% 7% 1% 75% 24%<br />
House persons 2402 21% 38% 26% 14% 1% 59% 40%<br />
Unemployed 1584 29% 42% 20% 9% - 71% 29%<br />
Retired 6106 21% 39% 24% 14% 2% 60% 38%<br />
Students 2341 30% 44% 18% 7% 1% 74% 25%<br />
Subjective urbanisation<br />
Rural village 8005 39% 41% 14% 5% 1% 80% 19%<br />
Small/ mid size town 10627 24% 43% 22% 10% 1% 67% 32%<br />
Large town 6068 22% 40% 23% 14% 1% 62% 37%<br />
EU27 results are purely indicative as it is impossible to anticipate the impact of the accession of these countries on the results.