Special Eurobarometer 'European social reality'
Special Eurobarometer 'European social reality'
Special Eurobarometer 'European social reality'

Create successful ePaper yourself
Turn your PDF publications into a flip-book with our unique Google optimized e-Paper software.
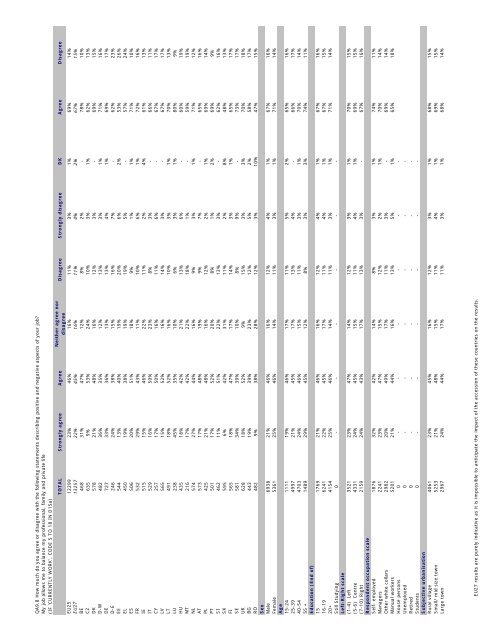
QA9.8 How much do you agree or disagree with the following statements describing positive and negative aspects of your job?<br />
My job allows me to balance my professional, family and private life<br />
(IF 'CURRENTLY WORK', CODE 5 TO 18 IN D15a)<br />
Neither agree nor<br />
TOTAL Strongly agree Agree<br />
Disagree Strongly disagree DK Agree Disagree<br />
disagree<br />
EU25 12299 23% 46% 16% 11% 3% 1% 69% 14%<br />
EU27 13257 22% 45% 16% 11% 4% 2% 67% 15%<br />
BE 468 31% 47% 12% 8% 2% - 78% 10%<br />
CZ 635 9% 53% 24% 10% 3% 1% 62% 13%<br />
DK 578 21% 48% 16% 12% 3% - 69% 15%<br />
D-W 482 36% 35% 12% 13% 3% 1% 71% 16%<br />
DE 727 33% 36% 13% 13% 4% 1% 69% 17%<br />
D-E 246 24% 38% 15% 16% 7% - 62% 23%<br />
EE 544 13% 40% 19% 20% 6% 2% 53% 26%<br />
EL 450 19% 38% 19% 19% 5% - 57% 24%<br />
ES 506 20% 51% 18% 9% 1% 1% 71% 10%<br />
FR 532 29% 43% 11% 10% 6% 1% 72% 16%<br />
IE 515 15% 46% 22% 11% 2% 4% 61% 13%<br />
IT 529 16% 50% 23% 8% 3% - 66% 11%<br />
CY 257 17% 50% 16% 11% 6% - 67% 17%<br />
LV 565 15% 52% 16% 14% 3% - 67% 17%<br />
LT 491 18% 52% 16% 10% 3% 1% 70% 13%<br />
LU 238 45% 35% 10% 6% 3% 1% 80% 9%<br />
HU 435 18% 42% 21% 13% 6% - 60% 19%<br />
MT 216 17% 42% 22% 18% 1% - 59% 19%<br />
NL 574 27% 44% 16% 9% 3% 1% 71% 12%<br />
AT 573 17% 48% 19% 9% 7% - 65% 16%<br />
PL 425 21% 48% 16% 12% 2% 1% 69% 14%<br />
PT 501 17% 52% 20% 8% 1% 2% 69% 9%<br />
SI 462 11% 51% 22% 13% 3% - 62% 16%<br />
SK 595 6% 42% 31% 11% 2% 8% 48% 13%<br />
FI 565 18% 47% 17% 14% 3% 1% 65% 17%<br />
SE 581 34% 39% 10% 8% 9% - 73% 17%<br />
UK 628 18% 52% 9% 15% 3% 3% 70% 18%<br />
BG 443 19% 39% 23% 12% 5% 2% 58% 17%<br />
RO 482 9% 38% 28% 12% 3% 10% 47% 15%<br />
Sex<br />
Male 6938 21% 46% 16% 12% 4% 1% 67% 16%<br />
Female 5361 25% 46% 14% 11% 3% 1% 71% 14%<br />
Age<br />
15-24 1111 19% 46% 17% 11% 5% 2% 65% 16%<br />
25-39 4997 21% 45% 17% 13% 4% - 66% 17%<br />
40-54 4703 24% 46% 15% 11% 3% 1% 70% 14%<br />
55 + 1489 29% 45% 12% 8% 3% 3% 74% 11%<br />
Education (End of)<br />
15 1769 21% 46% 16% 12% 4% 1% 67% 16%<br />
16-19 6241 22% 45% 17% 11% 4% 1% 67% 15%<br />
20+ 4154 25% 46% 14% 11% 3% 1% 71% 14%<br />
Still Studying 0 - - - - - -<br />
Left-Right scale<br />
(1-4) Left 3521 23% 47% 14% 12% 3% 1% 70% 15%<br />
(5-6) Centre 4331 24% 45% 15% 11% 4% 1% 69% 15%<br />
(7-10) Right 2159 24% 43% 17% 13% 3% - 67% 16%<br />
Respondent occupation scale<br />
Self- employed 1876 32% 42% 14% 8% 3% 1% 74% 11%<br />
Managers 2241 23% 47% 15% 12% 2% 1% 70% 14%<br />
Other white collars 2982 20% 49% 17% 11% 3% - 69% 14%<br />
Manual workers 5201 21% 44% 16% 13% 5% 1% 65% 18%<br />
House persons 0 - - - - - -<br />
Unemployed 0 - - - - - -<br />
Retired 0 - - - - - -<br />
Students 0 - - - - - -<br />
Subjective urbanisation<br />
Rural village 4061 23% 45% 16% 12% 3% 1% 68% 15%<br />
Small/ mid size town 5253 21% 48% 15% 11% 4% 1% 69% 15%<br />
Large town 2967 24% 44% 17% 11% 3% 1% 68% 14%<br />
EU27 results are purely indicative as it is impossible to anticipate the impact of the accession of these countries on the results.