Special Eurobarometer 'European social reality'
Special Eurobarometer 'European social reality'
Special Eurobarometer 'European social reality'

You also want an ePaper? Increase the reach of your titles
YUMPU automatically turns print PDFs into web optimized ePapers that Google loves.
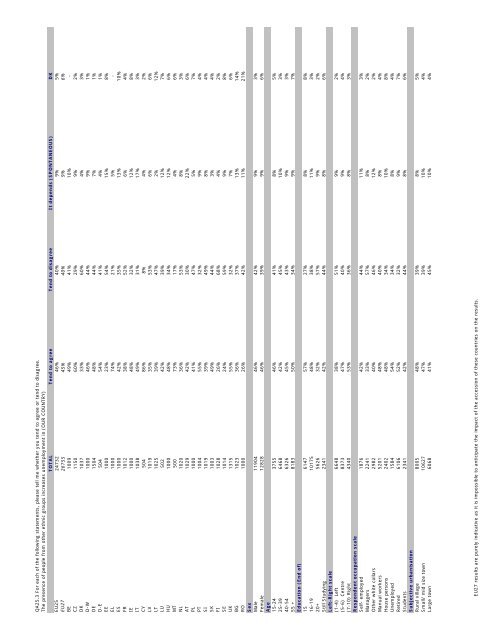
QA25.3 For each of the following statements, please tell me whether you tend to agree or tend to disagree.<br />
The presence of people from other ethnic groups increases unemployment in (OUR COUNTRY)<br />
TOTAL Tend to agree Tend to disagree It depends (SPONTANEOUS) DK<br />
EU25 24732 46% 40% 9% 5%<br />
EU27 26755 45% 40% 9% 6%<br />
BE 1009 49% 41% 10% -<br />
CZ 1150 60% 29% 9% 2%<br />
DK 1037 33% 60% 4% 3%<br />
D-W 1000 46% 44% 9% 1%<br />
DE 1504 48% 44% 7% 1%<br />
D-E 504 54% 41% 4% 1%<br />
EE 1000 23% 54% 15% 8%<br />
EL 1000 74% 21% 5% -<br />
ES 1000 42% 35% 13% 10%<br />
FR 1012 38% 52% 6% 4%<br />
IE 1000 48% 32% 12% 8%<br />
IT 1038 49% 31% 17% 3%<br />
CY 504 86% 8% 4% 2%<br />
LV 1019 35% 53% 6% 6%<br />
LT 1025 39% 47% 2% 12%<br />
LU 502 42% 39% 12% 7%<br />
HU 1000 48% 34% 12% 6%<br />
MT 500 73% 17% 4% 6%<br />
NL 1020 36% 53% 8% 3%<br />
AT 1029 42% 30% 22% 6%<br />
PL 1000 41% 47% 5% 7%<br />
PT 1004 55% 32% 9% 4%<br />
SI 1019 39% 49% 8% 4%<br />
SK 1003 49% 44% 3% 4%<br />
FI 1028 26% 68% 4% 2%<br />
SE 1014 24% 59% 9% 8%<br />
UK 1315 55% 32% 7% 6%<br />
BG 1023 36% 37% 13% 14%<br />
RO 1000 26% 42% 11% 21%<br />
Sex<br />
Male 11904 46% 42% 9% 3%<br />
Female 12828 46% 39% 9% 6%<br />
Age<br />
15-24 3755 46% 41% 8% 5%<br />
25-39 6468 42% 45% 10% 3%<br />
40-54 6326 45% 43% 9% 3%<br />
55 + 8183 50% 34% 9% 7%<br />
Education (End of)<br />
15 6147 57% 27% 8% 8%<br />
16-19 10175 48% 38% 11% 3%<br />
20+ 5626 32% 57% 9% 2%<br />
Still Studying 2341 42% 44% 8% 6%<br />
Left-Right scale<br />
(1-4) Left 6648 38% 51% 9% 2%<br />
(5-6) Centre 8373 47% 40% 9% 4%<br />
(7-10) Right 4340 53% 36% 8% 3%<br />
Respondent occupation scale<br />
Self- employed 1876 42% 44% 11% 3%<br />
Managers 2241 33% 57% 8% 2%<br />
Other white collars 2982 40% 46% 12% 2%<br />
Manual workers 5201 48% 40% 8% 4%<br />
House persons 2402 48% 34% 10% 8%<br />
Unemployed 1584 54% 34% 8% 4%<br />
Retired 6106 52% 32% 9% 7%<br />
Students 2341 42% 44% 8% 6%<br />
Subjective urbanisation<br />
Rural village 8005 48% 39% 8% 5%<br />
Small/ mid size town 10627 47% 39% 10% 4%<br />
Large town 6068 41% 45% 10% 4%<br />
EU27 results are purely indicative as it is impossible to anticipate the impact of the accession of these countries on the results.