EMN 2008-2009 Overview - Réseau Européen de la Microfinance
EMN 2008-2009 Overview - Réseau Européen de la Microfinance
EMN 2008-2009 Overview - Réseau Européen de la Microfinance

Create successful ePaper yourself
Turn your PDF publications into a flip-book with our unique Google optimized e-Paper software.
<strong>EMN</strong> Working Paper nº 6<br />
<strong>2008</strong>-<strong>2009</strong><br />
<strong>Overview</strong><br />
of the Microcredit Sector<br />
in the European Union<br />
Bárbara Jayo<br />
Anabel González<br />
Casey Conzett<br />
Fundación Nantik Lum<br />
June, 2010
© European <strong>Microfinance</strong> Network. This publication is for personal informational purposes only. All rights<br />
reserved. No part of this publication may be used for commercial purposes, altered or published in any<br />
manner or form without prior permission from the publisher and <strong>EMN</strong>.<br />
This publication is supported un<strong>de</strong>r the European Community Programme for Employment and Social Solidarity (2007-2013). This<br />
programme is managed by the Directorate-General for Employment, Social Affairs and Equal Opportunities of the European Commission.<br />
It was established to financially support the implementation of the objectives of the European Union in the employment and social affairs<br />
area, as set out in the Social Agenda, and thereby contribute to the achievement of the Lisbon Strategy goals in these fields.<br />
The seven-year Programme targets all stakehol<strong>de</strong>rs who can help shape the <strong>de</strong>velopment of appropriate and effective employment and<br />
social legis<strong>la</strong>tion and policies, across the EU-27, EFTA-EEA and EU candidate and pre-candidate countries.<br />
The mission of PROGRESS is to strengthen the EU contribution in support of Member States’ commitments and efforts to create more<br />
and better jobs and to build a more cohesive society. To that effect, PROGRESS will be instrumental in::<br />
• providing analysis and policy advice on PROGRESS policy areas;<br />
• monitoring and reporting on the implementation of EU legis<strong>la</strong>tion and policies in PROGRESS policy areas;<br />
• promoting policy transfer, learning and support among Member States on EU objectives and priorities; and<br />
• re<strong>la</strong>ying the views of the stakehol<strong>de</strong>rs and society at <strong>la</strong>rge.<br />
Sole responsibility lies within the authors and the Commission is not responsible for any use that may be ma<strong>de</strong><br />
of the information contained therein.
<strong>EMN</strong> Working Paper nº 6<br />
<strong>2008</strong>-<strong>2009</strong><br />
<strong>Overview</strong><br />
of the Microcredit Sector<br />
in the European Union<br />
Authors<br />
Bárbara Jayo<br />
Anabel González<br />
Casey Conzett<br />
Col<strong>la</strong>borators<br />
Stefanie Lämmermann<br />
Silvia Rico<br />
Maricruz Lacalle<br />
Alex Stein<br />
Philippe Guichandut<br />
June, 2010
1<br />
2<br />
3<br />
4<br />
5<br />
6<br />
7<br />
Table of contents<br />
Acknowledgements<br />
07<br />
Executive Summary<br />
09<br />
Introduction<br />
11<br />
Methodology<br />
13<br />
Sector Characteristics<br />
17<br />
3.1 Country Base<br />
17<br />
3.2 Scale<br />
17<br />
3.3 Growth<br />
22<br />
3.4 Actors<br />
24<br />
Institutional Types<br />
Microlending as a Proportion<br />
24<br />
of Activity Portfolio<br />
25<br />
Age<br />
29<br />
Staff<br />
30<br />
Clients<br />
4.1 Bankable<br />
31<br />
and unbankable clients 31<br />
4.2 Businesses Targeted 31<br />
4.3 Client Targeting<br />
31<br />
Gen<strong>de</strong>r Ba<strong>la</strong>nce<br />
33<br />
Immigrants and ethnic minorities 35<br />
Youth<br />
36<br />
4.4 Marketing<br />
39<br />
Products and Services<br />
40<br />
5.1 Loan terms<br />
40<br />
5.2 Interest rates<br />
41<br />
5.3 Loan Fees<br />
42<br />
5.4 Guarantees<br />
43<br />
5.5 Loan size<br />
5.6 Loan Decision<br />
43<br />
Making Criteria<br />
45<br />
5.7 Lending Methodology<br />
5.8 Business Development<br />
45<br />
Services (BDS)<br />
46<br />
5.9 Other Financial Services 46<br />
Information Technology (IT) 48<br />
6.1 Type of IT System Used 48<br />
6.2 Rating<br />
49<br />
6.3 Cost<br />
49<br />
Social Performance<br />
50<br />
7.1 Mission<br />
50<br />
7.2 Impact<br />
51<br />
8<br />
9<br />
10<br />
11<br />
12<br />
13<br />
14<br />
15<br />
16<br />
17<br />
Operational Performance<br />
8.1 Operational<br />
Self-Sufficiency rate<br />
8.2 Current Recovery Rate<br />
8.3 Portfolio at Risk<br />
8.4 Write-offs<br />
8.5 Refinancing Ratio<br />
8.6 Debt / Equity Ratio<br />
8.7 Portfolio Yield<br />
8.8 Operating Ratio<br />
Funding<br />
9.1 Operational<br />
and Financial Costs<br />
9.2 Loan Capital<br />
Regu<strong>la</strong>tion and Networking<br />
10.1 Legal Environment<br />
10.2 Networking<br />
Crisis<br />
11.1 Institutional Impact<br />
11.2 Client Impact<br />
Future<br />
12.1 Growth<br />
12.2 Challenges<br />
54<br />
54<br />
56<br />
57<br />
58<br />
59<br />
60<br />
60<br />
61<br />
62<br />
62<br />
63<br />
64<br />
64<br />
65<br />
68<br />
69<br />
70<br />
71<br />
71<br />
72<br />
Conclusion<br />
73<br />
Country Summaries<br />
76<br />
Belgium<br />
76<br />
Bulgaria<br />
78<br />
France<br />
80<br />
Germany<br />
82<br />
Hungary<br />
84<br />
Italy<br />
86<br />
Portugal<br />
88<br />
Romania<br />
90<br />
Spain<br />
92<br />
Swe<strong>de</strong>n<br />
94<br />
The Nether<strong>la</strong>nds<br />
96<br />
United Kingdom<br />
98<br />
Summary of Data<br />
100<br />
Bibliography<br />
104<br />
Appendix Survey Participants 106<br />
5
<strong>EMN</strong> <strong>2008</strong>-<strong>2009</strong> <strong>Overview</strong><br />
6
The <strong>2008</strong> and <strong>2009</strong> <strong>EMN</strong> Survey was <strong>la</strong>unched by the Fundación Nantik Lum team<br />
on behalf of the European <strong>Microfinance</strong> Network (<strong>EMN</strong>). Fundación Nantik Lum<br />
is a member of <strong>EMN</strong> and has been appointed as coordinator of the <strong>EMN</strong> Research<br />
Working Group for the periods 2007-<strong>2008</strong> and <strong>2009</strong>-2011; the <strong>la</strong>tter period coinci<strong>de</strong>s<br />
with the strategic p<strong>la</strong>n of the Research Working Group.<br />
<strong>EMN</strong> and Fundación Nantik Lum would like to extend their appreciation to the individuals<br />
and agencies that col<strong>la</strong>borated in the distribution of survey questionnaires and collection of<br />
survey data in Belgium, Bulgaria, Fin<strong>la</strong>nd, France, Germany, Hungary, Italy, the Nether<strong>la</strong>nds,<br />
Norway, Po<strong>la</strong>nd, Romania, Swe<strong>de</strong>n, Switzer<strong>la</strong>nd and the United Kingdom. The high response<br />
rate to this edition of the sector survey is due to their efforts, for which <strong>EMN</strong> and Fundación<br />
Nantik Lum are grateful.<br />
Andreas Wou<strong>de</strong>nberg<br />
INHol<strong>la</strong>nd University of applied sciences,<br />
Center for <strong>Microfinance</strong> and Small Business Development, the Nether<strong>la</strong>nds.<br />
Aurelie Dagneaux and Olivier Jérusalmy<br />
<strong>Réseau</strong> Financement Alternatif ASBL (RFA), Belgium.<br />
Brigitte Maas<br />
Deutsches Mikrofinanz Institut (DMI), Germany.<br />
István Kovács<br />
Hungarian <strong>Microfinance</strong> Network (HMN), Hungary.<br />
Joyce Kimwaga Lundin<br />
Nätverk för Entreprenörer från Etniska Minoriteter (NEEM), Swe<strong>de</strong>n<br />
Maria Cristina Negro and Fabrizio Botti<br />
Giordano Dell’Amore Foundation (FGDA), Italy.<br />
Maria Doiciu<br />
EUROM Consultancy, Romania<br />
Acknowledgements<br />
Niko<strong>la</strong>y Yarmov<br />
Centre for Entrepreneurship and Executive Development (CEED), Bulgaria.<br />
Veronika Thiel<br />
In<strong>de</strong>pen<strong>de</strong>nt <strong>Microfinance</strong> Consultant and Director of the Centre for Responsible Credit,<br />
United Kingdom.<br />
<strong>EMN</strong> and Fundación Nantik Lum would also like to thank the participating cdfa members<br />
for allowing us to use the information collected by the cdfa in <strong>2009</strong> for the <strong>EMN</strong> survey. We<br />
appreciate your col<strong>la</strong>boration.<br />
The Fundación Nantik Lum would particu<strong>la</strong>rly like to give special thanks to <strong>EMN</strong>,<br />
particu<strong>la</strong>rly Stefanie Lämmermann and Philippe Guichandut as well as Silvia Rico, Maricruz<br />
Lacalle and Alex Stein for their col<strong>la</strong>boration and contributions.<br />
Bárbara Jayo<br />
Anabel González<br />
Casey Conzett<br />
Nantik Lum Foundation<br />
June, 2010<br />
7
<strong>EMN</strong> <strong>2008</strong>-<strong>2009</strong> <strong>Overview</strong><br />
8
Executive Summary<br />
This edition of the <strong>EMN</strong> microfinance sector survey will be the first of its kind to<br />
analyse the impact of the economic and financial crisis on the microfinance sector<br />
in Europe. In spite of the recent slowdown and contrary to the mainstream finance<br />
sector, the microfinance sector has continued to grow. The sector continues to be<br />
diverse; however, most len<strong>de</strong>rs are using microcredit as a tool for microenterprise promotion,<br />
the creation of jobs, as well as for social and financial inclusion. One new <strong>de</strong>velopment in the<br />
current edition of the survey is the introduction of “personal microcredit” in the microfinance<br />
market, a loan to those exclu<strong>de</strong>d from the traditional financial system with the goal of covering<br />
basic necessities, such as rent, emergencies, education, and other needs.<br />
This fourth sector survey covers the years <strong>2008</strong> and <strong>2009</strong> with data from 170 microfinance<br />
actors operating in 21 countries from the European Union (EU) 27, current EU candidate<br />
country Croatia and countries belonging to the European Free Tra<strong>de</strong> Area (EFTA). The<br />
survey used the accepted <strong>de</strong>finition of microloans as loans of 25,000 euros or less ma<strong>de</strong> to<br />
microenterprises or businesses with nine or fewer employees. Nevertheless, some EU len<strong>de</strong>rs<br />
have reported loans for higher amounts and have been inclu<strong>de</strong>d in the report to give a better<br />
picture on how microcredit is being used by their main provi<strong>de</strong>rs. These were specific loans<br />
and did not represent their overall lending practices.<br />
For the first time since the survey began, the number of microloans disbursed suffered a<br />
negative growth rate of -7% between the years <strong>2008</strong> and <strong>2009</strong>. This is in stark contrast to the<br />
positive growth rates experienced in 2006-2007 of 14% (<strong>EMN</strong>, <strong>2008</strong>), in 2004-2005 1 where the<br />
growth rate was 15% and in years 2003-2004 where the growth rate was 11% (<strong>EMN</strong>, 2006; nef,<br />
2005). The economic and financial crisis could be responsible for the reversal of this trend.<br />
Institutions seem to be more concerned with portfolio quality than about growth. As the<br />
number of total loans disbursed has <strong>de</strong>creased and the overall value of loans disbursed has<br />
increased, institutions may be targeting a different sector of the popu<strong>la</strong>tion, as clients graduate<br />
from one financial stratum to the next.<br />
The microfinance market in Western Europe is predominated by NGOs and microfinance<br />
associations, followed by non-banking financial institutions. This might be because of the <strong>la</strong>ck<br />
of regu<strong>la</strong>tion of the sector in Western Europe. However, in Eastern Europe where for-profit<br />
organizations, credit unions and non-bank financial institutions are regu<strong>la</strong>ted and can provi<strong>de</strong><br />
credits as well as accept <strong>de</strong>posits, these types of institutions are more common. Most len<strong>de</strong>rs<br />
are geographically limited to their local or national area and distribute fewer than 50 loans<br />
per year.<br />
Twenty-four percent of respon<strong>de</strong>nts, mostly non-bank financial institutions, are involved<br />
solely in microlending, compared to 28% in 2006 and 16% in 2005 (<strong>EMN</strong>, <strong>2008</strong>). The remaining<br />
76% of respon<strong>de</strong>nts are <strong>de</strong>dicated to other complementary activities. This number has<br />
changed re<strong>la</strong>tively little from the previous survey to the current edition. The remaining 76% of<br />
respon<strong>de</strong>nts carry out a number of other activities which focus on business <strong>de</strong>velopment and<br />
employment re<strong>la</strong>ted services. Many institutions cross-sell financial services such as insurance<br />
or mortgages to current microfinance clients.<br />
In Eastern EU countries, more than fifty percent of institutions began lending between 1980<br />
and 1996, while in Western EU countries the percentage of institutions that began disbursing<br />
during the same time period is around 15%. This means that the sector in Eastern Europe is<br />
more mature than in Western Europe.<br />
In the Eastern countries (Bulgaria, Croatia, Estonia, Hungary, Latvia, Lithuania, Po<strong>la</strong>nd and<br />
Romania), the total number of loans disbursed was 18,293, for the equivalent of 307 million<br />
euros, whereas in the Western countries (Belgium, Fin<strong>la</strong>nd, France, Germany, Ire<strong>la</strong>nd, Italy, the<br />
Nether<strong>la</strong>nds, Norway, Portugal, Spain, Swe<strong>de</strong>n, Switzer<strong>la</strong>nd and United Kingdom), the total<br />
number of loans disbursed came to 51,027, equivalent to 477 million euros. Eastern countries<br />
represent 26% of total loans and 40% of total value, whereas Western countries represent 74%<br />
of total loans and 60% of total value. Institutions that disbursed the greatest number of loans in<br />
1 The 2004-2005 <strong>EMN</strong> survey covered the EU-15, Norway and Switzer<strong>la</strong>nd and 3 new member states with active microlending programmes:<br />
Hungary, Po<strong>la</strong>nd and Slovakia (<strong>EMN</strong>, 2006). This second survey report is avai<strong>la</strong>ble from the <strong>EMN</strong> website (www.european-microfinance.org)<br />
9
<strong>EMN</strong> <strong>2008</strong>-<strong>2009</strong> <strong>Overview</strong><br />
10<br />
the West can be found in France, Germany and Spain and in Hungary, Romania and Bulgaria<br />
in the East. The number of active clients in the EU was 135,815 at the end of <strong>2009</strong>.<br />
Microlen<strong>de</strong>rs surveyed in the EU focus on start-up businesses and on the consolidation<br />
of existing small microenterprises, i.e. those with nine or fewer employees. Clients targeted,<br />
in or<strong>de</strong>r of importance, are financially exclu<strong>de</strong>d individuals followed by women, ethnic<br />
minorities and/or immigrants, unemployed people, youth and disabled people. There is<br />
consi<strong>de</strong>rable over<strong>la</strong>p amongst many of these groups. Youth (18-25 years) and disabled people<br />
remain as lower priority groups. Urban and rural popu<strong>la</strong>tions are almost equally targeted.<br />
In <strong>2009</strong>, 27% of microloan clients were women, 13% of clients were immigrants and/<br />
or ethnic minorities, 11% were youth. Women continue to be un<strong>de</strong>r-represented amongst<br />
microloan clients when compared to their proportion in microlending programmes operating<br />
in <strong>de</strong>veloping countries, where they represent 83.2% of the poorest clients reached by<br />
microfinance institutions (Daley-Harris, <strong>2009</strong>). The relevance of other at risk groups such as<br />
immigrants and youth as microcredit clients is significant in some countries. For example, in<br />
Norway and Spain, immigrants are represented well over their proportion of the popu<strong>la</strong>tion.<br />
The weighted average loan size across the sample has <strong>de</strong>creased in recent years from 11,002<br />
euros in 2007 to 9,641 euros in <strong>2009</strong> 2 .<br />
Eastern European countries are disbursing <strong>la</strong>rger loans, as len<strong>de</strong>rs in these countries are<br />
focusing on microenterprise promotion and SME promotion, while in Western countries<br />
len<strong>de</strong>rs are focusing on social and financial inclusion, for which a smaller average loan was<br />
disbursed.<br />
Financial performance reporting continues to be weak across the sector. However, amongst<br />
organisations providing data, loan portfolio performance ratios have improved once again<br />
since the <strong>la</strong>st survey. Amongst the 30% of len<strong>de</strong>rs that provi<strong>de</strong>d information on their operational<br />
self-sufficiency rates, the average rate in <strong>2009</strong> was 93% (up 13 points over the previous survey)<br />
and forty percent of the respon<strong>de</strong>nts were operationally self-sustaining, representing a <strong>de</strong>cline<br />
of 7% over the previous survey.<br />
The most frequently monitored ratios are repayment rates, portfolios at risk, write-offs<br />
and rescheduled loans. In <strong>2009</strong>, the average repayment rate was 63%, a drop of over twenty<br />
points from the previous survey. The average portfolio at risk rate was 16% (2 points higher<br />
than 2007), the average write-off rate was 9.5% (3.5 points higher than 2007) and the average<br />
refinancing ratio was 14% (9 points higher than 2007) (<strong>EMN</strong>, <strong>2008</strong>) 3 . These <strong>de</strong>creases across the<br />
board in operational performance ratios can be taken as evi<strong>de</strong>nce of the impact of the economic<br />
and financial crisis on the microfinance sector. The best financially performing organisations<br />
continue to be found in the Eastern EU countries of Bulgaria and Romania, characterised by<br />
their for-profit legal status.<br />
The most important challenge for the sector continues to be reaching sustainability, which<br />
has not changed over the previous survey and continues to be a challenge for the microfinance<br />
sector as a whole. Whereas social performance was the next most important challenge for<br />
institutions in the previous survey, in this survey institutions listed outreach to the most<br />
exclu<strong>de</strong>d, implying a slight change of focus. As many microcredit clients can be said to be<br />
impacted by the economic and financial crisis, it can be expected that the number of people<br />
exclu<strong>de</strong>d would grow as a result, and therefore the goal of focusing on these clients becomes<br />
more urgent.<br />
The <strong>la</strong>ck of institutional capacity and the legal regu<strong>la</strong>tory environment regarding usury and<br />
borrowing for lending were the most important constraints listed by institutions in this edition<br />
of the survey. Len<strong>de</strong>r efforts to cover costs and achieve scale have been impacted as a result.<br />
Funding operational costs was also cited as a significant challenge for len<strong>de</strong>rs. The majority<br />
are highly <strong>de</strong>pen<strong>de</strong>nt on public and private sources for both operational costs and loan capital.<br />
Very few are able to cover their operational costs through earned income. Greater regu<strong>la</strong>tory<br />
flexibility is nee<strong>de</strong>d in the upcoming years to adapt to challenges faced by the recent crisis, by<br />
allowing institutions to tap into new resources for growth and by providing long term access<br />
to capital. This will help the sector continue to grow and reach self-sufficiency.<br />
2 The <strong>de</strong>crease in average loan size could also be due to the difference in sample size. For more information, please refer to the Methodology<br />
section.<br />
3 These comparisons are carried out keeping in mind the methodological differences exp<strong>la</strong>ined in greater <strong>de</strong>tail in the Methodology section.
Introduction<br />
1<br />
<strong>Microfinance</strong> in Europe is gradually being consolidated as an essential tool of<br />
social policy, for the promotion of self-employment, microenterprise support<br />
and the fight against social and financial exclusion. This is <strong>de</strong>monstrated by the<br />
initiatives that the European Commission has <strong>la</strong>unched, such as the Jasmine 4<br />
initiative and the European <strong>Microfinance</strong> Facility for Employment and Social Inclusion<br />
(Progress <strong>Microfinance</strong> Facility 5 ), to promote and support the <strong>de</strong>velopment of the sector.<br />
However, since the economic and financial crisis began in <strong>2008</strong>, many of the microfinance<br />
mo<strong>de</strong>ls in various countries in Europe have been re<strong>de</strong>signed with the goal of adapting to the<br />
new challenges they face.<br />
In January 2010, Fundación Nantik Lum <strong>la</strong>unched the fourth <strong>EMN</strong> survey of the microcredit<br />
sector covering activity in <strong>2008</strong> and <strong>2009</strong>. The purposes of this edition of the survey are to<br />
track changes in the industry; <strong>de</strong>epen the un<strong>de</strong>rstanding of core issues such as scale, outreach,<br />
sustainability and financial performance; uncover future p<strong>la</strong>ns for growth; and ask about<br />
funding sources, marketing and impact.<br />
One of the most fundamental changes in the sector during this period is the integration of<br />
the personal microcredit with notable intensity. Personal microcredit is not usually <strong>de</strong>signed<br />
to permit access to financing for the start-up of new businesses, but to help families confront<br />
specific needs, at times with greater priority, that have emerged in this new economic and<br />
financial context.<br />
This year’s survey has a record participation. This year, a total of 432 institutions in 28<br />
European countries were contacted, of which 170 institutions in 21 countries respon<strong>de</strong>d<br />
(see the Appendix for the complete list). Of the total MFIs that respon<strong>de</strong>d to this version, 97<br />
participated for the first time. The increase in the number of responses is believed to be for<br />
two main reasons: first, the increasing interest that various institutions have <strong>de</strong>monstrated in<br />
the European sector which has led to the participation of new actors in the microfinance field,<br />
and second, the active work of 10 country coordinators that col<strong>la</strong>borated in the collection of<br />
data in different regions. As a result, over recent years, a <strong>de</strong>eper un<strong>de</strong>rstating of the European<br />
microfinance sector and the different actors involved has been obtained.<br />
4 JASMINE stands for “Joint Action to Support <strong>Microfinance</strong> Institutions in Europe” and is a pilot initiative which has been <strong>de</strong>veloped by the<br />
European Commission (EC), the European Investment Bank (EIB) and the European Investment Fund (EIF) to provi<strong>de</strong> effective support for the<br />
promotion of microcredit in the European Union.<br />
5 PROGRESS is the EU’s employment and social solidarity programme implemented by the European Social Fund (ESF). It was established to<br />
financially support the implementation of the objectives of the European Union in employment, social affairs and equal opportunities, as set out<br />
in the Social Agenda.<br />
11
<strong>EMN</strong> <strong>2008</strong>-<strong>2009</strong> <strong>Overview</strong><br />
12<br />
With the implementation of the <strong>2009</strong>-<br />
2011 Strategic P<strong>la</strong>n, <strong>EMN</strong> has <strong>de</strong>veloped a<br />
way to strengthen the involvement of its<br />
members and to work alongsi<strong>de</strong> with them<br />
through the Working Groups. Each of these<br />
groups is hea<strong>de</strong>d by an <strong>EMN</strong> member and<br />
also inclu<strong>de</strong>s core members and associate<br />
members. Moreover, a representative of the<br />
Secretariat is involved in each of the groups<br />
and a member of the board acts as a liaison.<br />
The following Working Groups have been set<br />
up:<br />
1. Legal Environment and Regu<strong>la</strong>tion<br />
2. Social Performance Measurement<br />
3. Growth<br />
4. Research<br />
5. IT and Innovation<br />
In the fourth edition for <strong>2008</strong>-<strong>2009</strong>, the<br />
survey has maintained the same number of<br />
questions as in the past edition. However, the<br />
structure of the survey and the corresponding<br />
report has been changed as new questions<br />
have been inclu<strong>de</strong>d and other questions have<br />
been <strong>de</strong>leted. With the aim of incorporating<br />
specific research topics for the Workings<br />
Groups, four new sections have been inclu<strong>de</strong>d<br />
in this edition: Information Technology, Crisis,<br />
Social Environment and Regu<strong>la</strong>tion, and Social<br />
Performance and Impact. These sections are<br />
either newly created or have been a result of<br />
6 The European Free Tra<strong>de</strong> Association (EFTA) inclu<strong>de</strong>s Ice<strong>la</strong>nd, Norway, Switzer<strong>la</strong>nd and Liechtenstein.<br />
extracting questions from the previous surveys<br />
and creating separate sections. Sections<br />
on funding, sustainability and financial<br />
performance have also been expan<strong>de</strong>d.<br />
Financial indicators were aligned based on<br />
those recommen<strong>de</strong>d by CGAP and those that<br />
utilize the MIX Market information p<strong>la</strong>tform,<br />
incorporating new measurements that are<br />
key for the performance of the institutions in<br />
Europe. Even though these questions had a<br />
low response rate in general, <strong>EMN</strong> sets out to<br />
foster a healthy microfinance sector, providing<br />
a tool for assessment and comparison and<br />
ultimately providing a path for creating strong<br />
institutions.<br />
The sources of information used by<br />
Fundación Nantik Lum in the current edition<br />
are principally ma<strong>de</strong> up of the information<br />
gathered by a questionnaire on behalf of<br />
<strong>EMN</strong>, as well as drawing on pre-existing data<br />
released to <strong>EMN</strong> and information avai<strong>la</strong>ble in<br />
the public domain.<br />
As stated above, in this edition of the<br />
<strong>EMN</strong> survey we have chosen to inclu<strong>de</strong> in<br />
our survey the European Union 27 countries<br />
(as of December <strong>2009</strong>), the candidate country<br />
Croatia, as well as the countries that belong to<br />
the European Free Tra<strong>de</strong> Association (EFTA) 6 .<br />
We aim to inclu<strong>de</strong> more countries during each<br />
edition of the survey. As Europe continues<br />
to grow, so will our inclusion of European<br />
countries.
Methodology<br />
2<br />
This is the fourth edition of the Pan-European <strong>Microfinance</strong> Survey carried out for<br />
the European <strong>Microfinance</strong> Network. The <strong>la</strong>st two editions of the survey were<br />
coordinated by Fundación Nantik Lum as Coordinator of the Research Working<br />
Group. The first survey of the sector, un<strong>de</strong>rtaken by the new economics foundation<br />
(nef) on behalf of <strong>EMN</strong>, covered the years 2002 and 2003, and counted on the participation of 32<br />
organisations. The second survey covered 2004 and 2005 with 109 organisations participating.<br />
Out of these organisations, 89 disbursed microloans directly. In the third edition of the survey,<br />
for the years 2006-2007, 94 agencies 7 involved in microfinance in 16 countries participated.<br />
This brings us to our current edition, with 170 participants from 21 countries.<br />
The number of responses to the present survey has witnessed a spectacu<strong>la</strong>r growth, with<br />
an increase of over 80%. This increase can be exp<strong>la</strong>ined by two important reasons: first, there<br />
was a notable increase in the number of responses from Bulgaria, from five responses in the<br />
2006/2007 survey to 16 responses in the <strong>2008</strong>-<strong>2009</strong> survey. On the other hand, Hungary is<br />
an exceptional case - in the 2004-2005 edition of the survey, one of the participants was the<br />
Hungarian <strong>Microfinance</strong> Network, an association of 20 Local Enterprise Agencies (LEAs) and<br />
whose response was counted as but one. However, in the current edition, the members of<br />
this network have respon<strong>de</strong>d individually, thereby exp<strong>la</strong>ining the jump in responses from<br />
this country. At the same time, there was a notable increase in the number of institutions that<br />
respon<strong>de</strong>d in Romania, Spain and the United Kingdom. The growth can also be exp<strong>la</strong>ined<br />
by the incorporation of countries that were not represented in previous editions: Croatia (2<br />
institutions), Estonia (1), Latvia (2) and Lithuania (2), or by countries with a <strong>la</strong>ck of responding<br />
institutions from the previous edition, Ire<strong>la</strong>nd (1), Norway (2) and Swe<strong>de</strong>n (4).<br />
The resounding success of the current edition would not have been possible without the<br />
col<strong>la</strong>boration of each and every country coordinator who did a won<strong>de</strong>rful job in raising the<br />
total number of participating microfinance institutions in their respective countries, trans<strong>la</strong>ting<br />
the <strong>EMN</strong> questionnaire from English into Bulgarian, French, German, Hungarian, Italian or<br />
Spanish, sending out the respective questionnaire, following up with respon<strong>de</strong>nts, trans<strong>la</strong>ting<br />
open en<strong>de</strong>d questions back into English and submitting all questionnaires to Fundación<br />
Nantik Lum for data analysis. The 11 col<strong>la</strong>borating agencies are as follows:<br />
7 These 94 organisations represented 114 organisations, as the nation-wi<strong>de</strong> network of 20 LEAs (Local Enterprise Agencies) of the Hungarian<br />
<strong>Microfinance</strong> Network (HMN) had been consi<strong>de</strong>red as one single organisation instead of 20 individual organisations.<br />
13
<strong>EMN</strong> <strong>2008</strong>-<strong>2009</strong> <strong>Overview</strong><br />
14<br />
Centre for Entrepreneurship and<br />
Executive Development (CEED), Bulgaria.<br />
Deutsches Mikrofinanz Institut (DMI),<br />
Germany.<br />
EUROM Consultancy, Romania.<br />
European <strong>Microfinance</strong> Network (<strong>EMN</strong>),<br />
France.<br />
Fundación Nantik Lum, Spain.<br />
Giordano Dell’Amore Foundation<br />
(FGDA), Italy.<br />
Hungarian <strong>Microfinance</strong> Network<br />
(HMN), Hungary.<br />
INHol<strong>la</strong>nd University of applied sciences,<br />
Center for <strong>Microfinance</strong> and Small<br />
Business Development, the Nether<strong>la</strong>nds.<br />
Nätverk för Entreprenörer från Etniska<br />
Minoriteter (NEEM), Swe<strong>de</strong>n.<br />
<strong>Réseau</strong> Financement Alternatif ASBL<br />
(RFA), Belgium.<br />
Veronika Thiel – In<strong>de</strong>pen<strong>de</strong>nt<br />
<strong>Microfinance</strong> Consultant and Director of<br />
the Centre for Responsible Credit, United<br />
Kingdom.<br />
This edition of the survey was ma<strong>de</strong><br />
avai<strong>la</strong>ble once again in Microsoft Word format<br />
and the online format provi<strong>de</strong>d by Survey<br />
Monkey. With each edition, institutions are<br />
gradually increasing their familiarization<br />
with the electronic format, which represents<br />
an advance for the sector. The number of<br />
responses that were manually introduced<br />
from Microsoft Word in this survey was<br />
minimal.<br />
For the period <strong>2008</strong>-<strong>2009</strong>, institutions from<br />
Austria and Slovakia that participated in the<br />
previous survey, did not participate in the<br />
present one due to the absence of current<br />
microcredit programmes in each country. In<br />
Slovakia the organisation Integra no longer<br />
works in microfinance in Europe and in Austria<br />
the new microcredit programme was only set<br />
up in March 2010. Bulgaria and Romania,<br />
which participated in the <strong>EMN</strong> survey for the<br />
first time for the period 2006-2007, increased<br />
their participation significantly.<br />
As occurred in the <strong>la</strong>st survey, in the case<br />
of the United Kingdom, the community<br />
<strong>de</strong>velopment finance association (cdfa) 8 ,<br />
which carries out its own annual survey,<br />
assisted the respective Country Coordinator in<br />
obtaining permission to access this data and in<br />
forwarding all cdfa held data for analysis, and<br />
in sending a complementary survey to cdfa to<br />
complete the missing information nee<strong>de</strong>d by<br />
this survey. Of the 37 institutions contacted<br />
to complete the complementary survey for<br />
the current edition, 18 participated. Other UK<br />
organisations respon<strong>de</strong>d directly to the <strong>EMN</strong><br />
questionnaire. The data provi<strong>de</strong>d by cdfa<br />
covers only one year, from April of <strong>2008</strong> to the<br />
end of March <strong>2009</strong>. This data was treated as<br />
figures from <strong>2009</strong>. Therefore, there is no data<br />
avai<strong>la</strong>ble for some UK organisations for the<br />
year <strong>2008</strong> for comparison purposes. Of the<br />
38 institutions contacted in the <strong>la</strong>st survey, 13<br />
respon<strong>de</strong>d, so it is also worth noting that the<br />
response rate from the UK increased almost<br />
70% in this edition.<br />
Due to the financial crisis, various<br />
microcredit programs of the Savings Banks<br />
in Spain were reduced or closed <strong>de</strong>finitively.<br />
This has created the necessity to reconsi<strong>de</strong>r<br />
the mo<strong>de</strong>l in this country and look for<br />
new formu<strong>la</strong>s for its <strong>de</strong>velopment. In this<br />
context, various Social Microcredit Support<br />
Organisations (SMSOs), both public and<br />
private in nature, that would usually only<br />
act as intermediaries between Savings Banks<br />
and the beneficiary, have begun their own<br />
microcredit concession programs. For this<br />
reason, Spanish entities that found themselves<br />
in this situation were asked to complete the<br />
questionnaire with only the information that<br />
was not linked to financing by the Savings<br />
Banks, with the aim of avoiding duplication<br />
of information. The efforts of these entities<br />
to carry out a separate evaluation of their<br />
data and col<strong>la</strong>borate in the transparency of<br />
the microfinance sector in Europe should be<br />
acknowledged. With this in mind, 11 SMSOs<br />
and six Savings Banks participated in Spain<br />
in this edition.<br />
This survey notes a high participation<br />
level of the MFIs from Eastern Europe. 32%<br />
of the institutions that participated in the<br />
survey come from this region. Nonetheless,<br />
information was not received from an<br />
important institution in Po<strong>la</strong>nd, Fundusz<br />
Mikro. With the goal of having an accurate<br />
overview of the sector, public data on this<br />
institution has been extracted from the Mix<br />
Market for the key indicators: loans disbursed<br />
in number and value and average loan size.<br />
It is important to keep in mind that these<br />
indicators have been inclu<strong>de</strong>d for these three<br />
analyses.<br />
8 The cdfa is the umbrel<strong>la</strong> organisation of Community Development Finance Institutions (CDFIs) which are sustainable, in<strong>de</strong>pen<strong>de</strong>nt financial<br />
institutions that provi<strong>de</strong> capital and support to enable individuals or organisations to <strong>de</strong>velop and create wealth in disadvantaged communities<br />
or un<strong>de</strong>r-served markets. While some CDFIs specialise in microfinance loans, the sector as a whole consists of a range of product offerings to<br />
address financial exclusion (www.cdfa.org.uk).
Italy was, once again, the country with<br />
the highest number of respon<strong>de</strong>nts. This was<br />
possible thanks to the combined efforts of<br />
members of the Italian <strong>Microfinance</strong> Network<br />
(RITMI) and the lead coordinator Giordano<br />
Dell’Amore Foundation, and due to the<br />
<strong>la</strong>rge number of actors that consist of a <strong>la</strong>rge<br />
number of small social microcredit initiatives<br />
and other religious organisations providing<br />
microcredit on a small scale.<br />
To the extent that year after year the Pan-<br />
European Microcredit survey is carried out,<br />
and in spite of an enormous effort on behalf of<br />
<strong>EMN</strong>, Fundación Nantik Lum and the country<br />
coordinators, the disparate col<strong>la</strong>boration<br />
between editions makes it very difficult to<br />
draw accurate comparisons between reports.<br />
The main motivation to track the evolution of<br />
microfinance in Europe is hampered by the<br />
difficulty in obtaining uniformity in the data<br />
sample.<br />
To better un<strong>de</strong>rstand this difficulty, Table<br />
1 below gives the total number of responses<br />
obtained from MFIs over the <strong>la</strong>st two editions<br />
of the survey. We can observe that only 58<br />
MFIs respon<strong>de</strong>d to both editions, representing<br />
only 61% of the institutions that participated<br />
in 2006-2007 that respon<strong>de</strong>d to the <strong>2008</strong>-<strong>2009</strong><br />
edition. For this reason, only general data<br />
with comparable samples in both 2006-2007<br />
and <strong>2008</strong>-<strong>2009</strong> will be analysed. The total<br />
number of institutions that respon<strong>de</strong>d for<br />
the first time, that is to say, that have never<br />
participated in the study, is 97 institutions.<br />
Moreover, there were 113 institutions that<br />
respon<strong>de</strong>d to the present edition that did not<br />
participate in the 2006-2007 edition but did<br />
participate in earlier editions (2004-2005 or<br />
2002-2003).<br />
Therefore, the data provi<strong>de</strong>d in this<br />
report will refer exclusively to the <strong>2008</strong>-<strong>2009</strong><br />
survey, and in some cases, efforts have been<br />
ma<strong>de</strong> to compare data in or<strong>de</strong>r to highlight<br />
sector trends. When comparisons are<br />
used, it is important to keep in mind these<br />
aforementioned sample differences. This<br />
report will continue using the same structure<br />
as the previous one in or<strong>de</strong>r to make the<br />
analysis easier for rea<strong>de</strong>rs.<br />
Table 1: Comparison of responses in the <strong>la</strong>st two survey editions<br />
Total number of respon<strong>de</strong>nts for the <strong>2008</strong>-<strong>2009</strong> survey 170<br />
Total number of newcomers for the <strong>2008</strong>-<strong>2009</strong> survey 97<br />
Total number of respon<strong>de</strong>nts for the 2006-2007 survey 94<br />
Number of institutions that respon<strong>de</strong>d for 2006-2007 and <strong>2008</strong>-<strong>2009</strong> 58<br />
The <strong>2008</strong>-<strong>2009</strong> survey questionnaire, which<br />
was trans<strong>la</strong>ted from English into six <strong>la</strong>nguages,<br />
covered the majority of the relevant topics that<br />
were inclu<strong>de</strong>d in the 2004-2005 and 2006-2007<br />
surveys. However, some modifications were<br />
ma<strong>de</strong> based on an agreement reached by the<br />
Core Members of the <strong>EMN</strong> Research Working<br />
Group. With these modifications in mind, the<br />
Research Working Group held two face-toface<br />
meetings, one on June 3rd in Mi<strong>la</strong>n and<br />
the other on September 7th in Madrid, and<br />
two conference calls over the span of <strong>2009</strong>.<br />
Briefly, the conclusions drawn from this<br />
process by the Research Working Group<br />
were:<br />
a) To inclu<strong>de</strong> questions that targeted<br />
information on personal credit, but not<br />
to differentiate personal and business<br />
credit this throughout the entire<br />
questionnaire;<br />
b) To remove specific questions to simplify<br />
and make coordinators’ work more<br />
efficient;<br />
c) To inclu<strong>de</strong> new questions to cover the<br />
topics of IT and technology, regu<strong>la</strong>tion<br />
and legal environment, sustainability<br />
and how the economic crisis has affected<br />
the sector;<br />
d) To establish a set of indicators on social,<br />
financial and operational performance<br />
to be asked systematically in the<br />
survey, in col<strong>la</strong>boration with the social<br />
performance and sustainability working<br />
group;<br />
e) To exp<strong>la</strong>in clearly these indicators and<br />
illustrate how to calcu<strong>la</strong>te them by using<br />
examples;<br />
f) To edit questions specifically regarding<br />
the interest rates charged so the reported<br />
rates would be more transparent.<br />
The survey used the European Union<br />
accepted <strong>de</strong>finition of microloans as loans of<br />
25,000 euros or less ma<strong>de</strong> to microenterprises<br />
or businesses with nine or fewer employees.<br />
Nevertheless, some EU len<strong>de</strong>rs have reported<br />
loans for higher amounts that have been<br />
15
<strong>EMN</strong> <strong>2008</strong>-<strong>2009</strong> <strong>Overview</strong><br />
16<br />
inclu<strong>de</strong>d in the report to give a better picture<br />
of how microcredit is being used by the main<br />
provi<strong>de</strong>rs. These were specific loans and<br />
did not represent their lending practice as a<br />
whole. Immigrants were <strong>de</strong>fined as “those<br />
individuals, not born in their country of<br />
resi<strong>de</strong>nce”.<br />
Not all questionnaires were complete.<br />
The percentage figures used in the analysis<br />
throughout the report re<strong>la</strong>te to the number<br />
of responses received for each individual<br />
question. Where response rates were low, this<br />
is indicated in the report text.<br />
When discussing the microfinance sector<br />
in Europe, it is important to note that the<br />
terms “microcredit” and “microfinance”<br />
are used interchangeably. This is due<br />
to the fact that microcredit remains the<br />
primary focus of the microfinance sector<br />
in Europe. As we are moving into the next<br />
generation of microfinance which inclu<strong>de</strong>s<br />
savings mobilization, insurance, business<br />
<strong>de</strong>velopment services and a range of new<br />
Table 2: Survey respon<strong>de</strong>nts by country<br />
products and services implicit in the growth<br />
of the microfinance sector, terminology used<br />
should follow this movement, but in the<br />
present time we will continue to use the terms<br />
interchangeably.<br />
Out of 432 organisations contacted for<br />
the survey, 170 respon<strong>de</strong>d, representing a<br />
response rate of 39%, a simi<strong>la</strong>r rate to previous<br />
years but it is a figure very much <strong>la</strong>rger in<br />
absolute terms. By country, the response rates<br />
varied. In those countries where five MFIs or<br />
less were contacted, the response rate was<br />
100% (Belgium, Croatia, Estonia, Fin<strong>la</strong>nd,<br />
Ire<strong>la</strong>nd, Latvia, Lithuania, Norway and<br />
Switzer<strong>la</strong>nd) with the exception of Po<strong>la</strong>nd<br />
and Slovakia where five were contacted and<br />
one respon<strong>de</strong>d and four MFIs were contacted<br />
and none respon<strong>de</strong>d, respectively. The data<br />
from four countries were inclu<strong>de</strong>d for the first<br />
time in this research: Croatia, Estonia, Latvia<br />
and Lithuania.<br />
The breakdown of respon<strong>de</strong>nts by country<br />
is as follows:<br />
Nº Countries<br />
<strong>2008</strong> / <strong>2009</strong><br />
Contacted Participated<br />
2006 / 2007<br />
Contacted Participated<br />
2004 / 2005<br />
Contacted Participated<br />
1 Austria 1 0 1 1 1 0<br />
2 Belgium 4 4 5 4 4 2<br />
3 Bulgaria 66 16 5 5 0 0<br />
4 Croatia 2 2 0 0 0 0<br />
5 Cyprus 1 0 1 0 0 0<br />
6 Czech Republic 3 0 0 0 0 0<br />
7 Denmark 1 0 0 0 0 0<br />
8 Estonia 1 1 0 0 0 0<br />
9 Fin<strong>la</strong>nd 1 1 1 1 1 1<br />
10 France 14 6 8 4 5 2<br />
11 Germany 25 16 34 11 20 9<br />
12 Hungary 55 21 6 4 2 20<br />
13 Ire<strong>la</strong>nd 1 1 1 0 2 1<br />
14 Italy 94 33 40 27 9 9<br />
15 Latvia 2 2 0 0 0 0<br />
16 Lithuania 2 2 1 0 0 0<br />
17 Luxembourg 9 0 0 0 0 0<br />
18 Macedonia 1 0 0 0 0 0<br />
19 The Nether<strong>la</strong>nds 16 4 6 6 0 0<br />
20 Norway 2 2 1 0 1 1<br />
21 Po<strong>la</strong>nd 5 1 5 1 5 3<br />
22 Portugal 7 2 1 1 1 1<br />
23 Romania 18 9 9 5 0 0<br />
24 Slovakia 4 0 2 1 2 2<br />
25 Spain 53 20 40 9 61 32<br />
26 Swe<strong>de</strong>n 6 4 2 0 2 2<br />
27 Switzer<strong>la</strong>nd 1 1 1 1 1 1<br />
28 United Kingdom 37 22 38 13 22 23<br />
Total 432 170 208 94 (rep.114) 13 109
3.1 Country Base<br />
Table 2 in the previous section shows the difference in the number of actors in each country.<br />
The <strong>la</strong>rgest number of actors is found in Italy, which, as mentioned earlier, is ma<strong>de</strong> up of<br />
a <strong>la</strong>rge number of small social microcredit initiatives and anti-usury associations. Bulgaria<br />
and Hungary have the next highest number of institutions, in Bulgaria because the majority<br />
of commercial banks have some form of microfinance initiative and in the case of Hungary<br />
because of the existence of the multitu<strong>de</strong> of savings cooperatives and Local Enterprise<br />
Agencies (LEAs). The countries with the next highest number of institutions are Spain and<br />
the United Kingdom. In Spain, all savings banks that had microfinance programs in the years<br />
<strong>2008</strong>-<strong>2009</strong> were contacted as well as the Social Microcredit Support Organisations (SMSOs)<br />
that had a microcredit program that was financially in<strong>de</strong>pen<strong>de</strong>nt from the savings banks.<br />
Finally, in the UK, a <strong>la</strong>rge number of actors can be found due to the strong activity of public,<br />
private and non-profit <strong>de</strong>velopment finance agencies. In particu<strong>la</strong>r, Community Development<br />
Financial Institutions p<strong>la</strong>y an important role in the UK microcredit sector and the majority of<br />
microlending intuitions in the United Kingdom could be grouped into this category.<br />
3.2 Scale<br />
Sector Characteristics<br />
3<br />
In <strong>2009</strong>, the organisations surveyed 9 disbursed a total of 84,523 microloans worth 828<br />
million euros. 138 of the 170 participating institutions gave information regarding the number<br />
of loans and loan value for <strong>2009</strong> and 118 gave information for the same information for <strong>2008</strong>.<br />
In the Eastern countries (Bulgaria, Croatia, Estonia, Hungary, Latvia, Lithuania, Po<strong>la</strong>nd and<br />
Romania), the total number of loans disbursed was 18,293, for the equivalent of 307 million<br />
euros, whereas in the Western countries (Belgium, Fin<strong>la</strong>nd, France, Germany, Ire<strong>la</strong>nd, Italy, the<br />
Nether<strong>la</strong>nds, Norway, Portugal, Spain, Swe<strong>de</strong>n, Switzer<strong>la</strong>nd and United Kingdom), the total<br />
number of loans disbursed came to 51,027, equivalent to 477 million euros. Eastern countries<br />
represent 26% of total loans and 40% of total value, whereas Western countries represent 74%<br />
of total loans and 60% of total value. This means that in the Eastern EU countries the average<br />
loan value is higher than in Western EU countries 10 .<br />
9 For these numbers, the data of Fundusz Micro have been inclu<strong>de</strong>d, although they did not respon<strong>de</strong>d to the survey, the public information<br />
reported to the Mix Market was inclu<strong>de</strong>d.<br />
10 For these numbers, the data of Fundusz Micro have not been inclu<strong>de</strong>d.<br />
17
<strong>EMN</strong> <strong>2008</strong>-<strong>2009</strong> <strong>Overview</strong><br />
18<br />
Despite the methodological difficulties that<br />
exist for comparing figures across years 11 , the<br />
Table 3: Number and value of loans disbursed<br />
With the goal of having an accurate vision<br />
of the evolution of microfinance in Europe<br />
spanning over time, a sample of 58 institutions<br />
that respon<strong>de</strong>d to both the 2006-2007 and <strong>2008</strong>-<br />
<strong>2009</strong> surveys was taken. These 58 institutions<br />
are found in 13 countries: Belgium, Bulgaria,<br />
Fin<strong>la</strong>nd, France, Germany, Hungary, Italy,<br />
the Nether<strong>la</strong>nds, Portugal, Romania, Spain,<br />
Switzer<strong>la</strong>nd and the United Kingdom. In this<br />
It can be observed that from 2006 to <strong>2008</strong><br />
the sector un<strong>de</strong>rwent important growth in the<br />
number of loans as well as in the value of the<br />
portfolio in millions of euros. Furthermore,<br />
European microfinance sector continues to<br />
grow in terms of value.<br />
2005 2006 2007 <strong>2008</strong> <strong>2009</strong> Growth Rate<br />
<strong>2008</strong> - <strong>2009</strong> 12<br />
Number of loans 27,000 35,553 42,750 90,605 84,523 -7%<br />
In millions of euros 210 295 394 802 828 3%<br />
Table 4: Number and Value of Loans Disbursed<br />
in the 58 Institution Sample<br />
sample, the Hungarian <strong>Microfinance</strong> Network<br />
is counted as one institution, even though in<br />
2006-2007 the 20 individual LEAs respon<strong>de</strong>d<br />
as one, and in <strong>2008</strong>-<strong>2009</strong> these organisations<br />
reported individually.<br />
For this sample, the microcredits disbursed,<br />
in number as well as in monetary value, can<br />
be seen in Table 4 below:<br />
2006 2007 <strong>2008</strong> <strong>2009</strong><br />
Number of loans 33,462 36,936 45,401 37,714<br />
In millions of euros 282 357 375 353<br />
Graph 1: Growth rate of the 58 institution sample<br />
25%<br />
20%<br />
15%<br />
10%<br />
5%<br />
0%<br />
-5%<br />
-10%<br />
-15%<br />
-20%<br />
-25%<br />
9%<br />
11 Please refer to the Methodology chapter.<br />
19%<br />
-20%<br />
between <strong>2008</strong> and <strong>2009</strong>, the rates are negative<br />
for both indicators, as the <strong>de</strong>crease is almost<br />
threefold in the number of microcredits<br />
disbursed in Europe.<br />
21%<br />
NuMBeR oF LoANS IN MILLIoN oF euRoS<br />
2006 - 2007 2007 - <strong>2008</strong> <strong>2008</strong> - <strong>2009</strong><br />
12 Some len<strong>de</strong>rs in the UK reported loan data in <strong>2009</strong> but did not do so for <strong>2008</strong>. For more information, please see the Methodology section.<br />
5%<br />
-6%
The greatest rate of <strong>de</strong>crease between<br />
<strong>2008</strong> and <strong>2009</strong> for this sample was found in<br />
Romania (-70% in number of loans and -71%<br />
in millions of euros) and in Bulgaria (-57%<br />
in number of loans and -60% in millions of<br />
euros). On the other hand, in Germany and<br />
France, even though there was an important<br />
slowdown in growth in both countries, the<br />
growth rates in the number of microcredits<br />
disbursed remained positive. Seventytwo<br />
percent of organisations disbursing<br />
microloans reported on active borrowers<br />
in <strong>2009</strong>. This group inclu<strong>de</strong>d 135,815 active<br />
borrowers at the end of <strong>2009</strong> compared to<br />
121,677 in 2007 (<strong>EMN</strong>, <strong>2008</strong>) and 48,000 at the<br />
end of 2005 (<strong>EMN</strong>, 2006) 13 .<br />
When we look at the number of loans<br />
disbursed by country, we see that the greatest<br />
Graph 2: Number of loans disbursed in <strong>2009</strong><br />
28,863<br />
France<br />
16,655<br />
Po<strong>la</strong>nd<br />
10,402<br />
Hungary<br />
8,205<br />
Germany<br />
5,172<br />
Spain<br />
3,493<br />
Romania<br />
3,194<br />
Fin<strong>la</strong>nd<br />
The majority of organisations in Europe<br />
work at a national (70%) or local level (32%).<br />
Only 6% operate internationally.<br />
13 Please refer to the Methodology chapter in re<strong>la</strong>tion to the differences in samples across surveys.<br />
14 Information on Fundusz Mikro, obtained from the Mix Market, was inclu<strong>de</strong>d in this analysis.<br />
2,637<br />
Bulgaria<br />
1,909<br />
Italy<br />
880<br />
united Kingdom<br />
coverage on average was in France, Po<strong>la</strong>nd,<br />
Fin<strong>la</strong>nd, Germany and Hungary 14 . The major<br />
institutional p<strong>la</strong>yers were found in France,<br />
Germany, Romania and Fin<strong>la</strong>nd.<br />
Of these, two organisations disbursed<br />
14,050 and 13,997 loans in France, a not-for<br />
profit organisation and an NGO respectively.<br />
However, it should be mentioned that the<br />
14,050 loans provi<strong>de</strong>d by the non-for-profit<br />
organization are in fact zero-interest quasiequity<br />
loans that allow beneficiaries to access<br />
significant complementary bank credits.<br />
A bank in Hungary disbursed 9,500 loans,<br />
a government body disbursed 7,000 loans<br />
in Germany, a bank disbursed 4,131 loans<br />
in Spain and 3,194 loans were disbursed in<br />
Fin<strong>la</strong>nd by a government body (Graph 2).<br />
864<br />
Swe<strong>de</strong>n<br />
835<br />
Belgium<br />
572<br />
Nether<strong>la</strong>nds<br />
454<br />
Portugal<br />
160<br />
Croatia<br />
149<br />
Latvia<br />
55<br />
Ire<strong>la</strong>nd<br />
18<br />
Switzer<strong>la</strong>nd<br />
6<br />
Norway<br />
As seen in the graph below, the country<br />
with the <strong>la</strong>rgest number of active clients<br />
is France with 70,252 clients followed by<br />
Fin<strong>la</strong>nd, Romania and Spain.<br />
19
<strong>EMN</strong> <strong>2008</strong>-<strong>2009</strong> <strong>Overview</strong><br />
20<br />
Graph 3: Number of active clients by country<br />
PoRTUGAL<br />
829<br />
IRELAND<br />
151<br />
SPAIN<br />
9.786<br />
UK<br />
3.102<br />
FRANCE<br />
70.252<br />
NETHERLANDS<br />
541<br />
BELGIUM<br />
3.491<br />
GERMANy<br />
2.513<br />
SWITZERLAND<br />
56<br />
In Europe as a whole, unbankable clients<br />
ma<strong>de</strong> up 70% of loans disbursed. In contrast<br />
to the “nearly bankable” who can upgra<strong>de</strong> to<br />
mainstream financial services in the short to<br />
mid term, unbankable persons are financially<br />
and often socially exclu<strong>de</strong>d persons who will<br />
remain exclu<strong>de</strong>d from mainstream financial<br />
services in the mid to long term. The highest<br />
number of unbankable clients can be found<br />
in Belgium and Italy. This is not surprising<br />
for the Italian sector, where a greater focus<br />
on religious and social microcredit programs<br />
can be found. The countries with greater<br />
focus on bankable clients are countries that<br />
have disbursed a small number of loans,<br />
such as Fin<strong>la</strong>nd, the Nether<strong>la</strong>nds, Latvia and<br />
Lithuania as well as Hungary.<br />
As shown in the graph below, 57%<br />
percent of the European organisations<br />
disbursed less than 50 loans in <strong>2009</strong>. On the<br />
other hand, just 13% of the organisations<br />
disbursed more than 400 loans in <strong>2009</strong>. These<br />
organisations are mainly located in Western<br />
EU countries (France, Germany and Spain).<br />
This represents a change over previous years,<br />
where institutions that disbursed more than<br />
400 loans were located principally in Eastern<br />
Europe, where the sector is more mature.<br />
There are also two institutions that disbursed<br />
more than 10,000 loans and both are located<br />
ITALy<br />
2.146<br />
SWEDEN<br />
8<br />
PoLAND<br />
1.769<br />
HUNGARy<br />
2.589<br />
CRoATIA<br />
508<br />
FINLAND<br />
19.600<br />
LATVIA<br />
63<br />
RoMANIA<br />
15.163<br />
BULGARIA<br />
3.248<br />
There are also organisations that have reported more numbers of loans disbursed than numbers of active borrowers. This is the case for<br />
Germany (big provi<strong>de</strong>r), Hungary (big provi<strong>de</strong>r), Latvia, Norway, Spain and Swe<strong>de</strong>n. There are also organisations that have respon<strong>de</strong>d more<br />
number of loans disbursed than number of active borrowers (e.g. in the Nether<strong>la</strong>nds). In the case of Po<strong>la</strong>nd the difference is due to the fact<br />
that in number of loans disbursed Fundusz Micro is inclu<strong>de</strong>d but not in number of active clients.<br />
in France. There are also some organisations<br />
in Bulgaria, Hungary, Romania and Po<strong>la</strong>nd<br />
operating on a <strong>la</strong>rge scale. In the previous<br />
survey, the percentage of organisations<br />
disbursing fewer than 50 loans per year<br />
was 50% and for those disbursing over 400<br />
loans the figure was 20% (<strong>EMN</strong>, <strong>2008</strong>). The<br />
increase in the number of organisations at the<br />
bottom-end of the market between 2005 and<br />
<strong>2009</strong> may be exp<strong>la</strong>ined by the fact that new<br />
organisations have entered the market over<br />
the <strong>la</strong>st few years, disbursing small numbers<br />
of loans while. At the same time, existing<br />
p<strong>la</strong>yers are growing, increasing their number<br />
of loans disbursed per year.<br />
The survey has captured the majority of<br />
microlending activity in the EU. However,<br />
there are some gaps in the data. It was not<br />
possible, for example, <strong>de</strong>spite enormous efforts,<br />
to gather lending information from two big<br />
organisations - one in Po<strong>la</strong>nd (Fundusz Micro)<br />
that operates on a national scale, and the other<br />
based in Bulgaria (ProCredit Bank Bulgaria).<br />
In addition, of those countries contacted, there<br />
was no ongoing microcredit activity in 2006/07<br />
in: Austria, Czech Republic, Denmark, Greece,<br />
Luxembourg, Malta, Slovakia and Slovenia.<br />
Detailed data was not avai<strong>la</strong>ble for Cyprus (e.g.<br />
Women’s Cooperative Bank) and Macedonia<br />
(e.g. Procredit).
PeRCeNT oF oRGANISATIoNS (%)<br />
40<br />
35<br />
30<br />
25<br />
20<br />
15<br />
10<br />
5<br />
0<br />
10.000<br />
9.000<br />
8.000<br />
7.000<br />
6.000<br />
5.000<br />
4.000<br />
3.000<br />
2.000<br />
1.000<br />
0<br />
Graph 4: Percentage of organisations by numbers of loans disbursed<br />
in <strong>2009</strong><br />
36%<br />
21%<br />
10%<br />
20 or less 21 to 50 51 to 100 101 to 200 201 to 400 over 400<br />
NuMBeR oF MICRoLoANS DISBuRSeD<br />
This edition of the survey has put<br />
particu<strong>la</strong>r emphasis on including the<br />
commercial bank enterprise lending of 25,000<br />
euros or less. As a result, 20 banking institutions<br />
have reported data for <strong>2008</strong> and <strong>2009</strong>. This<br />
represents a big step forward, taking into<br />
account the important contributions of some<br />
commercial banks to the microfinance sector<br />
in Europe. These commercial banks are located<br />
throughout Europe in various locations, in<br />
Graph 5: Numbers of loans disbursed by commercial banks in <strong>2009</strong><br />
9.500<br />
Hungary<br />
4.190<br />
Spain<br />
1.047<br />
Romania<br />
600<br />
France<br />
309<br />
Portugal<br />
11%<br />
9%<br />
13%<br />
Bulgaria, France, Germany, Hungary, Italy<br />
and others. In Spain, commercial banks<br />
are concentrated in six savings banks (cajas<br />
<strong>de</strong> ahorro). These 20 banking institutions<br />
represent 12% of responding institutions and<br />
also represent 40% of the total European loan<br />
value and 7% of clients, which implies a higher<br />
average loan. Bankable clients also represent<br />
60% of their total portfolio, lending cre<strong>de</strong>nce<br />
to the higher average loan value.<br />
217<br />
Germany<br />
165<br />
Italy<br />
146<br />
Latvia<br />
10<br />
Bulgaria<br />
1<br />
Swe<strong>de</strong>n<br />
21
<strong>EMN</strong> <strong>2008</strong>-<strong>2009</strong> <strong>Overview</strong><br />
22<br />
3.3 Growth<br />
In spite of the slow growth experienced<br />
over the <strong>la</strong>st two years in Europe, the<br />
converse has occurred in the microfinance<br />
sector. While the growth in the number of<br />
loans disbursed between 2007 and <strong>2008</strong> was<br />
112% 15 , the change of overall growth rate in<br />
the sector over the same time period was -7%,<br />
as seen previously in section 3.2, Scale.<br />
From <strong>2008</strong> to <strong>2009</strong> highest growth in terms of<br />
numbers of loans occured in Hungary (+3412<br />
loans) and France (+2154 loans), followed by<br />
Fin<strong>la</strong>nd (+485 loans), Italy (+545 loans), the<br />
Nether<strong>la</strong>nds (+511 loans) and Germany (+505<br />
loans). However, in terms of rates, the lending<br />
growth rate is the highest in the Nether<strong>la</strong>nds<br />
(3475%, disbursing 16 loans in <strong>2008</strong> and 572<br />
loans in <strong>2009</strong>). This exceptional growth is due<br />
to the incorporation of two new institutions<br />
that began activities in <strong>2009</strong>, while in <strong>2008</strong> only<br />
one of the two institutions was operating. The<br />
same occurred in a second country with a high<br />
growth rate, Latvia, with a rate of 148%, and in<br />
this case the two institutions that reported data<br />
began their activity in <strong>2009</strong>. It is important,<br />
therefore, to take into consi<strong>de</strong>ration not only<br />
the percentage, but the total number of loans as<br />
the growth rate may be exaggerated as a result.<br />
The most significant growth rates that were<br />
not due to the entrance of new institutions can<br />
be found in Hungary (49%) and Italy (40%),<br />
where the sector in both countries has a greater<br />
number of participants. It is important to take<br />
into consi<strong>de</strong>ration that after reaching a certain<br />
level of maturity in the sector, more mo<strong>de</strong>rate<br />
growth rates will be noted due to diminishing<br />
rates of return. For example, France, as the<br />
country with the greatest number of loans<br />
disbursed, has a growth rate of 8%.<br />
France and Germany remain markets<br />
with strong institutional growth rates, where<br />
p<strong>la</strong>yers on a national scale (an association in<br />
France and a <strong>de</strong>velopment bank in Germany)<br />
p<strong>la</strong>y a major role. On the other hand, loans<br />
disbursed in more mature microcredit markets<br />
in the Eastern EU countries (Bulgaria, Hungary,<br />
Po<strong>la</strong>nd and Romania) did not react simi<strong>la</strong>rly,<br />
whereas Hungary grew by 49%, Bulgaria,<br />
Po<strong>la</strong>nd and Romania experienced <strong>de</strong>creasing<br />
growth rates between <strong>2008</strong> and <strong>2009</strong>.<br />
Graph 6: Growth in the number of loans disbursed <strong>2008</strong>-<strong>2009</strong><br />
35.000<br />
30.000<br />
25.000<br />
20.000<br />
15.000<br />
10.000<br />
5.000<br />
0<br />
26.709<br />
28.863<br />
France<br />
17.760<br />
16.655<br />
Po<strong>la</strong>nd<br />
11.265<br />
3.493<br />
Romania<br />
Number of loans disbursed <strong>2008</strong> Number of loans disbursed <strong>2009</strong><br />
7.709<br />
8.025<br />
Germany<br />
7.132<br />
5.172<br />
6.990<br />
Spain<br />
10.402<br />
Hungary<br />
5.040<br />
2.637<br />
Bulgaria<br />
2.709<br />
3.194<br />
Fin<strong>la</strong>nd<br />
15 Loans disbursed are counted by participating institution in the previous survey, without taking into consi<strong>de</strong>ration the difference in the number<br />
of participating institutions between 2007 and the current edition. When this information is taken into consi<strong>de</strong>ration, the growth rate between<br />
2007 and <strong>2008</strong> is 23%.<br />
1.364<br />
1.909<br />
Italy<br />
996<br />
160<br />
913<br />
864<br />
844<br />
835<br />
617<br />
880<br />
351<br />
454<br />
Note: Please refer to the Methodology chapter in regard to the comparison of UK data between <strong>2008</strong> and <strong>2009</strong>.<br />
Croatia<br />
Swe<strong>de</strong>n<br />
Belgium<br />
united Kingdom<br />
Portugal<br />
80<br />
55<br />
60<br />
149<br />
43<br />
6<br />
16<br />
572<br />
16<br />
18<br />
Ire<strong>la</strong>nd<br />
Latvia<br />
Norway<br />
Nether<strong>la</strong>nds<br />
Switzer<strong>la</strong>nd
200.000<br />
180.000<br />
160.000<br />
140.000<br />
120.000<br />
100.000<br />
80.000<br />
60.000<br />
40.000<br />
20.000<br />
25.000<br />
20.000<br />
15.000<br />
10.000<br />
5.000<br />
0<br />
0<br />
The growth in the total value of loans disbursed in the EU as a whole between <strong>2008</strong> and <strong>2009</strong><br />
was approximately -7%.<br />
Graph 7: Growth in the value of loans disbursed <strong>2008</strong> – <strong>2009</strong><br />
141.155<br />
152.610<br />
France<br />
Note: Please refer to the Methodology chapter in regard to the comparison of UK data between <strong>2008</strong> and <strong>2009</strong>.<br />
Comparing the growth in the total value<br />
of loans disbursed to the growth in the<br />
number of loans disbursed, we find that in<br />
some EU countries, loan disbursements are<br />
moving toward <strong>la</strong>rger loans and the higher<br />
end of the market. We can see this in the<br />
Graph 8: Average value of microcredit by country <strong>2008</strong>-<strong>2009</strong><br />
Fin<strong>la</strong>nd<br />
129.520<br />
147.816<br />
Germany<br />
Swe<strong>de</strong>n<br />
127.253<br />
Belgium<br />
181.897<br />
Hungary<br />
118.028<br />
Switzer<strong>la</strong>nd<br />
98.324<br />
Bulgaria<br />
68.697<br />
46.618<br />
62.151<br />
Spain<br />
Average loan size <strong>2008</strong> Average loan size <strong>2009</strong> Average eu loan size <strong>2009</strong><br />
Hungary<br />
Ire<strong>la</strong>nd<br />
20.264<br />
Romania<br />
IN THouSANDS oF euRoS<br />
Value of loans disbursed <strong>2008</strong> Value of loans disbursed <strong>2009</strong><br />
55.811<br />
Po<strong>la</strong>nd<br />
Germany<br />
86.594<br />
53.296<br />
60.871<br />
Fin<strong>la</strong>nd<br />
Spain<br />
16.412<br />
16.662<br />
10.316<br />
10.925<br />
Belgium<br />
IN euRoS<br />
Romania<br />
Italy<br />
Portugal<br />
7.625<br />
18.780<br />
Swe<strong>de</strong>n<br />
Norway<br />
3.520<br />
1.000<br />
3.279<br />
6.659<br />
Croatia<br />
Bulgaria<br />
uK<br />
France<br />
3.028<br />
3.824<br />
Portugal<br />
united Kingdom<br />
1.100<br />
800<br />
379<br />
22<br />
Ire<strong>la</strong>nd<br />
Italy<br />
Norway<br />
Croatia<br />
222<br />
215<br />
83<br />
573<br />
64<br />
11.657<br />
Switzer<strong>la</strong>nd<br />
Nether<strong>la</strong>nds<br />
Latvia<br />
Po<strong>la</strong>nd<br />
Nether<strong>la</strong>nds<br />
Latvia<br />
23
<strong>EMN</strong> <strong>2008</strong>-<strong>2009</strong> <strong>Overview</strong><br />
24<br />
average loan sizes, where the Nether<strong>la</strong>nds,<br />
along with the United Kingdom and<br />
Hungary have all increased their average<br />
loan sizes. This implies that there has been<br />
a change in the type of clients targeted. This<br />
trend could also be found in the previous<br />
survey. This time we encounter countries<br />
disbursing <strong>la</strong>rge loans, e.g. Fin<strong>la</strong>nd with an<br />
average loan size of 17,029 euros in <strong>2009</strong>,<br />
or countries at the “low loan” end of the<br />
market increasing their average loan size,<br />
such as the United Kingdom, Italy, the<br />
Nether<strong>la</strong>nds and Latvia.<br />
Table 5: Average Loan Size<br />
Further discussion of average loan<br />
values and adjustment for country income<br />
(GNI per capita) is provi<strong>de</strong>d in Section 5:<br />
Products and Services.<br />
3.4 Actors<br />
The European microcredit sector continues<br />
to be diverse with respect to institutional<br />
types, organisational size and focus.<br />
Institutional Types<br />
A variety of types of institution disburses<br />
microloans in the EU. There are nongovernmental<br />
organisations, foundations,<br />
government bodies, savings banks, banks,<br />
credit unions, cooperatives, Community<br />
Development Finance Institutions and nonbank<br />
financial institutions. This diversity<br />
is re<strong>la</strong>ted to the regu<strong>la</strong>tory environment in<br />
each country. In this edition of the survey,<br />
As a whole, the weighted average loan<br />
size across the sample has <strong>de</strong>creased in<br />
recent years from 11,002 euros in 2007 to<br />
9,641 in <strong>2009</strong>. The average loan size in the<br />
Eastern EU countries (Bulgaria, Hungary,<br />
Po<strong>la</strong>nd, Romania and Slovakia) was 10,588<br />
euros, about 200 Euros less than in the<br />
previous survey (10,728). In the Western EU<br />
countries, the average loan size amounts<br />
to 8,810 euros, compared to the 11,061<br />
euros reported in the <strong>la</strong>st survey, which<br />
is a significant <strong>de</strong>cline. In general, a <strong>la</strong>rge<br />
majority of the Western European countries<br />
have reduced their average loan size.<br />
2007 <strong>2008</strong> <strong>2009</strong><br />
Average loan size 11,002 9,373 9,641<br />
all participating institutions respon<strong>de</strong>d<br />
to this question. In Spain, Germany and<br />
Fin<strong>la</strong>nd, lending activity is restricted to<br />
banking or government agencies. In the UK,<br />
non-governmental organisations that lend<br />
have a specific legal status as “community<br />
<strong>de</strong>velopment finance institutions”.<br />
Sixty percent of respon<strong>de</strong>nts have a not-forprofit<br />
status. This percentage has <strong>de</strong>creased<br />
compared to the seventy-seven percent<br />
reported in 2007. There are also a <strong>la</strong>rger<br />
number of banks that are entering the sector<br />
and having an increased presence in the field,<br />
such as MicroBank of La Caixa in Spain.<br />
NGOs and foundations are the most<br />
common types of microlen<strong>de</strong>r, which is the<br />
same as in the previous survey. The second<br />
most common type of microlen<strong>de</strong>rs is other<br />
institutional types. These institutions are<br />
mainly microfinance associations and other<br />
religious institutions, which are mostly found<br />
in Italy.<br />
Graph 9: Percentage of microlen<strong>de</strong>rs by institutional type<br />
30%<br />
25%<br />
20%<br />
15%<br />
10%<br />
5%<br />
0%<br />
26%<br />
NGo or<br />
Foundation<br />
23%<br />
16%<br />
other Non-bank<br />
Financial<br />
Institution<br />
11%<br />
8%<br />
CDFI Credit union /<br />
cooperative<br />
6%<br />
Savings<br />
Bank<br />
5% 5%<br />
Bank Government<br />
body
uK<br />
Switzer<strong>la</strong>nd<br />
Swe<strong>de</strong>n<br />
Spain<br />
Romania<br />
Portugal<br />
Po<strong>la</strong>nd<br />
Norway<br />
Nether<strong>la</strong>nds<br />
Lithuania<br />
Latvia<br />
Italy<br />
Ire<strong>la</strong>nd<br />
Hungary<br />
Germany<br />
France<br />
Fin<strong>la</strong>nd<br />
estonia<br />
Croatia<br />
Bulgaria<br />
Belgium<br />
The graph below shows the various<br />
types of institutions per country. In Estonia,<br />
Hungary, Ire<strong>la</strong>nd, Latvia, Norway, Spain<br />
and Switzer<strong>la</strong>nd, fifty percent or more of the<br />
responding institutions are NGOs. In France,<br />
the sector is divi<strong>de</strong>d equally between banks,<br />
NGOs, non-bank financial institutions and<br />
saving banks. In Spain, the second highest<br />
number of microcredit provi<strong>de</strong>rs is represented<br />
by savings banks, which cover risk with<br />
their “social work” funds. These funds are<br />
managed mainly through foundations created<br />
by the savings banks where the microcredit<br />
programmes are located.<br />
Graph 10: Number of microlen<strong>de</strong>rs by institutional type per country<br />
0 5<br />
10 15 20 25 30 35<br />
Bank Credit union Government NGo NBFI Savings Bank CDFI other<br />
Microlending as a proportion<br />
of activity portfolio<br />
In addition to c<strong>la</strong>ssifying len<strong>de</strong>rs by<br />
mission statement, data shows that len<strong>de</strong>rs<br />
can be broken down into two further<br />
groups: those which have microlending<br />
as their primary occupation and those for<br />
which microlending constitutes a re<strong>la</strong>tively<br />
small proportion of their activity portfolio.<br />
All 170 institutions respon<strong>de</strong>d to this<br />
question. Twenty-four percent of respon<strong>de</strong>nts<br />
are involved only in microlending, compared<br />
to 28% in 2006/07 and 16% in 2004/05<br />
(<strong>EMN</strong>, <strong>2008</strong>). It can be noted, however, that<br />
during the <strong>la</strong>st six years, the proportion of<br />
microfinance institutions that are <strong>de</strong>dicated<br />
exclusively to microfinance in Europe<br />
has fluctuated very little and remains a<br />
re<strong>la</strong>tively small percentage. The remaining<br />
76% of respon<strong>de</strong>nts are <strong>de</strong>dicated to other<br />
complementary activities. For example, 17%<br />
of institutional respon<strong>de</strong>nts are traditional<br />
banks, whereas the rest of the institutions<br />
are focused on other activities such as:<br />
business <strong>de</strong>velopment services (BDS) (35%),<br />
entrepreneurship training (25%), business<br />
incubator (15%) and financial education<br />
programmes (13%). In the United Kingdom,<br />
many institutions lend over 25,000 euros,<br />
and this lending activity makes up a <strong>la</strong>rge<br />
percentage of their overall portfolio.<br />
Looking at the re<strong>la</strong>tive weight of<br />
microlending in this diverse activity<br />
portfolio, we can see that for almost half<br />
(49%) of survey respon<strong>de</strong>nts in the EU,<br />
microlending represents 25% or less of their<br />
activity portfolio. This group is ma<strong>de</strong> up<br />
25
<strong>EMN</strong> <strong>2008</strong>-<strong>2009</strong> <strong>Overview</strong><br />
26<br />
of foundations and NGOs (32%), banking<br />
institutions (banks and savings banks)<br />
(28%) and government bodies (10%). All<br />
these figures are very simi<strong>la</strong>r to those in the<br />
previous report where the proportion of<br />
institutions whose microfinance activities<br />
represented less than 25% was slightly<br />
lower, at 46% (<strong>EMN</strong>, <strong>2008</strong>).<br />
At the other end of the spectrum,<br />
microlending represents a significant<br />
proportion (75% to 100%) of the activity<br />
portfolio for 35% of respon<strong>de</strong>nts, the<br />
exact same percentage as the <strong>la</strong>st survey<br />
(<strong>EMN</strong>, <strong>2008</strong>) and very simi<strong>la</strong>r to the 34%<br />
of the one previous (<strong>EMN</strong>, 2006). Nonbank<br />
financial institutions represent<br />
43% of this group and foundations and<br />
NGOs 18%.<br />
The distinction between len<strong>de</strong>rs in<br />
the 0-25% range and those in the 75-<br />
100% range is important. It un<strong>de</strong>rscores<br />
that, for half of the microfinance sector,<br />
microlending is not the main focus but<br />
is one of many strategies or tools that<br />
support wi<strong>de</strong>r employment, business<br />
<strong>de</strong>velopment and financial inclusion<br />
objectives. Organisations in this half<br />
of the sector therefore likely think of<br />
themselves as social and employment<br />
<strong>de</strong>velopment organisations rather than<br />
purely financial institutions.<br />
When we compare this data with the<br />
country of the programmes, we find that<br />
nearly all the institutions that fall into<br />
the 75%-100% category are Bulgarian<br />
and Romanian institutions. In these<br />
countries, institutions have been foun<strong>de</strong>d<br />
as financial institutions to provi<strong>de</strong> access<br />
to credit to foster SME growth.<br />
On the other hand, information can<br />
be obtained about the proportion of the<br />
portfolio of different institutions that<br />
disbursed microcredit loans for different<br />
purposes. 161 institutions respon<strong>de</strong>d to<br />
the proportion of the portfolio <strong>de</strong>dicated<br />
to entrepreneurial activity. One hundred<br />
and eleven (70%) of these institutions<br />
<strong>de</strong>dicate more than 75% of their loan<br />
portfolio to entrepreneurial microloans.<br />
155 institutions respon<strong>de</strong>d to the<br />
question about the proportion of the<br />
portfolio <strong>de</strong>dicated to personal or<br />
consumption loan. As seen in the graph<br />
above, 63% of responding institutions<br />
reported that they <strong>de</strong>dicate less than 5% of<br />
their portfolio to personal or consumption<br />
lending. We can interpret this as meaning<br />
that European len<strong>de</strong>rs are following the<br />
traditional <strong>de</strong>finition of microcredit, for<br />
entrepreneurial purposes.<br />
Graph 11: Microlending as a proportion<br />
of activity portfolio<br />
Between 75-100<br />
percent<br />
36%<br />
Between 50-75<br />
percent<br />
6%<br />
Graph 12: Purpose of loan<br />
More than 75<br />
percent<br />
69%<br />
Less than 5 percent<br />
8%<br />
Between 25-50<br />
percent<br />
10%<br />
PeRCeNTAGe IN ACTIVITY PoRTFoLIo<br />
PRoPoRTIoN oF MICRoCReDIT LoANS<br />
To eNTRePReNeuRIAL ACTIVITY<br />
Nº oF ReSPoNDeNTS<br />
Less than 5 percent<br />
25%<br />
Between 5-25 percent<br />
10%<br />
Between<br />
5-25 percent<br />
23%<br />
Between 25-50<br />
percent<br />
7%<br />
Between 50-75<br />
percent<br />
6%
Case study 1:<br />
Personal microcredit<br />
Access to microcredit, not only for the creation or the <strong>de</strong>velopment of<br />
a microenterprise but also for personal purposes, can be a powerful<br />
instrument for helping exclu<strong>de</strong>d persons to improve their situation.<br />
Without access to bank credit, people are restrained to easily avai<strong>la</strong>ble<br />
consumer loans from private financial companies and moneylen<strong>de</strong>rs that are often<br />
disbursed without any check of the borrower’s credit history and at very elevated cost.<br />
This risks pushing them into the spiral of over-in<strong>de</strong>btedness. Personal microcredit<br />
differs from consumer credit because it primarily aims at improving the situation of<br />
exclu<strong>de</strong>d persons, reintegrating them into the normal banking system and preventing<br />
over-in<strong>de</strong>btedness. It serves for supporting specific needs and paying for unexpected<br />
expenses (such as health expenditure, a driving license fees, special insurance…)<br />
and purchasing durable goods. It is adapted, in terms of amount, loan term and<br />
cost to the budget situation of persons with low income, social welfare beneficiaries,<br />
persons registered negatively at the credit bureau, the el<strong>de</strong>rly or people with health<br />
problems. And it is systematically coupled with information and support such as<br />
budget advice, financial capability training and <strong>de</strong>bt settlement. Recently and often<br />
on an experimental basis, various stakehol<strong>de</strong>rs in Europe have started to <strong>de</strong>velop<br />
personal microcredit.<br />
In France 30% of the popu<strong>la</strong>tion does not have access to normal bank credit and<br />
more than 2.5 million persons are negatively registered at the credit bureau 16 . To<br />
improve this situation, the government <strong>la</strong>unched a Personal Microcredit Programme<br />
on an experimental basis in 2005 through the establishment of the Social Cohesion<br />
Fund (Fonds <strong>de</strong> Cohesion Sociale) with € 73 million over five year - a guarantee<br />
fund for both business and personal microcredit. The specificity of the programme<br />
is the close col<strong>la</strong>boration between three types of entities: the promotional bank<br />
Caisse <strong>de</strong>s Dépôts et Consignations (CDC) which manages the Social Cohesion Fund<br />
for the government and so guarantees the loans up to 50%, the banks that disburse<br />
the loans (15 banks and three financial companies are part of the programme 17 ) and<br />
the social associations that accompany the borrowers (ten national and 86 regional<br />
social support networks 18 ). Credit amounts are fixed from €300 to €3,000 over 36<br />
16 Banque <strong>de</strong> France, 31 Dec. <strong>2009</strong>.<br />
17 As of end of <strong>2009</strong>.<br />
18 As of end of <strong>2009</strong>.<br />
27
<strong>EMN</strong> <strong>2008</strong>-<strong>2009</strong> <strong>Overview</strong><br />
28<br />
months with maximum 8% APR, while<br />
actually applied APR is between 1% and<br />
6%. While uptake of the programme<br />
has been limited in the first two years<br />
of operation (2,436 loans in 2006/07),<br />
several improvements were carried out in<br />
<strong>2008</strong>. Consequently the number of loans<br />
increased significantly: until December<br />
<strong>2009</strong>, all in all 11,519 personal microloans<br />
have been disbursed with a total amount<br />
of €26,03Mn, mostly for purchasing<br />
a motor vehicle or a drivers’ license<br />
to access or consolidate employment.<br />
Evaluations show a constant positive<br />
influence of the personal microloan<br />
on the life of the beneficiaries and the<br />
programme will continue to operate.<br />
www.france-microcredit.org<br />
In Belgium, <strong>de</strong>spite re<strong>la</strong>tively low<br />
levels of exclusion (1% of the popu<strong>la</strong>tion<br />
has no access to banking services) 19 many<br />
people, especially from disadvantaged<br />
groups of the popu<strong>la</strong>tion, remain outsi<strong>de</strong><br />
of the banking system. In 2003 the<br />
alternative credit cooperative Crédal, in<br />
cooperation with public authorities and<br />
Banque <strong>de</strong> <strong>la</strong> Poste, <strong>la</strong>unched the “social<br />
consumer credit” product (“credit<br />
social accompagné”), a low interest<br />
personal microloan (5% interest rate) for<br />
unemployed persons or those receiving<br />
social allowances in Wallonia region.<br />
Finding the most a<strong>de</strong>quate solution for<br />
the borrower is the main priority of the<br />
programme, it has no commercial aims.<br />
Each microloan of between €500 and<br />
€10,000 is linked to personalised advice.<br />
In addition, Crédal <strong>la</strong>unched another<br />
personal microloan product in 2006<br />
in the Brussels region: the “prêt vert<br />
social” (social green loan), a zero interest<br />
loan between €500 and €20,000 for low<br />
income persons who would like to carry<br />
out reparations to save energy in their<br />
house. Until December 31, <strong>2009</strong>, Crédal<br />
established 6,654 telephone contacts,<br />
met 2,257 persons for an interview and<br />
provi<strong>de</strong>d 1,032 loans amounting to<br />
€3,600,000. http://www.credal.be/<br />
In Romania, 24% of the popu<strong>la</strong>tion<br />
finds it very difficult to make ends meet<br />
and be able to pay their bills while only<br />
9% find this easy 20 . Unexpected expenses<br />
thus put a significant financial pressure<br />
on households, especially on those<br />
with low-income. The credit unions<br />
or “associations of reciprocal aid”<br />
(CARs), fe<strong>de</strong>rated since 1990 un<strong>de</strong>r the<br />
umbrel<strong>la</strong> of the organization UNCAR,<br />
aim at social and financial inclusion<br />
and poverty reduction through long<br />
term loans for investment (housing,<br />
mortgages etc.), financial aid for illness,<br />
acci<strong>de</strong>nts, infirmity, <strong>de</strong>mises etc., and<br />
they are an important provi<strong>de</strong>r of<br />
personal microloans. Evolved out of the<br />
traditional savings and credit associations<br />
and formerly affiliated to the tra<strong>de</strong><br />
unions, there are today 2,300 politically<br />
in<strong>de</strong>pen<strong>de</strong>nt CARs that have remained<br />
mainly territorial and employee-based.<br />
They provi<strong>de</strong> savings products (with a<br />
special provision in the legal framework)<br />
as well as microloans, whereby 85% of<br />
their credit activity concerns personal<br />
loans. 85% of their money avai<strong>la</strong>ble for<br />
lending comes from client <strong>de</strong>posits while<br />
the rest is taken from own funds. In <strong>2008</strong><br />
and <strong>2009</strong> the CARs provi<strong>de</strong>d about<br />
500,000 microloans each year with an<br />
average amount of €980 over 12 months<br />
at 15% APR. www.uncar.ro<br />
In the UK, the credit market of doorstep<br />
len<strong>de</strong>rs and unlicensed moneylen<strong>de</strong>rs<br />
with avg. APR as high as 400%-2000%<br />
is estimated at nearly 5Mn regu<strong>la</strong>r<br />
borrowers. To tackle this problem many<br />
CDFIs (Community Development<br />
Finance Institutions) provi<strong>de</strong> personal<br />
microloans (8,794 loans in <strong>2009</strong> 21 ). For<br />
example, since 2005, Fair Finance, an<br />
ethical and socially responsible lending<br />
company, tackles unfair and usurious<br />
lending in London, and potentially<br />
the UK. Its personal loans range from<br />
£200 to £2000 at 28-35% APR and help<br />
cover emergencies and essentials. The<br />
possibility of repaying the personal loans<br />
in small weekly or monthly installments<br />
enables the borrowers not to overstretch<br />
their day-to-day budgets. From 2005-<br />
2010 Fair Finance interviewed more than<br />
3500 personal microcredit clients and<br />
has given them basic financial support. It<br />
19 European Commission, Financial service provision and Prevention of Financial Exclusion, March <strong>2008</strong>; in Belgium, the government<br />
has taken several measures to reduce financial exclusion: the 2003 Law that guarantees basic banking services to all; the existence<br />
of negative as well as positive credit register; reformed consumer credit <strong>la</strong>w; measures against over-in<strong>de</strong>btedness…<br />
20 In comparison: at EU27 average 30% of people find it easy to make ends meet, 12% find it difficult; Eurobarometer Survey<br />
on Poverty and Social Exclusion <strong>2009</strong>.<br />
21 cdfa, Insi<strong>de</strong> Out <strong>2009</strong>, The State of Community Development Finance, Dec.<strong>2009</strong>.
40<br />
35<br />
30<br />
25<br />
20<br />
15<br />
10<br />
5<br />
0<br />
has approved 2000 loans and ma<strong>de</strong> over<br />
£1.5m in loans. Eighty-five percent of<br />
the borrowers are on state benefits, 70%<br />
are women, 65% minorities, 75% live<br />
in socially rented properties, and over<br />
50% are single mothers. Up to 60% are<br />
regu<strong>la</strong>rly using high cost credit provi<strong>de</strong>rs<br />
for basic purchases and live in the cash<br />
economy. With its activity Fair Finance<br />
has saved clients an estimated £800,000<br />
in saved interest payments through<br />
the substitution of products from the<br />
moneylen<strong>de</strong>rs. www.fairfinance.org.uk<br />
Last but not least, in Spain, Microbank,<br />
the social branch of the La Caixa savings<br />
bank, has <strong>de</strong>veloped a personal microloan<br />
product with three target groups: lowincome<br />
families (unp<strong>la</strong>nned financial<br />
needs), new immigrant resi<strong>de</strong>nts (family<br />
reunion or housing expenses in the<br />
country of origin) and persons with<br />
a temporary or permanent handicap<br />
(purchasing or adapting material,<br />
Author: Stefanie Lämmermann, <strong>EMN</strong>.<br />
Age<br />
The microlending sector in Western Europe<br />
is still young, and new entrants are still being<br />
incorporated into the sector. Forty percent of<br />
organisations surveyed were active before<br />
2000. Nine institutions began lending in <strong>2008</strong><br />
Graph 13: year lending began<br />
4%<br />
1%<br />
eliminating architectural hurdles or<br />
contracting services). The “microcrédito<br />
familiar” has a maximum amount of<br />
€25,000 over six years (including 12<br />
months grace). In <strong>2009</strong> out of a total of<br />
more than 4000 microloans representing<br />
€43,439,000, 56% were for personal use.<br />
www.microbank<strong>la</strong>caixa.es<br />
Despite slight differences, these<br />
approaches have one thing in common:<br />
they are geared to the real needs of<br />
vulnerable borrowers and perfectly in line<br />
with their repayment capacities. And they<br />
are not only <strong>de</strong>livered in a transparent<br />
way, but also closely linked to information<br />
and budget advice for the borrower. All of<br />
them have shown their extreme usefulness.<br />
The elevated levels of over-in<strong>de</strong>btedness<br />
of European citizens highlight the need<br />
for more personal microcredit. This could<br />
help much more people to maintain or<br />
improve their everyday well-being and<br />
prevent over-in<strong>de</strong>btedness.<br />
PeRCeNT oF ReSPoNDeNTS<br />
15%<br />
and another nine in <strong>2009</strong>. In <strong>2008</strong>, these new<br />
entrants were mainly located in Italy and<br />
Swe<strong>de</strong>n. In <strong>2009</strong>, new entrants were located<br />
in Hungary, Italy and the Nether<strong>la</strong>nds. The<br />
next <strong>la</strong>rgest group of len<strong>de</strong>rs (36%) began in<br />
the period 2005-<strong>2009</strong>. They can be found in<br />
Italy, Germany and Spain.<br />
1980 - 1984 1985 - 1989 1990 - 1994 1995 - 1999 2000 - 2004 2005 - <strong>2009</strong><br />
20%<br />
25%<br />
36%<br />
29
<strong>EMN</strong> <strong>2008</strong>-<strong>2009</strong> <strong>Overview</strong><br />
30<br />
Staff<br />
In addition to being young, EU lending<br />
institutions have re<strong>la</strong>tively few staff members.<br />
The sector as a whole employs 9,096 people,<br />
based on the responses of 156 institutions. The<br />
two institutions with the <strong>la</strong>rgest number of<br />
employees are found in France, they employ<br />
611 and 500 people, followed by institutions<br />
in Hungary and Romania, which employ 150<br />
and 161 employees respectively. With respect<br />
to diversity and equal opportunities, 55%<br />
of the staff is female and ethnic minorities/<br />
immigrants represent 12% of the workforce.<br />
A majority, 64%, of responding institutions<br />
reports employing fewer than five people.<br />
One hundred and forty two organisations,<br />
which represent 84% of institutions surveyed,<br />
have volunteers who col<strong>la</strong>borate in their<br />
programmes and count on the work of 17,000<br />
total volunteers. Volunteers tend to assist with<br />
pre-loan screening, information provision<br />
and post-loan advice and support. This<br />
phenomenon is not observed in Eastern EU<br />
countries (Bulgaria, Hungary and Romania)<br />
where the sector is more mature and businessoriented.<br />
German organisations also tend not<br />
to rely on volunteers. In this case, the reason<br />
is re<strong>la</strong>ted to the institutional type of the<br />
organisations providing microcredit in this<br />
country. In Germany, we find government<br />
Graph 14: Staff<br />
11 - 20<br />
employees<br />
7%<br />
over 20<br />
employees<br />
15%<br />
6 - 10<br />
employees<br />
14%<br />
NuMBeR oF eMPLoYeeS<br />
0 - 5<br />
employees<br />
64%<br />
bodies that only hire government employees.<br />
In Spain there are also a low number of<br />
volunteers, as savings banks prefer to<br />
employ permanent staff with financial<br />
expertise, while relying on the support of<br />
external organisations for the provision of<br />
advice to the entrepreneurs. These external<br />
organisations do use volunteers to help with<br />
their activities.
4.1 Bankable and unbankable clients<br />
129 institutions respon<strong>de</strong>d to the question on what proportion of their clients was bankable.<br />
For these respon<strong>de</strong>nts, 40.3% of total loans were disbursed to bankable clients. Of the 146<br />
institutions that respon<strong>de</strong>d to the question on what proportion of their clients was unbankable,<br />
68.3% of loans were disbursed to unbankable clients. The majority of unbankable clients can be<br />
found in Belgium, United Kingdom and Italy (with 94%, 83% and 81% of clients, respectively).<br />
If we compare the type of client with the institutional type we can see that institutions with<br />
the highest focus on reaching unbankable clients are CDFIs (87%) and NGOs with 71%. The<br />
institutions that had the greatest percentage of bankable clients were banks (60%) and savings<br />
banks, with 56% of total clients in the bankable category.<br />
4.2 Businesses Targeted<br />
In this section, survey respon<strong>de</strong>nts were asked to i<strong>de</strong>ntify the type of businesses they<br />
supported. Organisations could choose more than one response. Graph 15 below shows the<br />
responses in regards to the age of the business supported. It can be observed that over threefourths<br />
focused on start-up businesses (78%) and more than half on existing enterprises (62%).<br />
A smaller proportion assists businesses in the pre-start-up phase, e.g. by financing feasibility<br />
studies (32%). With reference to the size of the business, 55% of the organisations supported<br />
businesses with five or fewer employees while 32% supported businesses with between five<br />
and nine staff. Twenty-four percent of respon<strong>de</strong>nts worked with unregistered informal sector<br />
businesses, which is slightly lower than the 32% reported in the previous survey (<strong>EMN</strong>, <strong>2008</strong>).<br />
All figures have witnessed a <strong>de</strong>crease across the board over the previous survey. The only<br />
increase was noted in registered businesses with five to nine employees, which grew from 30%<br />
to 45% (<strong>EMN</strong>, <strong>2008</strong>), suggesting a shift of focus from informal activity to formal businesses<br />
that employ a greater number of individuals.<br />
4.3 Client Targeting<br />
Clients<br />
4<br />
This section begins with the information collected from a recent survey released by the European<br />
Commission for the European Year for Combating Poverty and Social Exclusion (2010).<br />
To un<strong>de</strong>rstand the context of poverty in Europe, the European Commission carried out a<br />
survey in <strong>2009</strong> to conceptualize citizens’ perspectives on poverty. Seventeen percent of the<br />
EU popu<strong>la</strong>tion lives below the poverty line, set at 60% of the country’s median income level.<br />
The survey also <strong>de</strong>monstrates the importance of poverty to European citizens: nearly three-<br />
31
<strong>EMN</strong> <strong>2008</strong>-<strong>2009</strong> <strong>Overview</strong><br />
32<br />
Graph 15: Types of businesses supported<br />
Start-up<br />
enterprises<br />
existing<br />
enterprises<br />
Registered<br />
businesses<br />
with less than<br />
5 employees<br />
Registered<br />
businesses<br />
with 5-9<br />
employees<br />
entrepreneurs in<br />
the pre-start-up<br />
phase for<br />
feasibility studies<br />
Informal sector/<br />
unregistered<br />
businesses<br />
others<br />
0% 10% 20% 30% 40% 50% 60% 70% 80%<br />
15%<br />
24%<br />
32%<br />
quarters (74%) of survey respon<strong>de</strong>nts felt<br />
that the European Union has an important<br />
role to p<strong>la</strong>y in combating poverty (European<br />
Commission, <strong>2009</strong>).<br />
Eurostat, as well as <strong>EMN</strong> and the European<br />
Commission through various studies they have<br />
carried out, indicate that the groups at risk of<br />
social exclusion and poverty in the EU are:<br />
Women<br />
Single parent households<br />
(mostly hea<strong>de</strong>d by women)<br />
El<strong>de</strong>rly people<br />
Disabled people<br />
These results can be contrasted with the<br />
groups EU citizens perceive to be more<br />
susceptible of poverty, where the unemployed<br />
are perceived to be the most susceptible<br />
(56%) and the lowest group perceived to<br />
be susceptible to poverty are women (6%)<br />
(European Commission, <strong>2009</strong>).<br />
Unemployed people (56%)<br />
El<strong>de</strong>rly people (41%)<br />
People with a low level of education,<br />
training or skills (31%)<br />
Disabled people (29%)<br />
Single parents (23%)<br />
45%<br />
55%<br />
Immigrants (15%)<br />
Women (6%)<br />
62%<br />
78%<br />
In addition, three groups are particu<strong>la</strong>rly<br />
vulnerable to long-term unemployment,<br />
the primary cause of social exclusion<br />
(Facet, EVERS&JUNG, nef, 2005; European<br />
Commission, 2004; European Commission,<br />
2004a). These are:<br />
Ol<strong>de</strong>r male and female workers<br />
Men and women un<strong>de</strong>r the age of 25<br />
Immigrants and ethnic minorities<br />
Financial exclusion is a cause that can lead<br />
to social exclusion and increases vulnerability<br />
to poverty. In the EU, the main cause of<br />
financial exclusion is the <strong>la</strong>ck of access to<br />
mainstream financial services motivated by<br />
low purchasing power (<strong>la</strong>ck of col<strong>la</strong>teral or a<br />
regu<strong>la</strong>r source of income). When we refer to<br />
people exclu<strong>de</strong>d from mainstream financial<br />
services we mean those without access to cash<br />
transmission banking, savings, insurance,<br />
short-term consumer credit and long-term<br />
savings. People exclu<strong>de</strong>d from mainstream<br />
financial services may not have access to one<br />
or several of the above services consi<strong>de</strong>red<br />
essential for participation in economic life in<br />
Europe (Cartwright, 2004).<br />
For those with a particu<strong>la</strong>r interest in<br />
financial exclusion, a website has been<br />
<strong>de</strong>veloped: the European “Mutual Learning
People exclu<strong>de</strong>d<br />
from mainstream<br />
financial services<br />
on Financial Inclusion” project (December<br />
2007 - December <strong>2009</strong>) led by <strong>Réseau</strong><br />
Financement Alternatif and financed by the<br />
European Commission, DG Employment,<br />
Social Affairs and Equal Opportunities<br />
PROGRESS Programme, called the European<br />
Financial Inclusion network 22 .<br />
In regards to client targeting, thirty percent<br />
of microlen<strong>de</strong>rs surveyed stated that they<br />
do not target a specific clientele. The rest<br />
of the len<strong>de</strong>rs target one or several of the<br />
socially and financially exclu<strong>de</strong>d categories<br />
mentioned below. People exclu<strong>de</strong>d from<br />
Graph 16: Client-specific targeting<br />
Women<br />
ethnic minorities<br />
and/or immigrants<br />
unemployed<br />
people or people<br />
on welfare<br />
No client -<br />
specific targeting<br />
Youth<br />
Disabled people<br />
others<br />
urban popu<strong>la</strong>tion<br />
Rural popu<strong>la</strong>tion<br />
Thirty-eight percent of respon<strong>de</strong>nts<br />
target urban popu<strong>la</strong>tions compared to 36%<br />
in the previous survey. 32% target the rural<br />
popu<strong>la</strong>tion, representing an 8% increase<br />
over the previous survey figure of 24%.<br />
This year, the difference between urban and<br />
rural popu<strong>la</strong>tion targeted with respect to the<br />
previous survey (<strong>EMN</strong>, <strong>2008</strong>) has <strong>de</strong>creased<br />
by 6 points. In general, the countries with<br />
the highest number of institutions that focus<br />
exclusively on rural areas are Estonia, Croatia<br />
and Latvia. Moreover, we also find that of the<br />
16 Bulgarian institutions, 12 have the rural<br />
sector as its target popu<strong>la</strong>tion, with three<br />
of them exclusively <strong>de</strong>dicated to the rural<br />
sector. This is due to the re<strong>la</strong>tive poverty in<br />
the rural areas in Bulgaria. The inci<strong>de</strong>nce of<br />
rural poverty in Bulgaria is about twice as<br />
22 The European Financial Inclusion Network can be found at: http://www.fininc.eu.<br />
mainstream financial services as well as<br />
women are the most frequently i<strong>de</strong>ntified<br />
target groups by microcredit programmes in<br />
the EU (47% and 44% respectively). Ethnic<br />
minorities and immigrants and unemployed<br />
people or people on welfare are the next<br />
most frequently cited target groups. The least<br />
common groups for targeting are youth and<br />
disabled people. The financially exclu<strong>de</strong>d<br />
can also be people who are unemployed and<br />
those with either no or a poor credit history.<br />
There is thus a <strong>de</strong>gree of over<strong>la</strong>p between this<br />
group and the other risk groups referred to in<br />
the survey.<br />
0% 5% 10% 15% 20% 25% 30% 35% 40% 45% 50%<br />
12%<br />
21%<br />
30%<br />
29%<br />
32%<br />
32%<br />
38%<br />
41%<br />
high as in urban areas and the GDP per capita<br />
in rural areas is 2.2 times lower than that of<br />
urban regions (Abadjieva, <strong>2008</strong>). In Germany,<br />
Fin<strong>la</strong>nd and Belgium, the opposite occurs,<br />
institutions are lending exclusively in urban<br />
areas. In France, Spain and Italy, institutions<br />
work in both areas.<br />
Gen<strong>de</strong>r Ba<strong>la</strong>nce<br />
44%<br />
47%<br />
In <strong>2009</strong>, 27% of EU microloan clients were<br />
women, a <strong>de</strong>cline of 17% from the figure of<br />
44% in 2007 (<strong>EMN</strong>, <strong>2008</strong>). There appears to<br />
be a <strong>de</strong>crease in the proportion of women<br />
benefiting from microloan programmes<br />
between the present survey and the previous<br />
<strong>EMN</strong> studies on microlending to women. The<br />
first study collected data for the years 2002 to<br />
33
<strong>EMN</strong> <strong>2008</strong>-<strong>2009</strong> <strong>Overview</strong><br />
34<br />
2004 and found that 39% of microloan clients<br />
were women (<strong>EMN</strong>, 2006a). The following<br />
study collected data for the years 2004 to<br />
2005 and found that 41% of microloan clients<br />
were women (<strong>EMN</strong>, 2006). The <strong>la</strong>st study,<br />
as mentioned earlier, showed that 44% of<br />
microloans clients were women and, the<br />
newly collected data for the years <strong>2008</strong> and<br />
<strong>2009</strong> shows that 27% of microloans clients<br />
are women. There seems to have been an<br />
increasing momentum of lending to women<br />
that culminated in a peak, experienced in<br />
the previous survey (2006-2007), that is now<br />
un<strong>de</strong>rgoing a <strong>de</strong>clivity in total numbers. This<br />
is surprising given that 44% of respon<strong>de</strong>nts<br />
specifically target women. It may be noted<br />
that as the recent economic and financial crisis<br />
has impacted both men and women equally,<br />
the market may have respon<strong>de</strong>d accordingly<br />
to adjust for this external shock.<br />
As witnessed in previous studies, there<br />
are significant differences in lending rates<br />
to women across countries. The greatest<br />
percentage of female loan clients is found in<br />
Switzer<strong>la</strong>nd, followed by the Nether<strong>la</strong>nds,<br />
Portugal and Po<strong>la</strong>nd. However, it is<br />
important to note that the total number of<br />
loans disbursed verses the number of loans<br />
disbursed to women, taking note of the impact<br />
that smaller loan numbers have on the overall<br />
percentage of loans disbursed to women<br />
(Graph 18). For example the total number<br />
of loans disbursed in Switzer<strong>la</strong>nd was 18, of<br />
which half were nine women who received<br />
a microloan. The Nether<strong>la</strong>nds disbursed<br />
a total of 572 loans, of which 280 women<br />
were recipients for those responding to total<br />
number of loans disbursed. Spain, which was<br />
in first p<strong>la</strong>ce in <strong>la</strong>st survey, is situated in the<br />
7th position. This is mainly due to one of the<br />
big p<strong>la</strong>yers, which disbursed 80% of the total<br />
loans in Spain, has a ratio of women clients<br />
of 36%. The lowest lending rates based on<br />
gen<strong>de</strong>r are found in Germany, Hungary and<br />
Latvia. Once again, the small number of total<br />
loans disbursed in Latvia (149), of which two<br />
loans were to women, has an effect on the<br />
percentages. In both Hungary and Germany,<br />
women recipients make up 2% of total<br />
loans disbursed. In Hungary, 10,402 loans<br />
were disbursed with 218 loans disbursed to<br />
women and in Germany 8,207 total loans<br />
were disbursed with 190 loans for women.<br />
At the same time, the number of<br />
responses regarding loans to women with<br />
respect to the number of responses about<br />
the total number of loans disbursed, needs<br />
to be taken into consi<strong>de</strong>ration. Of the 170<br />
institutions that respon<strong>de</strong>d to the survey, 139<br />
respon<strong>de</strong>d to the question of loans disbursed,<br />
while 109 respon<strong>de</strong>d to the question of loans<br />
disbursed to women. Viewing the aggregated<br />
data by country, this inci<strong>de</strong>nt cannot be<br />
observed without noting the repercussion on<br />
the data.<br />
Graph 17: Number of loans disbursed to women by country<br />
12.000<br />
10.000<br />
8.000<br />
6.000<br />
4.000<br />
2.000<br />
0<br />
10.040<br />
France<br />
2.085<br />
Spain<br />
1.437<br />
Fin<strong>la</strong>nd<br />
881<br />
Bulgaria<br />
845<br />
Romania<br />
761<br />
Italy<br />
682<br />
Po<strong>la</strong>nd<br />
362<br />
Swe<strong>de</strong>n<br />
309<br />
Belgium<br />
229<br />
united Kingdom<br />
218<br />
Hungary<br />
217<br />
Portugal<br />
190<br />
Germany<br />
181<br />
Nether<strong>la</strong>nds<br />
36<br />
Croatia<br />
16<br />
Ire<strong>la</strong>nd<br />
9<br />
Switzer<strong>la</strong>nd<br />
3<br />
Latvia<br />
2<br />
Norway
Switzer<strong>la</strong>nd<br />
Portugal<br />
Po<strong>la</strong>nd<br />
Fin<strong>la</strong>nd<br />
Swe<strong>de</strong>n<br />
Spain<br />
Italy<br />
Belgium<br />
France<br />
Bulgaria<br />
Norway<br />
Nether<strong>la</strong>nds<br />
Ire<strong>la</strong>nd<br />
united Kingdom<br />
Romania<br />
Croatia<br />
Germany<br />
Hungary<br />
Latvia<br />
Graph 18: Percentage of women and men clients<br />
0% 10% 20% 30% 40% 50% 60% 70% 80% 90% 100%<br />
Note: Estonia and Lithuania did not disclose data on gen<strong>de</strong>r ba<strong>la</strong>nce.<br />
Women Men<br />
We do see, however, that the percentage<br />
of loans disbursed to women has dropped<br />
significantly in some countries, such as<br />
Germany, UK, Spain and Romania. In Spain,<br />
the percentage of women as recipients of loans<br />
was almost 70% in the previous survey. This<br />
has dropped to 40%. On the other hand, the<br />
percentage of women clients has risen slightly<br />
in some countries, such as Switzer<strong>la</strong>nd, Po<strong>la</strong>nd<br />
and Fin<strong>la</strong>nd when compared to the previous<br />
<strong>EMN</strong> study (<strong>EMN</strong>, <strong>2008</strong>). In Fin<strong>la</strong>nd, women<br />
represent 45% of total loans, up from about<br />
30% of loans in the previous survey.<br />
Immigrants<br />
and Ethnic minorities<br />
A study published by <strong>EMN</strong> in 2006 on<br />
immigrants’ access to microlending shows that<br />
the terms “immigrant” and “ethnic minority”<br />
are <strong>de</strong>fined differently from one country to<br />
another (<strong>EMN</strong>, 2006b). This makes analysis<br />
and comparison of data on immigrants and<br />
ethnic minorities difficult. In the present<br />
survey the following <strong>de</strong>finition was adopted<br />
and highlighted on the questionnaire in<br />
or<strong>de</strong>r to make sure that respon<strong>de</strong>nts had in<br />
mind a common <strong>de</strong>finition when providing<br />
their data: Immigrants are those individuals,<br />
not born in the country of resi<strong>de</strong>nce. Ethnic<br />
minorities are referred to as groups within a<br />
community which differs ethnically from the<br />
main popu<strong>la</strong>tion. It was <strong>de</strong>ci<strong>de</strong>d to combine<br />
the two options in one for this survey. Fiftyfour<br />
percent of the institutions respon<strong>de</strong>d to<br />
this question.<br />
According to Eurostat, the percentage<br />
of citizens of countries outsi<strong>de</strong> the EU27<br />
was 3.2% and the number of immigrants as<br />
<strong>de</strong>fined in this survey, i.e.: those individuals<br />
not born in the country of resi<strong>de</strong>nce, was<br />
6.2% in <strong>2008</strong> (Eurostat, <strong>2009</strong>), whereas in<br />
the survey 13% of microloan clients were<br />
immigrants. Immigrants and ethnic minorities<br />
are thus overrepresented in microlending<br />
when compared to their part in the total<br />
popu<strong>la</strong>tion.<br />
Once again, it is important to note the total<br />
number of loans disbursed and the impact<br />
small numbers have on the percentage of<br />
immigrant clients. The highest number<br />
of total loans to immigrants or ethnic<br />
minoritites can be found in France and Spain<br />
(Graph 19). In Ire<strong>la</strong>nd, the numbers may be<br />
skewed due to the low total number of loans<br />
disbursed, of the 55 total loans disbursed in<br />
<strong>2009</strong>, 20 of these recipients were immigrants<br />
or ethnic minorities. The countries with the<br />
lowest number of total loans disbursed to<br />
immigrants and ethnic minorities can be<br />
found in Switzer<strong>la</strong>nd, followed by Norway.<br />
35
<strong>EMN</strong> <strong>2008</strong>-<strong>2009</strong> <strong>Overview</strong><br />
36<br />
Graph 19: Number of loans disbursed to immigrants by country<br />
6.000<br />
5.000<br />
4.000<br />
3.000<br />
2.000<br />
1.000<br />
0<br />
5.557<br />
France<br />
2.336<br />
Spain<br />
564<br />
Italy<br />
262<br />
Swe<strong>de</strong>n<br />
106<br />
Germany<br />
105<br />
Nether<strong>la</strong>nds<br />
In Graph 19, the country with the greatest<br />
percentage of immigrant clients is found in<br />
Norway (83%), which disbursed re<strong>la</strong>tively<br />
few microloans (six total) with five of them<br />
to immigrants. The second country with the<br />
greatest percentage of microloans disbursed<br />
to immigrants was Spain. This country has<br />
experienced strong immigrant inflows in the<br />
past years. Currently, immigrants represent<br />
11.6% of the total Spanish popu<strong>la</strong>tion, of<br />
which 7% are citizens from outsi<strong>de</strong> the EU<br />
(Eurostat, <strong>2009</strong>). In terms of the percentage<br />
of immigrant microloan clients, Spain is<br />
followed by countries such as Ire<strong>la</strong>nd (36%),<br />
Swe<strong>de</strong>n (30%) and Italy (30%).<br />
In many countries with a high proportion<br />
of foreign popu<strong>la</strong>tion, immigrants are<br />
completely unrepresented in microcredit<br />
client portfolios. This is the case of Germany,<br />
with an immigrant popu<strong>la</strong>tion of 8.8%, where<br />
of the 8207 total loans disbursed in <strong>2009</strong>,<br />
only 106 were disbursed to immigrants or<br />
ethnic minorities. Eastern EU countries such<br />
as Po<strong>la</strong>nd, Romania and Bulgaria, with no<br />
96<br />
Bulgaria<br />
immigrant popu<strong>la</strong>tions, consequently do not<br />
have immigrant microcredit clients 23 .<br />
youth<br />
Youth (18 to 25 years) is becoming a relevant<br />
client microcredit segment in the EU. In 2007,<br />
12% of microcredit clients were young people,<br />
and nowadays, the youth popu<strong>la</strong>tion represents<br />
10% of microcredit clients. This percentage is in<br />
line with the 12.5% percentage of young people<br />
(15 to 24 years) living in the analysed countries<br />
in 2007 (Eurostat, 2007). Moreover, young people<br />
are represented well over their proportion in<br />
the popu<strong>la</strong>tion of young entrepreneurs 24 . The<br />
greatest percentage of young microloan clients is<br />
found in Switzer<strong>la</strong>nd (100%) by one institution<br />
whose principal focus is youth and all loans<br />
over the period <strong>2008</strong>-<strong>2009</strong> have been disbursed<br />
to youth. Ire<strong>la</strong>nd follows closely at 91% of loans<br />
being disbursed to youth, with 70 of the 80<br />
loans disbursed in <strong>2008</strong> and 50 of the 55 loans<br />
disbursed in <strong>2009</strong> to youth. The United Kingdom<br />
is the next highest len<strong>de</strong>r to youth at 57%.<br />
23 However, it is unclear in the survey responses, whether the institutions have not provi<strong>de</strong>d data on immigrants because they do not target this<br />
at risk group or because they have left out this category.<br />
24 Youth entrepreneurship represents less than 1% of total entrepreneurship across the EU 15, although more than 50% of young people express<br />
an interest in starting a business. Young people are three times as likely to be unemployed as ol<strong>de</strong>r people in the EU (Greene, 2005).<br />
50<br />
united kingdom<br />
35<br />
Hungary<br />
31<br />
Portugal<br />
21<br />
Romania<br />
20<br />
Croatia<br />
20<br />
Ire<strong>la</strong>nd<br />
5<br />
Norway<br />
4<br />
Switzer<strong>la</strong>nd
Norway<br />
Spain<br />
Ire<strong>la</strong>nd<br />
Swe<strong>de</strong>n<br />
Italy<br />
Switzer<strong>la</strong>nd<br />
France<br />
Nether<strong>la</strong>nds<br />
Croatia<br />
Portugal<br />
united Kingdom<br />
Bulgaria<br />
Germany<br />
Romania<br />
Hungary<br />
Po<strong>la</strong>nd<br />
Latvia<br />
Switzer<strong>la</strong>nd<br />
Ire<strong>la</strong>nd<br />
united Kingdom<br />
Nether<strong>la</strong>nds<br />
Italy<br />
France<br />
Spain<br />
Belgium<br />
Portugal<br />
Romania<br />
Bulgaria<br />
Hungary<br />
Germany<br />
Swe<strong>de</strong>n<br />
Po<strong>la</strong>nd<br />
Norway<br />
Latvia<br />
Croatia<br />
Graph 20: Percentage of immigrants versus nationals<br />
0% 10% 20% 30% 40% 50% 60% 70% 80% 90% 100%<br />
Inmigrants Nationals<br />
Note: Belgium, Estonia, Fin<strong>la</strong>nd and Lithuania did not disclose data on immigrant clients.<br />
Graph 21: Percentage of youth versus those over 25 years old<br />
0% 10% 20% 30% 40% 50% 60% 70% 80% 90% 100%<br />
Note: Estonia, Fin<strong>la</strong>nd and Lithuania did not disclose data on youth.<br />
Young More than 25 years<br />
In Graph 22 below, the number of total loans<br />
disbursed to youth by country can be found.<br />
The country with the greatest total numbers<br />
was France, with 5,105 of the total 28,863 loans<br />
disbursed were disbursed to youth, followed by<br />
Spain with 810 loans and the United Kingdom<br />
with just over 500 loans disbursed to youth.<br />
Germany, once again, had the lowest number of<br />
total loans disbursed to youth at 9 out of the total<br />
8,207 loans disbursed.<br />
37
<strong>EMN</strong> <strong>2008</strong>-<strong>2009</strong> <strong>Overview</strong><br />
38<br />
Graph 22: Number of loans disbursed to youth by country<br />
6.000<br />
5.000<br />
4.000<br />
3.000<br />
2.000<br />
1.000<br />
0<br />
5.105<br />
France<br />
810<br />
Spain<br />
504<br />
united kingdom<br />
366<br />
Italy<br />
117<br />
Nether<strong>la</strong>nds<br />
106<br />
Hungary<br />
93<br />
In the graph below, we summarise the percentage of clients from at-risk groups in each<br />
country in <strong>2009</strong>.<br />
Graph 23: Client targeting of the institutions by country<br />
100%<br />
90%<br />
80%<br />
70%<br />
60%<br />
50%<br />
40%<br />
30%<br />
20%<br />
10%<br />
0%<br />
Belgium<br />
Bulgaria<br />
Croatia<br />
estonia<br />
Fin<strong>la</strong>nd<br />
France<br />
Germany<br />
Hungary<br />
Belgium<br />
Italy<br />
84<br />
Romania<br />
Latvia<br />
50<br />
Ire<strong>la</strong>nd<br />
Nether<strong>la</strong>nds<br />
46<br />
Bulgaria<br />
Norway<br />
29<br />
Portugal<br />
Portugal<br />
Women ethnic minorities and / or inmigrants Youth<br />
Note: Ire<strong>la</strong>nd, Lithuania and Po<strong>la</strong>nd did not disclose data on at-risk groups.<br />
18<br />
Switzer<strong>la</strong>nd<br />
Romania<br />
Spain<br />
9<br />
Germany<br />
Swe<strong>de</strong>n<br />
Switzer<strong>la</strong>nd<br />
united Kingdom
It is unclear in these instances whether a<br />
<strong>la</strong>ck of data means the len<strong>de</strong>r does not finance<br />
a particu<strong>la</strong>r client group or whether the len<strong>de</strong>r<br />
simply does not track this sort of information.<br />
The above graph shows the percentage of<br />
institutions that respon<strong>de</strong>d that they targeted<br />
one or more of these groups as potential clients.<br />
As can been seen in Spain, 90% of institutions<br />
targeted immigrants as clients, 80% women and<br />
60% youth. However, it is important to treat this<br />
data with caution as it refers to the institutional<br />
objective and not the total number of at-risk<br />
clients in the overall portfolio – this information<br />
can be found in Graphs 17 to 22. Moreover, the<br />
institutions could respond that they had more<br />
than one at-risk group as a target. Finally, it is<br />
important to note that in Switzer<strong>la</strong>nd, Latvia,<br />
Fin<strong>la</strong>nd, Croatia and Estonia, only one institution<br />
reported data.<br />
4.4 Marketing<br />
In the EU, 17% of the popu<strong>la</strong>tion is at risk of<br />
poverty and it is revealed that two in 10 adults in<br />
EU-15 and almost half in EU-10 (47%) do not have<br />
a bank account while many more have no savings<br />
and <strong>la</strong>ck access to credit (Eurostat, <strong>2009</strong>). These<br />
numbers <strong>de</strong>monstrate that the proportion of the<br />
popu<strong>la</strong>tion that may benefit from microcredit in<br />
the EU is smaller than in <strong>de</strong>veloping countries.<br />
In addition, these prospective clients may be<br />
har<strong>de</strong>r to reach as potential microloan clients<br />
Graph 24: Marketing methods<br />
Referrals<br />
Community<br />
outreach<br />
Public<br />
Re<strong>la</strong>tions<br />
Mass Media<br />
advertising<br />
Targeted<br />
advertising<br />
other<br />
are geographically dispersed and exclu<strong>de</strong>d<br />
from mainstream communication due to years<br />
of unemployment or activity in the informal<br />
economy. As a result, significant outreach and<br />
marketing is nee<strong>de</strong>d to reach these prospective<br />
clients in the EU.<br />
In this section of the survey, institutions were<br />
asked which marketing methods were utilized,<br />
comparing those commonly used by len<strong>de</strong>rs to<br />
those that they consi<strong>de</strong>r to have a greater success<br />
rate. Len<strong>de</strong>rs surveyed often employ several<br />
marketing strategies simultaneously. Over 70%<br />
of respon<strong>de</strong>nts stated that referrals were used<br />
most commonly to attract loan clients and that<br />
they were also the most successful medium used.<br />
This result implies that len<strong>de</strong>rs should emphasise<br />
communication with referring agencies such<br />
as business support services, employment<br />
services and community aid groups, as these<br />
groups would be beneficial for the microfinance<br />
institution. Community outreach is the next most<br />
commonly utilized medium, followed by public<br />
re<strong>la</strong>tions, mass media advertising, and finally,<br />
targeted advertising. Contrary to the previous<br />
survey, mass media is now being used more<br />
than targeted advertising, in spite of mass media<br />
being a more expensive medium. This change<br />
could be due to the incorporation of traditional<br />
banks and savings banks that can <strong>de</strong>dicate part<br />
of their publicity portfolio to the microcredit<br />
product, reaching a broa<strong>de</strong>r audience. Graph 24<br />
summarizes this information.<br />
0% 10% 20% 30% 40% 50% 60% 70% 80%<br />
Methods used Most succesful methods<br />
39
<strong>EMN</strong> <strong>2008</strong>-<strong>2009</strong> <strong>Overview</strong><br />
40<br />
5 Products and services<br />
As can be observed in the previous surveys, len<strong>de</strong>rs offer a wi<strong>de</strong> range of varying<br />
conditions for their microloans across the different European countries. The<br />
loan packages across len<strong>de</strong>rs have varying loan terms, interest rates, loan fees,<br />
guarantees and loan sizes. Loans are adapted to the missions of the len<strong>de</strong>rs and<br />
their risk coverage abilities.<br />
5.1 Loan Terms<br />
One hundred and sixty two institutions respon<strong>de</strong>d to the question regarding their loan<br />
terms. The minimum loan repayment term offered by organisations responding to this survey<br />
is less than six months and extends to a maximum of eight years. Graph 25 shows that the<br />
most common current average loan term is 3 years followed by between 5 and 4 years. This<br />
shows that on average loan terms have not varied much in respect to the previous survey.<br />
Graph 25: Percentage of Respon<strong>de</strong>nts by Average Loan Term<br />
5 Years<br />
21%<br />
1 Year<br />
6%<br />
4 Years<br />
16%<br />
7 Years<br />
1%<br />
8 Years<br />
or more<br />
1%<br />
6 Years<br />
6%<br />
2 Years<br />
15%<br />
3 Years<br />
35%
25%<br />
20%<br />
15%<br />
10%<br />
5%<br />
0%<br />
Eighty percent of respon<strong>de</strong>nts indicated<br />
that they offer grace periods of varying<br />
lengths. The mean grace period is 6 months,<br />
the maximum is 24 months and the minimum<br />
is 1 month, exactly the same as seen in the<br />
previous survey.<br />
5.2 Interest Rates<br />
One hundred and thirty two institutions<br />
respon<strong>de</strong>d to this question. The average<br />
interest rate charged across survey<br />
respon<strong>de</strong>nts is 9%, one percentage point<br />
above the average of the previous survey.<br />
Graph 26: Average interest rate by country<br />
22,2%<br />
uK<br />
17,0%<br />
Po<strong>la</strong>nd<br />
16,9%<br />
Romania<br />
14,3%<br />
Bulgaria<br />
11,0%<br />
Croatia<br />
9,0%<br />
Ire<strong>la</strong>nd<br />
8,6%<br />
Spain<br />
8,3%<br />
Nether<strong>la</strong>nds<br />
7,8%<br />
Hungary<br />
7,0%<br />
estonia<br />
Interest rates are re<strong>la</strong>ted to the existence<br />
of usury <strong>la</strong>ws. At the present time, nearly<br />
all EU countries have usury rates or rate<br />
ceilings in or<strong>de</strong>r to protect consumers<br />
against over-in<strong>de</strong>btedness and predatory<br />
lending practices. Only two countries have<br />
a specific <strong>la</strong>w regarding the regu<strong>la</strong>tion of the<br />
microfinance sector, France and Romania<br />
(European Commission, 2007a). Where usury<br />
<strong>la</strong>ws are in p<strong>la</strong>ce, len<strong>de</strong>rs must not charge<br />
above these stated maximums. Interest caps,<br />
when not too low, enable len<strong>de</strong>rs to establish<br />
an a<strong>de</strong>quate interest rate that covers their<br />
operational and financial costs. In the UK and<br />
Romania, however, which do not have these<br />
types of restrictions, we find higher average<br />
interest rates. In fact, amongst UK len<strong>de</strong>rs<br />
participating in survey, the maximum interest<br />
6,7%<br />
Swe<strong>de</strong>n<br />
Graph 26 shows the average interest rate by<br />
country. The highest interest rate charged<br />
is 22.2% in the United Kingdom and the<br />
lowest interest rate charged is 2% in Fin<strong>la</strong>nd.<br />
As a reference, at the time of the survey, the<br />
average Euribor rate in <strong>2009</strong> was 5%. We<br />
continue to find that there is a re<strong>la</strong>tionship<br />
between high interest rates and the mission<br />
statements and legal status of the len<strong>de</strong>rs. In<br />
Eastern EU countries (Romania, Bulgaria and<br />
Po<strong>la</strong>nd) where a greater number of for-profit<br />
organisations are found and SME financing<br />
is a means of reaching sustainability, interest<br />
rates tend to be higher in or<strong>de</strong>r to price for<br />
risk and for operating and financial costs.<br />
rate charged was 36% and the minimum 5%,<br />
<strong>de</strong>monstrating a wi<strong>de</strong> range of practices when<br />
rates are unrestricted. France is the only other<br />
country without interest rate caps on loans to<br />
individual entrepreneurs 25 . This has enabled<br />
the <strong>la</strong>rgest French microcredit organisation to<br />
increase its interest rate by around 4% since<br />
2005, and it now sits at 9.71% which is in the<br />
lower range when compared to the other<br />
countries (see Graph 26 26 ). This example<br />
shows that the lifting of the interest rate cap<br />
for organisations that operate in the field of<br />
social inclusion does not necessarily lead to<br />
usury.<br />
The issue of interest rates and their<br />
possible impact on the financial sustainability<br />
of microfinance institutions needs to be<br />
25 In France, the usury rate for loans to individual entrepreneurs was abolished through article 7 of the n°2005-882 <strong>la</strong>w of 02/08/2005 in favour<br />
of SMEs.<br />
26 The average 4.8% interest rate for France can be exp<strong>la</strong>ined by the fact that the so-called “prêts d’honneur”, zero- interest quasi-equity loans<br />
that are connected to a bank loan have been taken into account.<br />
6,0%<br />
Latvia<br />
6,0%<br />
Norway<br />
4,8%<br />
France<br />
4,7%<br />
Belgium<br />
4,5%<br />
Germany<br />
4,0%<br />
Lithuania<br />
4,0%<br />
Switzer<strong>la</strong>nd<br />
3,7%<br />
Italy<br />
3,0%<br />
Portugal<br />
2,0%<br />
Fin<strong>la</strong>nd<br />
41
<strong>EMN</strong> <strong>2008</strong>-<strong>2009</strong> <strong>Overview</strong><br />
42<br />
ba<strong>la</strong>nced against the interest of clients and the<br />
mission of microfinance, namely to provi<strong>de</strong><br />
loans to the financially and socially exclu<strong>de</strong>d.<br />
Funding microfinance solely through<br />
income <strong>de</strong>rived from loans may well impact<br />
negatively on the clients as their often low<br />
and variable incomes may not be enough to<br />
cover interest repayments. The abolishment<br />
or absence of a cap can, for example, lead to<br />
excessive interest rates. In the UK, APRs on<br />
loans from commercial consumer len<strong>de</strong>rs<br />
usually exceed 150% APR, and cases of<br />
2000% APR are no rarity. It is also not clear<br />
if the abolition of interest rate caps can lead<br />
to financial sustainability - at the moment, no<br />
microlen<strong>de</strong>r in the UK can fund its operations<br />
solely from revenue <strong>de</strong>rived from loans -<br />
which is testimony to the social mission of the<br />
sector not to charge usurious levels of interest.<br />
This social mission needs to be bolstered and<br />
supported - the example of France is a case<br />
where this has been achieved but it can by no<br />
means be taken for granted that MFIs across<br />
Europe will keep interest rates low. Mission<br />
drift is a real danger if the goal of social<br />
inclusion and poverty alleviation is lost from<br />
sight. If social inclusion is to stay at the heart<br />
of microfinance, it will by its very nature reach<br />
out to the poorest and most exclu<strong>de</strong>d groups<br />
- a costly un<strong>de</strong>rtaking that needs public or<br />
private support (see also Credit with a Social<br />
Mission - http://www.neweconomics.org/<br />
publications/credit-social-mission).<br />
In addition, as stated in the <strong>EMN</strong> report<br />
(2006), interest rate charges and interest<br />
rate ceilings remain an important strategic<br />
issue for the sector as this allows len<strong>de</strong>rs<br />
to achieve operational self-sustainability 27 .<br />
For more information about operational<br />
self-sustainability, please refer to Chapter<br />
8.1, Operational Self-Sufficiency Rate. In<br />
the EU only 40% of microcredit institutions<br />
are operationally self-sufficient. Although<br />
sustainability is the number one goal for<br />
institutions, there are a number of factors<br />
working against its success, one of these<br />
being interest rate ceilings.<br />
5.3 Loan Fees<br />
Graph 27: Types of fees charged by microlen<strong>de</strong>rs<br />
25%<br />
20%<br />
15%<br />
10%<br />
5%<br />
0%<br />
23%<br />
18%<br />
Loan processing fee other<br />
Seven percent of responding institutions<br />
participated in the section regarding loan<br />
fees, which is dramatically lower than the<br />
previous survey where 49% of institutions<br />
respon<strong>de</strong>d that they charged loan fees. Of the<br />
various types of loan fees, loan processing<br />
fees are the most common followed by loan<br />
application fees and loan closing fees. Some<br />
of the fees that institutions mentioned as<br />
“other” are: cancel<strong>la</strong>tion fees, security and<br />
insurance, administration and management<br />
fees, amongst others. These fees, in addition<br />
to interest rate charges, are another means<br />
of covering operational costs and risk in<br />
or<strong>de</strong>r to reach sustainability. The percentage<br />
of fees charged has changed with respect to<br />
the previous survey. Loan application fees,<br />
which were the principal fees charged in 2007<br />
dropped to the third most important, and<br />
loan processing fees jumped to the main fee<br />
charged on borrowers for this survey.<br />
PeRCeNT oF ReSPoNDeNTS<br />
27 Operational self-sustainability refers to the len<strong>de</strong>r’s ability to cover operational expenses through operating revenue (interest and fees). Financial<br />
self-sustainability refers to the len<strong>de</strong>r’s ability to cover not only operational expenses, but also the cost of borrowing and loan loss provision<br />
through operating revenue. However, operational sustainability is often used to refer both to operational and financial sustainability.<br />
15%<br />
Loan application fee<br />
9%<br />
Loan closing fee<br />
1%<br />
BDS fees
5.4 Guarantees<br />
Risk can be mitigated by securing loans<br />
through col<strong>la</strong>tera 28 , guarantors 29 , guarantee funds,<br />
personal savings and peer group pressure. In<br />
Eastern EU countries such as Hungary, Bulgaria,<br />
Latvia and Romania, where achieving operational<br />
sustainability is a major goal, most organisations<br />
make secured loans through col<strong>la</strong>teral.<br />
For clients, however, the need to provi<strong>de</strong><br />
financial or in-kind guarantees may be difficult<br />
if not impossible and potential borrowers may<br />
be exclu<strong>de</strong>d. According to <strong>EMN</strong> (2006b), this<br />
appears to be an issue of particu<strong>la</strong>r importance<br />
to women and immigrant borrowers. Taking into<br />
account the significance of these two risk groups<br />
in the microcredit sector in Europe, it may not be<br />
surprising that 59% of respon<strong>de</strong>nts (16% more<br />
than the <strong>la</strong>st survey), make unsecured loans with<br />
the aim of providing financial funds to those with<br />
no access to credit due to their <strong>la</strong>ck of income or<br />
assets. These types of len<strong>de</strong>r offer microloans<br />
observing the main principles of microcredit<br />
without guarantees.<br />
Many countries require guarantees that take<br />
the form of the State, the European Union or other<br />
banks that guarantee funds, which could be a<br />
Graph 28: Loan security<br />
No guarantee<br />
Bank/ public/eu<br />
Guarantee Programme<br />
Col<strong>la</strong>teral<br />
Guarantee<br />
Friend or Family<br />
Peer Group Guarantee<br />
Borrower contribution<br />
Personal Savings<br />
5.5 Loan size<br />
The standard <strong>de</strong>finition for microloans in<br />
Europe is loans of 25,000 euros or less. However,<br />
the average loan size provi<strong>de</strong>d by the microlen<strong>de</strong>rs<br />
surveyed ranges from 220 euros to 37,000 euros.<br />
Loans above the 25,000 euro limit are offered by<br />
result of new strategies that are being un<strong>de</strong>rtaken<br />
by governments or the European Union to<br />
strengthen the microcredit sector through specific<br />
programs. Due to these requirements, 52%<br />
of respon<strong>de</strong>nts stated that banks, national or<br />
supranational programmes are used to guarantee<br />
loans. Another way to secure a loan is with<br />
col<strong>la</strong>teral or by obtaining a guarantee from a friend<br />
or a family member (guarantor) who accepts legal<br />
responsibility for all or a portion of the value of<br />
the loan or loan ba<strong>la</strong>nce and fees at the time of<br />
<strong>de</strong>fault. Col<strong>la</strong>teral and guarantees were required<br />
by 49% and 41% of the respon<strong>de</strong>nts, respectively.<br />
Microcredit using peer guarantees is used less<br />
than with other types of guarantee in Europe,<br />
probably due to the individualistic nature that<br />
makes it different from the type of community<br />
based lending seen in other parts of the world.<br />
Personal contribution in the form of savings or<br />
other personal contributions is the least common<br />
form of guarantee. This is not surprising given that<br />
microcredit works with that part of the popu<strong>la</strong>tion<br />
that is most vulnerable to external shocks that<br />
could inhibit their capacity to save regu<strong>la</strong>rly and<br />
put asi<strong>de</strong> a portion of their savings specifically for<br />
the microcredit product and not for other, more<br />
pressing needs, like lifecycle events.<br />
0% 10% 20% 30% 40% 50% 60% 70%<br />
13%<br />
12%<br />
PeRCeNT oF ReSPoNDeNTS<br />
25%<br />
one institution in Belgium, two in Hungary and<br />
another in United Kingdom that all support job<br />
creation and microenterprise promotion.<br />
The average loan size across the entire<br />
sample is 9,641 euros (please see previous<br />
Graph 68 of average loan size per country),<br />
almost 1,300 euros less than the previous<br />
28 Col<strong>la</strong>teral refers to physical assets such as a home, a car, business equipment that is offered to secure the loan.<br />
29 Guarantors refers to a guarantee provi<strong>de</strong>d by someone known to the borrower (friend or family member) who is willing to assume full or partial<br />
responsibility for repayment of the loan (sometimes this person is called a “co-signer” or “guarantor”).<br />
41%<br />
49%<br />
52%<br />
59%<br />
43
<strong>EMN</strong> <strong>2008</strong>-<strong>2009</strong> <strong>Overview</strong><br />
44<br />
survey. Adjusting average loan size by<br />
institutional type, we find that Government<br />
bodies, Community Development Finance<br />
Institutions (CDFIs) in the UK, banks and<br />
Foundations and NGOs offer greater loan<br />
sizes. The fact that the institutions offering<br />
<strong>la</strong>rger loan sizes are government agencies<br />
is due to the fact that these institutions are<br />
primarily in countries where average loan size<br />
Graph 29: Average loan size by institutional type<br />
15.852<br />
Government<br />
body<br />
11.379<br />
CDFI<br />
11.070<br />
Bank<br />
10.948<br />
NGo or<br />
Foundation<br />
The comparison between average loan size<br />
and Gross National Income per capita (GNI) will<br />
be discussed <strong>la</strong>ter in the report. This calcu<strong>la</strong>tion<br />
is used in the microfinance sector to calcu<strong>la</strong>te<br />
“<strong>de</strong>pth of outreach”, that is, the <strong>de</strong>gree of<br />
re<strong>la</strong>tive poverty of the clients being reached. This<br />
concept assumes that the smaller the loan size in<br />
Graph 30: Depth of outreach<br />
Hungary<br />
Bulgaria<br />
Romania<br />
Croatia<br />
Fin<strong>la</strong>nd<br />
Belgium<br />
Portugal<br />
Nether<strong>la</strong>nds<br />
Po<strong>la</strong>nd<br />
Swe<strong>de</strong>n<br />
Ire<strong>la</strong>nd<br />
Germany<br />
uK<br />
Spain<br />
Switzer<strong>la</strong>nd<br />
Latvia<br />
Italy<br />
France<br />
Norway<br />
IN euRoS<br />
has risen over time, as is the case of one stateowned<br />
lending institution in Swe<strong>de</strong>n that has<br />
recently raised the ceiling for microcredit loans<br />
from 10,000 to 25,000 euros. It is important to<br />
note that the NGOs are in fourth p<strong>la</strong>ce with<br />
regard to average loan size, because 34% of<br />
responding Foundations are from Hungary,<br />
where the average loan size is among the<br />
highest, after Fin<strong>la</strong>nd and Belgium.<br />
9.144<br />
Savings<br />
Bank<br />
8.340<br />
Non-bank<br />
Financial<br />
Institution<br />
8.054<br />
Credit union /<br />
cooperative<br />
6.456<br />
other<br />
re<strong>la</strong>tion to country national income, the smaller<br />
the client’s business and the poorer the client<br />
(Copestake et al., 2005). Although the data in<br />
the above graph is not adjusted for country level<br />
income, it does suggest that len<strong>de</strong>rs focused on<br />
SME and economic growth may be lending to<br />
better off clients and <strong>la</strong>rger businesses.<br />
AVeRAGe LoAN SIze AS A PeRCeNTAGe oF GNI PeR CAPITA<br />
0% 20% 40% 60% 80% 100% 120% 140% 160% 180%
The <strong>de</strong>pth of outreach calcu<strong>la</strong>tion was<br />
carried out using World Bank July <strong>2008</strong><br />
data for <strong>2008</strong> GNI per capita per country.<br />
Figures were converted from US dol<strong>la</strong>rs into<br />
euros. The adjusted figures indicate that the<br />
microloan programmes implemented in<br />
Hungary and Bulgaria are disbursing loans<br />
at over 154% and 141% of annual GNI per<br />
capita respectively. With a few exceptions,<br />
this graph reflects the country ten<strong>de</strong>ncies<br />
seen in the previous survey. Compared to<br />
the rest of the sample, it appears that the<br />
Hungarian and Bulgarian programmes are<br />
lending to businesses and individuals with<br />
very different profiles from those in the rest<br />
of the sample. A possible exp<strong>la</strong>nation for this<br />
difference is that in Hungary and Romania,<br />
all the organisations surveyed focus on<br />
Microenterprise Promotion.<br />
In the remain<strong>de</strong>r of the sample, loan sizes<br />
are below annual GNI per capita, except for<br />
Romania, which is situated a little above. In<br />
this group, average loan values are greatest<br />
in Fin<strong>la</strong>nd, and Belgium and Croatia,<br />
suggesting that <strong>la</strong>rger businesses and better<br />
off entrepreneurs benefit from microlending<br />
in these countries. It could also be noted that<br />
it is possible that with the graduation of lower<br />
income clients into higher income strata,<br />
higher loans may be nee<strong>de</strong>d. In Italy, France<br />
and Norway, by contrast, much smaller<br />
businesses appear to be targeted.<br />
These differences are also aligned with the<br />
discussions above on mission statements,<br />
institutional types and legal status.<br />
IMPoRTANCe<br />
5.7 Lending Methodology<br />
The vast majority of organisations surveyed<br />
disburse individual loans (88%). Twentyfour<br />
percent reported offering individual<br />
loans followed by loans of increasing size<br />
once previous borrowings are repaid in full<br />
+<br />
-<br />
5.6 Loan Decision<br />
Making Criteria<br />
When <strong>de</strong>ciding whether or not to<br />
approve and disburse a microloan, len<strong>de</strong>rs<br />
take a number of factors into consi<strong>de</strong>ration.<br />
The most important cited characteristics<br />
are the value of existing savings to invest<br />
in the business and the value of existing<br />
assets. The existence of guarantors,<br />
guarantees or col<strong>la</strong>teral to secure the loans<br />
are also important. The least important is<br />
the personal attitu<strong>de</strong> or character 30 and<br />
business criteria and business p<strong>la</strong>n. The<br />
results from this edition of the survey have<br />
not significantly changed from the results<br />
of the previous survey but the results are<br />
surprising, as the nature of microcredit is<br />
<strong>de</strong>signed to be character-based lending. A<br />
pattern of requiring col<strong>la</strong>teral or guarantees<br />
may be beginning as European lending is<br />
primarily individual based loans where<br />
the institutions may feel the need to<br />
protect against risk, which may be further<br />
augmented by the recent financial and<br />
economic crisis.<br />
Respon<strong>de</strong>nts ranked the importance<br />
of different criteria in the loan <strong>de</strong>cisionmaking<br />
process with 1 being the most<br />
important criterion and 3 being the least<br />
important. The figure below shows the<br />
different criteria mentioned, or<strong>de</strong>red from<br />
the most important to the least important.<br />
The answers received varied very little<br />
from the previous survey.<br />
existence of savings to invest in the business<br />
Value of existing assets<br />
existence of guarantees or guarantors<br />
Referral by a col<strong>la</strong>borating agency<br />
Avai<strong>la</strong>bility of col<strong>la</strong>teral to secure the loan<br />
Personal/character<br />
Business criteria and business p<strong>la</strong>n<br />
(stepped loans). A very small proportion<br />
offers group loans (16%). Organisations<br />
offering groups loans can be found in<br />
Bulgaria, Croatia, Estonia, France, Italy,<br />
Norway, Portugal, Spain and the UK. This<br />
is in line with the section above on col<strong>la</strong>teral<br />
and group lending.<br />
30 “Character” is one of the 5 C’s of lending (character, capacity, col<strong>la</strong>teral, conditions, capital). Character refers to making lending <strong>de</strong>cisions<br />
using evi<strong>de</strong>nce of an individual’s character in or<strong>de</strong>r to assess the likelihood of the business being well managed and of business <strong>de</strong>bt being<br />
repaid. Loan officers look at a number of factors including how loan applicants pay their bills (credit history), what their customers, suppliers,<br />
employees, community lea<strong>de</strong>rs and friends say about the client when called on as references, the expertise of the applicant, the stability of the<br />
applicant’s resi<strong>de</strong>ncy and re<strong>la</strong>tionships.<br />
45
<strong>EMN</strong> <strong>2008</strong>-<strong>2009</strong> <strong>Overview</strong><br />
46<br />
The preference for individual over<br />
group lending in Europe continues to be<br />
observed. Stepped loans and group lending<br />
are methodologies used most commonly in<br />
<strong>de</strong>veloping countries.<br />
The average time to disburse a loan, i.e.<br />
the period between date of receipt of the<br />
application from the client for a first loan and<br />
the date of the disbursement of the loan is 26<br />
days, representing a <strong>de</strong>crease of 14 days, or two<br />
weeks, compared to the previous survey. In<br />
the sample, the most frequent time period for<br />
disbursing a loan ranges from one to 30 days.<br />
However, 26% of len<strong>de</strong>rs are able to disburse<br />
loans in less than 10 days. These len<strong>de</strong>rs are<br />
mainly located in Bulgaria, Spain and Italy.<br />
5.8 Business Development<br />
Services (BDS)<br />
In the EU context, where competition is<br />
fierce and the bureaucracy to set up a new<br />
business is extreme, training and technical<br />
support are elements critical to the success of<br />
businesses. The majority of institutions offer<br />
business <strong>de</strong>velopment services (57%) on an<br />
obligatory basis, on a needs basis or when<br />
clients ask for the service. In addition, another<br />
27% offer referrals to external provi<strong>de</strong>rs of<br />
Graph 32: Business <strong>de</strong>velopment advice<br />
30%<br />
25%<br />
20%<br />
15%<br />
10%<br />
5%<br />
0%<br />
27%<br />
No,<br />
but we refer clients<br />
to organisations<br />
that do<br />
20%<br />
Yes,<br />
in some cases<br />
we require it,<br />
in others not<br />
5.9 other Financial Services<br />
<strong>Microfinance</strong> refers to the provision of a<br />
range of financial services that inclu<strong>de</strong>s small<br />
loans for enterprise <strong>de</strong>velopment but also<br />
personal loans, savings products, insurance,<br />
money transfer services, pensions, home<br />
mortgages and <strong>de</strong>bt counselling services<br />
Graph 31: Average time<br />
to disburse a loan<br />
31 - 40<br />
Days<br />
8%<br />
41 - 60<br />
Days<br />
11%<br />
21 - 30<br />
Days<br />
31%<br />
over 60<br />
days<br />
3%<br />
this service, therefore 84% of clients have<br />
external or internal access to BDS services.<br />
Only 19% of responding institutions do not<br />
provi<strong>de</strong> any kind of BDS services.<br />
PeRCeNT oF ReSPoNDeNTS<br />
20%<br />
Yes,<br />
it is obligatory<br />
19%<br />
14%<br />
No Yes,<br />
but only if a<br />
client asks for it<br />
geared towards vulnerable people without<br />
access to formal banking mechanisms.<br />
This edition of the <strong>EMN</strong> survey looked<br />
once again at the question of “other financial<br />
services” and found that a good portion of<br />
microlen<strong>de</strong>rs are providing or are testing<br />
the market for such services. However, as<br />
0 - 10<br />
Days<br />
26%<br />
11 - 20<br />
Days<br />
21%
Debt<br />
counselling<br />
Mortgages<br />
Money transfer<br />
services<br />
Insurance<br />
Savings products<br />
Personal<br />
microcredit loans<br />
stated in the 2006 report, “the sector remains<br />
dominated by microenterprise loans. On<br />
one hand the financial services sector is<br />
well <strong>de</strong>veloped. On the other hand, in many<br />
countries regu<strong>la</strong>tory environments restrict<br />
the financial activities of non-governmental<br />
organisations” (<strong>EMN</strong>, 2006, p.33).<br />
Of the total number of institutions that<br />
participated in the survey, 32 reported the<br />
percentage of loans that were allocated<br />
to personal microcredit loans out of their<br />
overall portfolio. This represents a smaller<br />
Forty-two percent of the institutions offer<br />
“other financial services”, an 8% increase<br />
over the previous survey. In Spain, savings<br />
banks and their foundations cross-sell<br />
financial products with their microcredit<br />
programme clients. They provi<strong>de</strong> consumer<br />
and personal loans, savings products,<br />
insurance, <strong>de</strong>bt counselling and to a lesser<br />
<strong>de</strong>gree money transfer and mortgage<br />
number of responding institutions than<br />
the information received in Section 3.4.2<br />
regarding microlending as a portion of overall<br />
portfolio and the percentage of portfolio<br />
<strong>de</strong>signated to enterprise or personal lending.<br />
Questions in both sections were very simi<strong>la</strong>r<br />
and the institutions that respon<strong>de</strong>d to this<br />
part of the survey may have un<strong>de</strong>rstood<br />
personal lending to be a service instead of a<br />
proportion of the overall portfolio. Of the 32<br />
responding institutions, 53% reported that<br />
personal microcredit represented 50% or<br />
more of their portfolio.<br />
Graph 33: Share of organisations providing “other” financial services<br />
0% 10% 20% 30% 40% 50% 60% 70% 80% 90% 100%<br />
CDFI<br />
NGo or foundation<br />
Bank<br />
Credit union cooperative<br />
Non-bank financial institution<br />
Savings Bank<br />
Government body<br />
other<br />
services to microenterprise clients. A<br />
<strong>la</strong>rge majority of institutions in Bulgaria,<br />
Hungary and Italy offer <strong>de</strong>bt counselling<br />
as a service separate from microcredit<br />
lending. NGOs are generally not involved<br />
in the more sophisticated financial products<br />
such as insurance, money transfers or home<br />
mortgages, but they do offer <strong>de</strong>bt counselling<br />
and personal microcredit loans.<br />
47
<strong>EMN</strong> <strong>2008</strong>-<strong>2009</strong> <strong>Overview</strong><br />
48<br />
6 Information Technology (IT)<br />
T<br />
his is a new section with respect to previous surveys introduced as a combined<br />
effort with the <strong>EMN</strong> Working Group on IT and Innovation. Consi<strong>de</strong>ring the<br />
importance of new technologies in the sector, in both <strong>de</strong>veloping and <strong>de</strong>veloped<br />
countries, it is important to keep in mind the level of computerisation of<br />
microfinance institutions in the sector.<br />
6.1 Type of IT System Used<br />
Institutions were asked about the type of software their institution used, and to assess the<br />
following questions:<br />
If they have:<br />
Management Information System 31<br />
Customer Re<strong>la</strong>tionship Management 32<br />
On-line Client Col<strong>la</strong>boration 33<br />
On-line Client Application<br />
31 MIS – An electronic system supporting the procedures of credit monitoring based on credit accounts and client records, which is suitable for<br />
monitoring individual credit accounts as well as the aggregate data of the entire credit portfolio and the analysis of its data (e.g., trend analysis).<br />
The system has to meet the requirements of three management levels:<br />
Information level 1: operative programme operation;<br />
Information level 2: control and programme co-ordination;<br />
Information level 3: strategic p<strong>la</strong>nning.<br />
As <strong>de</strong>fined by the <strong>EMN</strong> IT and Innovation Working Group.<br />
32 CRM - Customer re<strong>la</strong>tionship management (CRM) are methods that companies use to interact with customers. The methods inclu<strong>de</strong><br />
employee training and special purpose CRM software. There is an emphasis on handling incoming customer phone calls and email, although<br />
the information collected by CRM software may also be used for promotion and surveys such as those polling customer satisfaction.<br />
As <strong>de</strong>fined by the <strong>EMN</strong> IT and Innovation Working Group<br />
33 Online client col<strong>la</strong>boration - An electronic system which makes it easier to keep in touch with the clients (or for the clients to keep in touch with<br />
each other), which may inclu<strong>de</strong> messaging, file exchange and project management functions as well.<br />
As <strong>de</strong>fined by the <strong>EMN</strong> IT and Innovation Working Group.
MIS<br />
CRM<br />
on-line Client<br />
Col<strong>la</strong>boration<br />
on-line Credit<br />
Application<br />
Graph 34: Type of IT system used<br />
0% 10% 20% 30% 40% 50% 60% 70% 80% 90% 100%<br />
Yes<br />
As seen in the above graph, the most<br />
commonly used IT system is Management<br />
Information Systems (MIS), followed by<br />
Customer Re<strong>la</strong>tionship Management (CRM).<br />
The number of responding institutions<br />
that are currently using online software is<br />
quite low. Only one quarter of responding<br />
institutions use on-line client col<strong>la</strong>boration<br />
and 18% are using on-line credit applications<br />
(18%). A majority of responding institutions<br />
(59%) are using some type of MIS system and<br />
34% are using CRM systems.<br />
6.2 Rating<br />
Institutions were asked what percentage<br />
of their needs were covered by the respective<br />
software systems and to rate the software<br />
from 1 to 5 with 1 being “Excellent” and 5<br />
being “Very bad”.<br />
No<br />
Almost all institutions that that use MIS<br />
consi<strong>de</strong>r more than 75% of their needs to<br />
be covered by their software and rated their<br />
MIS as excellent or very good. The most<br />
commonly used MIS program is Credinfo,<br />
used by 10% of responding organisations, and<br />
used exclusively in Hungary. The majority<br />
of institutions (58%) that use CRM also<br />
respon<strong>de</strong>d that more than 75% of their needs<br />
were covered, and it was rated as excellent<br />
or very good by nearly every responding<br />
institution.<br />
6.3 Cost<br />
In spite of MIS being the most utilized<br />
software, it is also the most expensive, with<br />
an average monetary value of 9,300 euros,<br />
followed by CRM with an average value of<br />
4,000 euros.<br />
49
<strong>EMN</strong> <strong>2008</strong>-<strong>2009</strong> <strong>Overview</strong><br />
50<br />
7 Social Performance<br />
7.1 Mission<br />
This year’s survey gathered mission statements from the majority of the organisations<br />
participating and expan<strong>de</strong>d the mission statement to inclu<strong>de</strong> two new choices from the<br />
previous edition, women and minority empowerment. The following statements represent<br />
the seven main categories:<br />
Social inclusion and poverty reduction<br />
Job creation<br />
Microenterprise promotion<br />
Small and Medium-sized Enterprise (SME) promotion<br />
Financial inclusion<br />
Women empowerment<br />
Minority empowerment<br />
Organisations could select as many options as they <strong>de</strong>emed fit (one or more than one). As<br />
shown on the graph below, microenterprise promotion was the most popu<strong>la</strong>r option with 70%<br />
of the organisations i<strong>de</strong>ntifying this as part of their mission. The next highest responses were<br />
job creation (63% of responses), social inclusion and poverty reduction (62%) and financial<br />
inclusion (53%). Less than half of responding institutions that answered this question had<br />
SME promotion, or women or minority empowerment as part of their mission.<br />
By combining the statements above, the purpose of microcredit in Europe continues to be to<br />
support micro-business <strong>de</strong>velopment, to promote self-employment and the creation of new jobs, and to<br />
contribute to social and financial inclusion by providing access to financial services.
80%<br />
70%<br />
60%<br />
50%<br />
40%<br />
35%<br />
20%<br />
10%<br />
0%<br />
Graph 35: Microlen<strong>de</strong>r mission statements<br />
Microenterprise<br />
promotion<br />
When mission statements and institutional<br />
type are compared, variances in focus can<br />
be observed. The primary focus of NGOs<br />
and foundations is on social inclusion and<br />
poverty reduction. CDFIs, credit unions<br />
and cooperatives combine social inclusion<br />
and poverty reduction with microenterprise<br />
promotion, whereas the non-bank financial<br />
institutions are mainly concerned with<br />
microenterprise promotion. Ninety percent<br />
of Saving Banks state that their mission is job<br />
creation, and banks of all institutional types<br />
primarily concentrate on microenterprise<br />
7.2 Impact<br />
Job creation Social<br />
Inclusion<br />
and poverty<br />
reduction<br />
Financial<br />
inclusion<br />
Thanks to the combined efforts of the <strong>EMN</strong><br />
Social Performance Working Group of the<br />
<strong>EMN</strong>, questions regarding the measurement<br />
of MFI social impact in Europe were<br />
expan<strong>de</strong>d with the objective of <strong>de</strong>epening the<br />
un<strong>de</strong>rstanding of the context as well as the<br />
method of social performance in institutions.<br />
60% of organisations stated that measuring<br />
social impact on their clients’ lives was one of<br />
the activities they carried out. The different<br />
Small Women<br />
and Medium empowerment<br />
enterprise<br />
(SMe) promotion<br />
Minority<br />
empowerment<br />
promotion. Lastly, governmental bodies<br />
mainly focus on SME promotion.<br />
Comparing mission statements to the average<br />
value of loans disbursed by microlen<strong>de</strong>rs that<br />
supplied data on total loans and value of loans<br />
disbursed in <strong>2009</strong>, organizations that focused on<br />
financial inclusion and SME promotion disbursed<br />
loans above the average loan size (11,415 euros).<br />
Institutions that listed their primary focus as<br />
SME promotion disburse loans 38% higher than<br />
those that listed their focus as social inclusion<br />
and poverty reduction (8,031 euros).<br />
Table 6: EU mission statements compared to <strong>2009</strong> average loan value<br />
other<br />
Mission Statement Average <strong>2009</strong> loan value in euros<br />
Social inclusion and poverty reduction 8,031<br />
Microenterprise promotion 9,620<br />
Job creation 10,334<br />
Financial inclusion 11,732<br />
SMe promotion 13,021<br />
methods used for the measurement of social<br />
impact vary, but the most utilized methods are<br />
individual interviews with clients (30%) and<br />
staff/loan officer observations (28%). These<br />
two methods were also the most commonly<br />
used in the <strong>la</strong>st edition of the survey for years<br />
2006-2007, where the percentages were 55% for<br />
both the staff and officer observations and the<br />
individual interviews with clients. A re<strong>la</strong>tively<br />
small percentage of institutions (11%) outsource<br />
impact evaluations to third party specialists. In<br />
both the present and previous surveys, the least<br />
used method is the focus group.<br />
51
<strong>EMN</strong> <strong>2008</strong>-<strong>2009</strong> <strong>Overview</strong><br />
52<br />
Fifty-six percent of respon<strong>de</strong>nts indicated<br />
the frequency with which they monitor<br />
programme outcomes. Of this group, 42%<br />
monitor outcomes continuously, 28% annually,<br />
6% monitor outcomes every three years and<br />
3% every two years. Twenty percent of the<br />
respon<strong>de</strong>nts measure in a timeframe that was<br />
not previously mentioned.<br />
In conjunction with the Social Performance<br />
Working Group, it was <strong>de</strong>ci<strong>de</strong>d that a study<br />
for the current period would be un<strong>de</strong>rtaken<br />
in the current edition of the survey to increase<br />
the re<strong>la</strong>tive information on what impact<br />
microfinance programs in Europe have on<br />
clients. Therefore, questions that can provi<strong>de</strong><br />
a better i<strong>de</strong>a of the social and financial impact<br />
that microcredit programs could have on<br />
their clients were introduced into the survey<br />
for the first time this year. The possible impact<br />
of the microcredit program was c<strong>la</strong>ssified in<br />
five categories: economic situation, financial<br />
It is still believed that EU organisations are<br />
not carrying out thorough impact evaluations<br />
of their programmes with appropriate<br />
methodologies so that rigorous analysis can<br />
be done. There still is a lot of work to be done<br />
in this field. Impact measurement is still not<br />
carried out with the scientific rigour nee<strong>de</strong>d<br />
nor is it in the strategic p<strong>la</strong>ns and budgets of<br />
institutions, and it does not have the allocation<br />
of time or human resources that is nee<strong>de</strong>d to<br />
obtain contrastable and comparable results<br />
across countries. A supranational effort is<br />
also nee<strong>de</strong>d in or<strong>de</strong>r to establish a common<br />
methodology that allows for the comparison<br />
and verification of data. In short, further<br />
efforts on impact evaluation need to be ma<strong>de</strong><br />
across the board.<br />
More than 80% of institutions gave<br />
information re<strong>la</strong>ted to social performance.<br />
Of these, 62% measure the creation of<br />
inclusion, education, housing and other.<br />
For each one of these categories, the MFI<br />
could evaluate impact as “improved”, “no<br />
change” or “worsened”. In none of the abovementioned<br />
cases did an MFI state that they<br />
had measured a worsening in any of the<br />
aforementioned categories.<br />
Of the total institutions that respon<strong>de</strong>d in<br />
each of the categories, 97% stated that their<br />
microcredit program had resulted in an<br />
improvement in the economic situation of<br />
their clients, whereas only 3% stated that the<br />
microcredit had not caused any change. On<br />
the other hand, 84% of institutions consi<strong>de</strong>r<br />
that the microcredit program has improved<br />
the financial inclusion of their clients.<br />
When discussing the favourable impact of<br />
the microcredit program on the education<br />
and housing of their clients, the proportion<br />
<strong>de</strong>clines to 48% and 47% respectively.<br />
Graph 36: Impact of microfinance programmes on clients’ lives<br />
economic<br />
situation<br />
Financial<br />
inclusion<br />
education<br />
Housing<br />
0% 20% 40% 60% 80% 100%<br />
Improved<br />
No change<br />
employment as a direct result of their<br />
financial services. 60% monitor why clients<br />
leave their programmes, even though further<br />
information as to the reasons why they leave<br />
was not collected.<br />
Only 29% of MFIs have an official policy on<br />
environmental impact and only 17% publish<br />
results on environmental performance. Finally,<br />
only 42% publish results on social performance,<br />
but further information as to where the results<br />
were published was also not collected. More<br />
information on social performance in Europe<br />
can be found on the webpage of the Social<br />
Performance Management Research Centre<br />
(http://www.spmresourcecentre.net/) and<br />
on the webpage of the ImpAct Consortium<br />
(http://www2.ids.ac.uk/impact/), based in the<br />
United Kingdom.
90%<br />
80%<br />
70%<br />
60%<br />
50%<br />
40%<br />
35%<br />
20%<br />
10%<br />
0%<br />
Graph 37: Internal metrics and external transparency<br />
62%<br />
38%<br />
Measure<br />
employment creation<br />
60%<br />
40%<br />
Yes No<br />
42%<br />
58%<br />
Monitor drop-out Publish social<br />
performance<br />
29%<br />
71%<br />
Have own<br />
environmental Policy<br />
17%<br />
83%<br />
Publish environmental<br />
performance<br />
53
<strong>EMN</strong> <strong>2008</strong>-<strong>2009</strong> <strong>Overview</strong><br />
54<br />
8 Operational Performance<br />
W<br />
ith the aim of standardising benchmarking indicators on operational<br />
performance and contributing to a better monitoring of the sector, the survey<br />
inclu<strong>de</strong>d relevant performance measures proposed in the report “From<br />
exclusion to inclusion through microfinance” <strong>de</strong>veloped by the MFC/cdfa/<br />
<strong>EMN</strong> project (MFC, cdfa and <strong>EMN</strong>, 2007). This project addresses the sector challenge<br />
of adopting a standard set of performance monitoring ratios and standard methods for<br />
calcu<strong>la</strong>ting each ratio. Implementation of common standards will greatly assist len<strong>de</strong>rs<br />
to speak a common <strong>la</strong>nguage and to assess their financial performance. As a result, the<br />
benchmarking indicators on the following pages have been inclu<strong>de</strong>d as part of this<br />
standardisation.<br />
Even though more institutions respon<strong>de</strong>d in the current edition of the survey than in<br />
previous surveys, the number of responses continues to be low and the percentage responding<br />
to this section out of the total number of responding institutions is lower than in previous<br />
editions of the survey. As seen in the following pages, less than a third of organisations that<br />
directly disburse microloans provi<strong>de</strong>d information on their operational self-sufficiency rates<br />
(30% of respon<strong>de</strong>nts, 50 total institutions), recovery rates (22% of respon<strong>de</strong>nts, 38 institutions),<br />
portfolio at risk (38% of respon<strong>de</strong>nts, 65 institutions), write offs (35% of respon<strong>de</strong>nts, 59<br />
institutions) and refinancing ratio or <strong>de</strong>bt/equity ratio (28% of respon<strong>de</strong>nts, 45 institutions).<br />
Therefore, this data should be analysed with caution.<br />
This low response rate might again be exp<strong>la</strong>ined by the un<strong>de</strong>r-<strong>de</strong>veloped management<br />
information systems (MIS), which are a likely outcome of the legal status of 60% of len<strong>de</strong>rs as<br />
not-for-profit organisations with budget restrictions, as well as the len<strong>de</strong>rs’ <strong>la</strong>ck of practice or<br />
confi<strong>de</strong>nce in disclosing financial performance information, particu<strong>la</strong>rly when the ratios are<br />
<strong>de</strong>emed not to have a positive enough outcome.<br />
8.1 Operational Self-Sufficiency Rate<br />
The first operation performance metric covered in the survey was the operational selfsufficiency<br />
rate. Operational self-sufficiency rate was <strong>de</strong>fined as:<br />
Financial revenue + other operating revenue<br />
Financial expense + loan loss provision expense + operating expense<br />
x 100
Thirty per cent of respon<strong>de</strong>nts that disburse<br />
loans gave information on their operational<br />
self-sufficiency rates. The average operational<br />
self-sufficiency rate amongst these len<strong>de</strong>rs<br />
was 93%. The highest operational selfsufficiency<br />
rate was 172% (Hungary) and the<br />
lowest was 6% (also in Hungary), followed by<br />
12% in Bulgaria and 21% in Italy. The median<br />
across all responding institutions was 93%,<br />
but is important to keep in mind the low ratio<br />
of the respon<strong>de</strong>nts to this question. Sixty<br />
percent of the respon<strong>de</strong>nts were operationally<br />
self-sustainable (Graph 38), whereas in<br />
the previous survey, the percentage was<br />
nearly half (47%). Bulgarian, Romanian<br />
and Hungarian institutions had the highest<br />
Graph 38: Operational self-sufficiency rate<br />
70%<br />
60%<br />
50%<br />
40%<br />
30%<br />
20%<br />
10%<br />
0%<br />
20%<br />
Less than 60%<br />
PeRCeNT oF ReSPoNDeNTS<br />
number of respon<strong>de</strong>nts to this question, with<br />
Bulgaria and Romania having the highest<br />
figures of operational self-sustainability. This<br />
could be due to the fact that the majority of<br />
institutions operating in these countries are<br />
regu<strong>la</strong>ted institutions (non-financial banking<br />
institutions and credit unions). After these<br />
two, Germany and the Nether<strong>la</strong>nds follow<br />
in total numbers of operationally selfsustainable<br />
institutions, and contrary to the<br />
previous edition of the survey, there were no<br />
institutions that reported OSS data in Spain,<br />
and Italy only reported one case. However,<br />
sustainability remains a sector challenge, as<br />
will be discussed in Chapter 12.<br />
20%<br />
60% to 100%<br />
Graph 39: Operational self-sufficiency rate by country<br />
120%<br />
100%<br />
80%<br />
60%<br />
40%<br />
20%<br />
0%<br />
110%<br />
Bulgaria<br />
104%<br />
Croatia<br />
101%<br />
Romania<br />
PeRCeNT oF ReSPoNDeNTS<br />
101%<br />
Nether<strong>la</strong>nds<br />
100%<br />
Germany<br />
97%<br />
Belgium<br />
95%<br />
Hungary<br />
74%<br />
France<br />
60%<br />
over 100%<br />
66%<br />
united kingdom<br />
21%<br />
Italy<br />
55
<strong>EMN</strong> <strong>2008</strong>-<strong>2009</strong> <strong>Overview</strong><br />
56<br />
8.2 Current Recovery Rate<br />
Repayment rate was <strong>de</strong>fined as:<br />
Value of amounts collected<br />
Value of amounts fallen due for the first time un<strong>de</strong>r the original contract terms<br />
Twenty-two percent of respon<strong>de</strong>nts that<br />
disburse loans gave information on their<br />
repayment rates, ten percent less respon<strong>de</strong>nts<br />
than in the previous edition of the survey.<br />
The average repayment rate amongst these<br />
Graph 40: Current recovery rate<br />
40%<br />
35%<br />
30%<br />
25%<br />
20%<br />
15%<br />
10%<br />
5%<br />
0%<br />
37%<br />
PeRCeNT oF ReSPoNDeNTS<br />
Even though the survey sample for this<br />
edition is not very big, we see a proportion<br />
of len<strong>de</strong>rs with repayment rates in the 91-<br />
100% range, as well as less than 80% range<br />
(Graph 40). The <strong>la</strong>rgest numbers of high<br />
performing institutions with repayment rates<br />
above 90% are located in France. Institutions<br />
with a repayment rate of almost 90% are<br />
found in Romania and Spain. In the special<br />
case of Spain, this is due to the fact that one<br />
of the big p<strong>la</strong>yers in the field is the main<br />
microfinance institution in the country which<br />
x 100<br />
len<strong>de</strong>rs was 63%, more than twenty points<br />
less than the previous survey. The range of<br />
repayment rates went from 5% for one len<strong>de</strong>r<br />
to 100% for another len<strong>de</strong>r. The median value<br />
was 78% and the standard <strong>de</strong>viation was 36.<br />
27%<br />
37%<br />
Less than 80% 81% to 90%<br />
91% to 100%<br />
is a banking institution. The current crisis<br />
situation has particu<strong>la</strong>rly affected the most<br />
vulnerable sections of the popu<strong>la</strong>tion, such<br />
as immigrants, women and youth, increasing<br />
the unemployment rate, which could be part<br />
of the cause of the difference in the results<br />
in previous editions of the survey. In spite<br />
of the fact that Spain is one of the countries<br />
most affected by the crisis, it can be found in<br />
second p<strong>la</strong>ce with regard to repayment rates,<br />
after France.
Graph 41: Current recovery rate per institutional type<br />
100%<br />
90%<br />
80%<br />
70%<br />
60%<br />
50%<br />
40%<br />
30%<br />
20%<br />
10%<br />
0%<br />
92%<br />
Savings<br />
Bank<br />
71%<br />
NGo or<br />
Foundation<br />
As can be observed in the above graph, the types of institution that have the highest recovery<br />
rates are Savings Banks (92%), followed by NGOs and Foundations (71%).<br />
8.3 Portfolio at risk<br />
PeRCeNT oF ReSPoNDeNTS<br />
71%<br />
Non-bank<br />
Financial<br />
Institution<br />
Thirty-eight percent of lending organisations surveyed provi<strong>de</strong>d portfolio at risk figures<br />
(Graph 42). This ratio was <strong>de</strong>fined as:<br />
55%<br />
other<br />
55%<br />
Credit union /<br />
cooperative<br />
48%<br />
Bank<br />
outstanding principal ba<strong>la</strong>nce of all microloans past<br />
due more than thirty days<br />
Average gross outstanding portfolio at 31 December <strong>2009</strong><br />
Graph 42: Portfolio at risk rate<br />
45%<br />
40%<br />
35%<br />
30%<br />
25%<br />
20%<br />
15%<br />
10%<br />
5%<br />
0%<br />
23%<br />
0% to 5%<br />
PeRCeNT oF ReSPoNDeNTS<br />
39%<br />
6% to 15%<br />
21%<br />
16% to 25%<br />
18%<br />
over 25%<br />
8%<br />
CDFI<br />
x 100<br />
57
<strong>EMN</strong> <strong>2008</strong>-<strong>2009</strong> <strong>Overview</strong><br />
58<br />
The highest portfolio at risk figure was<br />
73.7% and the lowest 3.47%. The average<br />
figure for the respon<strong>de</strong>nts was 16%, which<br />
is situated a little higher than the previous<br />
survey (14%). The percentage of len<strong>de</strong>rs<br />
falling into the lower risk ranges has<br />
<strong>de</strong>creased substantially from the previous<br />
survey and the percentage in the higher risk<br />
ranges has increased. The <strong>la</strong>rgest average<br />
number of high performing institutions<br />
with an at risk portfolio below 10% are<br />
In the above graph, three variables are<br />
analysed in parallel: the number of loans<br />
disbursed, number of institutions that<br />
disbursed those loans and the level of<br />
associated risk. For this analysis, the level of<br />
risk has been divi<strong>de</strong>d into 4 groups, (0%-5%,<br />
6%-15%, 16%-25% and more than 25%). The<br />
x-axis represents the number of disbursed<br />
loans and the y-axis represents the cumu<strong>la</strong>tive<br />
percentage of responding institutions. It can<br />
be observed that institutions with lower risk<br />
Thirty-five percent of len<strong>de</strong>rs surveyed<br />
supplied information regarding write-offs<br />
(Graph 44).<br />
The average write-off rate was 9.5%, 3.5<br />
points higher than the previous survey. The<br />
highest write-off rate was 35%, 7 percentage<br />
located in Bulgaria and Germany. However,<br />
when taken separately, the best performing<br />
individual institutions are found in Bulgaria<br />
and the Nether<strong>la</strong>nds. The worst performing<br />
institutions with a portfolio at risk above 35%<br />
are located in the UK. Furthermore, it must<br />
be noted that these conclusions are directly<br />
obtained from the information given on<br />
behalf of the institutions and is not compared<br />
with the number of loans that each of these<br />
institutions disbursed individually.<br />
Graph 43: Portfolio at risk rate by nº of loans disbursed<br />
CuMuLATIVe PeRCeNTAGe<br />
oF ReSPoNDeNT INSTITuTIoNS<br />
120%<br />
100%<br />
80%<br />
60%<br />
40%<br />
20%<br />
0%<br />
PeRCeNT oF ReSPoNDeNTS<br />
2<br />
4<br />
7<br />
11<br />
18<br />
22<br />
26<br />
32<br />
39<br />
42<br />
50<br />
54<br />
68<br />
82<br />
88<br />
112<br />
Nº oF LoANS DISBuRSeD <strong>2009</strong><br />
127<br />
0% to 5% 6% to 15%<br />
16% to 25%<br />
levels are those that disburse a higher number<br />
of loans (a greater cumu<strong>la</strong>tive percentage of<br />
institutions, greater slope at the end of the<br />
x-axis) while those that have greater risk<br />
levels are those that disburse a lower number<br />
of loans.<br />
8.4 Write-offs<br />
Write-offs refer to:<br />
Value of loans that recognised as uncollectible during period<br />
Average gross outstanding portfolio during period<br />
140<br />
189<br />
275<br />
334<br />
504<br />
600<br />
over 25%<br />
712<br />
x 100<br />
points higher than in 2007, with several<br />
len<strong>de</strong>rs reporting write off rates of 0%. The<br />
re<strong>la</strong>tively high number of organisations<br />
(41 institutions) in the 0-5% range may be<br />
a reflection of the newness of the sector as<br />
recent entrants cannot yet <strong>de</strong>c<strong>la</strong>re any of<br />
their arrears as uncollectible and therefore<br />
1.047<br />
1.452<br />
9.500<br />
14.050
write them off. The impact of the economic<br />
and financial crisis does not seem to have yet<br />
affected the quality of the lending portfolio<br />
Graph 44: Write-off rate<br />
70%<br />
60%<br />
50%<br />
40%<br />
30%<br />
20%<br />
10%<br />
0%<br />
69%<br />
PeRCeNT oF ReSPoNDeNTS<br />
The <strong>la</strong>rgest number of high performing<br />
institutions with a write-off rate below 5% is<br />
located once again in Romania and Bulgaria,<br />
and in France. The <strong>la</strong>rgest number of poor<br />
performing institutions with a write-off rate<br />
above 10% is located in Spain.<br />
The questionnaire asked respon<strong>de</strong>nts about<br />
the e<strong>la</strong>psed time period before they recognise<br />
loans as uncollectible. The range was 1<br />
month to 7 years. As an average, institutions<br />
consi<strong>de</strong>r loans uncollectible after 15 months.<br />
and the recuperation of loans as it has in other<br />
parts of the world, such as Morocco or Bosnia<br />
and Herzegovina.<br />
0 to 5% 6% to 10%<br />
over 10%<br />
Graph 45: Refinancing ratio<br />
50%<br />
45%<br />
40%<br />
35%<br />
30%<br />
25%<br />
20%<br />
15%<br />
10%<br />
5%<br />
0%<br />
47%<br />
0% to 5%<br />
14%<br />
The country with the highest average time<br />
to consi<strong>de</strong>r a loan uncollectible is France,<br />
followed by the Nether<strong>la</strong>nds. The countries<br />
with the lowest average time to consi<strong>de</strong>r a<br />
loan uncollectible are Croatia and Italy.<br />
8.5 Refinancing Ratio<br />
Outstanding amount of the loans refinanced<br />
or restructured at the end of period<br />
Total outstanding portfolio<br />
17%<br />
Twenty-eight percent of lending organisations<br />
supplied information regarding their refinancing<br />
ratio or rescheduled loans (Graph 45). This ratio<br />
was <strong>de</strong>fined as:<br />
PeRCeNT oF ReSPoNDeNTS<br />
17%<br />
6% to 15%<br />
17%<br />
16% to 20%<br />
19%<br />
over 21%<br />
x 100<br />
59
<strong>EMN</strong> <strong>2008</strong>-<strong>2009</strong> <strong>Overview</strong><br />
60<br />
The value of the outstanding principal<br />
ba<strong>la</strong>nce of rescheduled loans in re<strong>la</strong>tion<br />
to total portfolio outstanding was 14% on<br />
average amongst respon<strong>de</strong>nts, compared<br />
to 5% in the previous survey. This figure<br />
could also be linked to the economic<br />
and financial crisis and its impact on<br />
microcredit clients. Polish and Bulgarian<br />
organisations have the lowest ratios while<br />
Graph 46: Debt / equity ratio<br />
35%<br />
30%<br />
25%<br />
20%<br />
15%<br />
10%<br />
5%<br />
0%<br />
29%<br />
0% to 2%<br />
29%<br />
3% to 10%<br />
Over half of the respon<strong>de</strong>nts have liabilities<br />
equivalent to less than 10% of their equity.<br />
On the other hand, we find four heavily<br />
in<strong>de</strong>bted len<strong>de</strong>rs (mainly from Romania)<br />
with a <strong>de</strong>bt/equity ratio above 100%. There<br />
is one Romanian len<strong>de</strong>r with a ratio of 213%.<br />
The average is 40.7%. Compared to the<br />
world average provi<strong>de</strong>d by the MIX of 3.0%,<br />
European microfinance institutions are more<br />
heavily in<strong>de</strong>bted than their peers. This could<br />
Total liabilities<br />
Total equity<br />
PeRCeNT oF ReSPoNDeNTS<br />
22%<br />
11% to 80%<br />
organisations in United Kingdom and<br />
France show the highest.<br />
8.6 Debt / Equity Ratio<br />
Twenty-six percent of lending organisations<br />
surveyed provi<strong>de</strong>d their <strong>de</strong>bt/equity ratio (Graph<br />
46), which was higher than the <strong>la</strong>st survey, situated<br />
at 19%. Debt/equity ratio was <strong>de</strong>fined as:<br />
x 100<br />
11%<br />
81% to 100%<br />
be due to <strong>la</strong>rge inflows of commercial <strong>de</strong>bt in<br />
transition economies over the past 10 years.<br />
8.7 Portfolio yield<br />
2%<br />
101% to 200%<br />
7%<br />
over 200%<br />
Twenty-seven percent of lending<br />
organisations supplied information regarding<br />
their portfolio yield (Graph 47), 10% more<br />
than in the previous survey. Portfolio yield<br />
was <strong>de</strong>fined as:<br />
earned revenue (from interest earnings and fees)<br />
Average gross outstanding portfolio during period<br />
x 100
Graph 47: Portfolio yield<br />
60%<br />
50%<br />
40%<br />
30%<br />
20%<br />
10%<br />
0%<br />
53%<br />
0% to 5%<br />
More than a half of the respon<strong>de</strong>nts earned<br />
income equivalent to between 0 a 5% of their<br />
gross loan portfolio. On the other hand, 23% of<br />
the respon<strong>de</strong>nts had a portfolio yield over 16%<br />
and 23% of respon<strong>de</strong>nts had a portfolio yield<br />
The survey asked for the total amount of<br />
operating expenses, including sa<strong>la</strong>ries, rent,<br />
transport, etc., in or<strong>de</strong>r to obtain a proxy<br />
indicator of how much it costs to maintain<br />
a microcredit programme in the EU. 27%<br />
of len<strong>de</strong>rs supplied information regarding<br />
their operating expenses, almost double the<br />
percentage of respon<strong>de</strong>nts in the previous<br />
survey. Dividing the amount of operating<br />
PeRCeNT oF ReSPoNDeNTS<br />
23%<br />
6% to 15%<br />
8.8 operating expenses ratio<br />
operating expenses during period<br />
between 6% and 15%. Once again, the <strong>la</strong>rgest<br />
number of high performing organisations<br />
with a portfolio yield above 15% is located<br />
in Romania and Bulgaria. There is more<br />
geographical dispersion in the other ranges.<br />
Average gross outstanding portfolio during period<br />
Graph 48: operating expenses ratio<br />
45%<br />
40%<br />
35%<br />
30%<br />
25%<br />
20%<br />
15%<br />
10%<br />
5%<br />
0%<br />
39%<br />
0% to 5%<br />
14%<br />
16% to 25%<br />
9%<br />
over 25%<br />
x 100<br />
expenses by the average gross outstanding<br />
portfolio, the average operating cost over<br />
the gross portfolio per loan is 14%. This<br />
information is not comparable with the<br />
previous surveys as the indicator has been<br />
calcu<strong>la</strong>ted differently. The most efficient<br />
organisations are found in Po<strong>la</strong>nd, Bulgaria<br />
and Germany, where the sector is more<br />
mature and profit oriented.<br />
PeRCeNT oF ReSPoNDeNTS<br />
28%<br />
6% to 15%<br />
24%<br />
16% to 40%<br />
9%<br />
over 40%<br />
61
<strong>EMN</strong> <strong>2008</strong>-<strong>2009</strong> <strong>Overview</strong><br />
62<br />
9 Funding<br />
I<br />
n contrast to the previous survey, it can be observed that len<strong>de</strong>rs in the European Union<br />
finance their operating costs from earned income and contributions from the private<br />
sector. This is probably due to the incorporation of savings banks and the promotion of<br />
the microfinance sector on behalf of the European Union. However, EU len<strong>de</strong>rs still rely<br />
on public and private funds to cover operational costs and to provi<strong>de</strong> loan capital. Around<br />
35% of len<strong>de</strong>rs supplied information on their sources of funding.<br />
9.1 operational and Financial Costs<br />
The private sector in the EU p<strong>la</strong>ys an important role in covering operational expenses,<br />
financial costs and loan losses (Graph 49).<br />
Graph 49: Funding of operational and financial costs<br />
70%<br />
60%<br />
50%<br />
40%<br />
30%<br />
20%<br />
10%<br />
0%<br />
34%<br />
Public sector<br />
PeRCeNT oF ReSPoNDeNTS<br />
42%<br />
Private sector<br />
60%<br />
earned income
Sixty percent of respon<strong>de</strong>nts in the<br />
European Union finance their operational<br />
and financial costs from earned income (fees,<br />
interest and income earned on assets). Funds<br />
from the private sector finance 42% of these<br />
costs and 34% are financed by the public<br />
sector. Not all responding institutions gave<br />
exact data for each of the categories and<br />
replied to each in<strong>de</strong>pen<strong>de</strong>ntly. Not all of the<br />
same institutions respon<strong>de</strong>d to each of the<br />
Graph 50: Sources of loan capital<br />
60%<br />
50%<br />
40%<br />
30%<br />
20%<br />
10%<br />
0%<br />
50%<br />
Public sector<br />
44%<br />
own funds<br />
The credit unions and cooperatives receive<br />
as much as 100% of their loan capital from<br />
the public sector, followed by NGOs and<br />
Foundations. The NGOs and Foundations<br />
also receive a majority of their funds from the<br />
private sector. On the other hand, banks and<br />
non-bank financial institutions are mainly<br />
financed through their own funds.<br />
In Spain, most of the len<strong>de</strong>rs (savings<br />
banks) finance 100% of their loan capital with<br />
categories and for this reason it is not possible<br />
to have a global vision of where 100% of the<br />
financing of the European sector comes from.<br />
9.2 Loan Capital<br />
Loan capital is fun<strong>de</strong>d from the public<br />
sector, own funds, the private sector, clients’<br />
<strong>de</strong>posits and commercial <strong>de</strong>bt, in that or<strong>de</strong>r.<br />
PeRCeNT oF ReSPoNDeNTS<br />
36%<br />
Private sector<br />
24%<br />
Client <strong>de</strong>posits<br />
19%<br />
Commercial <strong>de</strong>bt<br />
“social work” or Obra Social funds. Simi<strong>la</strong>rly,<br />
in the UK, len<strong>de</strong>rs capitalise loan funds fully<br />
through the private and charity sectors.<br />
In Germany and Belgium, the majority<br />
of institutions receive loan capital from the<br />
public sector while organisations in Spain<br />
and in the UK mainly rely on their own funds<br />
Currently, public sources are less important in<br />
Eastern countries even though public funds<br />
remain a strong source of financing.<br />
63
<strong>EMN</strong> <strong>2008</strong>-<strong>2009</strong> <strong>Overview</strong><br />
64<br />
10 Regu<strong>la</strong>tion and networking<br />
N<br />
ew questions were ad<strong>de</strong>d to the current survey so as to be able to obtain a better<br />
un<strong>de</strong>rstanding of the current lobbying and networking activities being carried out<br />
in the microfinance sector in Europe. External pressure and lobbying are nee<strong>de</strong>d<br />
so that the market can continue to <strong>de</strong>velop without obstacles. Greater cooperation<br />
is also nee<strong>de</strong>d in or<strong>de</strong>r to have an overall view of the sector characteristics that are simi<strong>la</strong>r<br />
throughout Europe, to combine efforts and to reach for greater efficiency in the sector. As<br />
mentioned earlier, only two countries have specific <strong>la</strong>ws re<strong>la</strong>ting to the regu<strong>la</strong>tion of the<br />
microfinance sector, France and Romania (European Commission, 2007a).<br />
10.1 Legal Environment<br />
As the number of microfinance institutions in Europe continues to grow, so too does the<br />
importance of the sector. For this reason, there is a growing need for greater market regu<strong>la</strong>tion<br />
in the microfinance sector. Traditional financial regu<strong>la</strong>tion can neither be adapted nor <strong>de</strong>al with<br />
the complexity of the characteristics unique to this sector and, as a result, a new framework<br />
must be consi<strong>de</strong>red. As a result, genuine efforts are nee<strong>de</strong>d to attempt to influence national and<br />
supranational governmental authorities to lead microfinance institutions to greater growth<br />
levels and further their <strong>de</strong>velopment.<br />
The following graph shows that almost half of responding institutions carry out lobbing<br />
activities at the local level. Here, France and Hungary have the greatest number of respon<strong>de</strong>nts.<br />
41% lobby at the national level, the strongest country respon<strong>de</strong>nts being the Nether<strong>la</strong>nds and<br />
Swe<strong>de</strong>n. 13% carry out lobbying at the European level where a greater size and resources are<br />
nee<strong>de</strong>d to have an effect on <strong>de</strong>cision-making. Of these, the countries with the highest number<br />
of respon<strong>de</strong>nts are France and the Nether<strong>la</strong>nds.<br />
The majority of institutions that do not carry out lobbying activities stated that the reason<br />
for this was a <strong>la</strong>ck of time and/or resources, whereas a small percentage (7%) either are not<br />
interested or do not have the knowledge to carry out lobbying activities. Surprisingly, Belgium<br />
with the European capital of Brussels within its bor<strong>de</strong>rs, was the country with the highest<br />
number of respon<strong>de</strong>nts that do not carry out lobbying due to <strong>la</strong>ck of time and resources.
50%<br />
40%<br />
30%<br />
20%<br />
10%<br />
0%<br />
70%<br />
60%<br />
50%<br />
40%<br />
30%<br />
20%<br />
10%<br />
0%<br />
Graph 51: Lobbying activities<br />
48%<br />
Yes,<br />
we do so at<br />
the local level<br />
41%<br />
Yes,<br />
we do so at the<br />
national level<br />
10.2 Networking<br />
The great majority of European<br />
microfinance institutions participate in<br />
networking activities on some scale. The<br />
majority of institutions network within their<br />
own country, 61% participate in networking<br />
on a national level and 59% participate on a<br />
local level, where institutions can meet the<br />
greatest number of involved actors without<br />
investing a lot of time or money. Hungary<br />
and Swe<strong>de</strong>n have the highest number of<br />
respon<strong>de</strong>nts that participate in networking<br />
on a national level. In Hungary, this number<br />
Graph 52: Networking activities<br />
61%<br />
Yes,<br />
we do so at the<br />
national level<br />
59%<br />
Yes,<br />
we do so at<br />
the local level<br />
PeRCeNT oF ReSPoNDeNTS<br />
22%<br />
No,<br />
because we do not<br />
have the time and / or<br />
resources to do so<br />
13%<br />
Yes,<br />
we do so at the<br />
european level<br />
PeRCeNT oF ReSPoNDeNTS<br />
38%<br />
Yes,<br />
we do so at the<br />
european level<br />
5%<br />
No,<br />
because we are<br />
not interested<br />
2%<br />
No,<br />
because we do not<br />
have the know how<br />
to do so<br />
is not surprising due to the membership<br />
of the Local Enterprise Associations in the<br />
national Hungarian <strong>Microfinance</strong> Network.<br />
On a local level, Germany and France had the<br />
highest number of respon<strong>de</strong>nts. Networking<br />
on a European level, where more time and<br />
resources are nee<strong>de</strong>d, <strong>de</strong>creases to 38%, with<br />
the highest number of respon<strong>de</strong>nts being<br />
from the Nether<strong>la</strong>nds and France, which also<br />
lobbied on a European level more vigorously<br />
than the other respon<strong>de</strong>nts. The number<br />
of institutions that are not involved in any<br />
networking activity is minute (9% total).<br />
6%<br />
No,<br />
because we do not<br />
have the time and / or<br />
resources to do so<br />
2%<br />
No,<br />
because we do not<br />
have the know how<br />
to do so<br />
1%<br />
No,<br />
because we are<br />
not interested<br />
65
<strong>EMN</strong> <strong>2008</strong>-<strong>2009</strong> <strong>Overview</strong><br />
66<br />
Case study 2:<br />
Institutional capacity building<br />
in European Non-bank MFIs<br />
Institutional capacity building of Non-bank MFIs has to be regar<strong>de</strong>d as a key<br />
challenge of the upcoming years in <strong>de</strong>veloping microfinance activities in<br />
Europe. It is not only as an essential precondition for more sustainability and<br />
efficiency in the sector but also for en<strong>la</strong>rging the outreach of European MFIs<br />
to socially exclu<strong>de</strong>d clients. This is one of the results of a series of market studies on<br />
the supply and <strong>de</strong>mand of microcredits in eight EU member states 34 , complemented<br />
by a specific report on Capacity Building Needs based on self-assessment of 115<br />
microfinance organisations as well as focus groups (EVERS&JUNG, <strong>2009</strong>). They<br />
were part of a project commissioned by the European Investment Fund (EIF) to the<br />
European <strong>Microfinance</strong> Network (<strong>EMN</strong>) as one of the preparatory steps to implement<br />
the JASMINE 35 facility of the European Union.<br />
Microcredit in Europe has evolved over the past twenty years in very challenging<br />
environments: in Western Europe post-industrialized economies with highly evolved<br />
banking sectors oriented towards minimal risk exposure and maximum profit rates,<br />
resulting in financial exclusion of certain kind of clients and entrepreneurial projects;<br />
in Eastern Europe transition economies with high rates of self-employment as a<br />
result of post-communist <strong>la</strong>y-offs and <strong>la</strong>cking financial infrastructure, but ongoing<br />
funding activity of (mostly US) foreign aid agencies with experience in microfinance<br />
in <strong>de</strong>veloping countries. A diversity of approaches <strong>de</strong>veloped that can be summarized<br />
in two main segments: microenterprise lending, i.e. lending to financially exclu<strong>de</strong>d<br />
microentrepreneurs and start-ups that are “nearly bankable” and inclusion lending,<br />
i.e. lending to financially and often socially exclu<strong>de</strong>d clients that are “non-bankables”<br />
and will stay exclu<strong>de</strong>d from mainstream financial services in the mid to long term.<br />
The institutional mo<strong>de</strong>ls of micro-credit provision that have evolved in these two<br />
segments are equally diverse as the approaches used: they encompass non profit<br />
organisations, State agencies, commercial banks, promotional banks, specialised<br />
micro-credit banks and credit unions. Those of the institutions that give out loans<br />
without a banking license 36 can be grouped into the category Non-bank MFIs; they<br />
are mainly active in the segment of inclusion lending. For micro-credit provi<strong>de</strong>rs,<br />
34 Bulgaria, Czech Republic, Germany, Italy, Spain, UK, Romania and Slovakia.<br />
35 Joint Action to support microfinance institutions in Europe.<br />
36 In countries, in which onlending is prohibited without a banking licence, non-bank MFI engage in microlending through<br />
cooperation mo<strong>de</strong>ls with banks, e.g. in Germany.
<strong>de</strong>aling with these target groups means a high risk of <strong>de</strong>fault and requires high levels<br />
of institutional capability in areas like screening, human resources, performance<br />
analysis and additional support services.<br />
The study on behalf of the EIF showed that for assessing the institutional capacity<br />
levels in the European Non-bank MFI sector it is crucial to acknowledge that these<br />
organisations are right now in very different stages of their institutional <strong>de</strong>velopment.<br />
In summary, the studies highlight the following institutional capacity building needs<br />
of non-bank MFIs:<br />
Lack of institutional capacity in building and maintaining<br />
a<strong>de</strong>quate funding mo<strong>de</strong>ls for a growth in microfinance operations.<br />
Additionally there is a clear need for sustained funding to cover<br />
start-up and operative costs and funding for on-lending to high<br />
risk target groups.<br />
Un<strong>de</strong>r<strong>de</strong>veloped systems for performance measurement and<br />
analysis and a missing culture of transparency and reporting,<br />
especially in Western Europe.<br />
Only average capacity levels regarding human resource<br />
management, especially in finding trained middle management<br />
staff and experienced loan officers.<br />
Lack of capacity for networking and co-operation between the<br />
actors in the national microcredit sectors to allow peer exchange,<br />
joint marketing activities and lobbying for more favourable legal<br />
and policy frameworks.<br />
Specific actions should therefore be taken to reinforce the institutional capacity of<br />
non-bank MFIs: Transparency should be improved by clearer <strong>de</strong>finitions of microcredit<br />
and the introduction of a new status of “solo-entrepreneur” in the EU SME <strong>de</strong>finition.<br />
Clear <strong>de</strong>velopment objectives and targets need to be agreed and adjusted social and<br />
financial performance indicators need to be <strong>de</strong>veloped to measure them.<br />
The benchmarks in terms of the <strong>de</strong>gree of (self-)sustainability set for MFIs in the<br />
EU should be individually adjusted according to the target groups they are serving<br />
and to the complexity of services they provi<strong>de</strong>. A right ba<strong>la</strong>nce between the expected<br />
social, economic and financial outcomes need to be found. Public funds should be<br />
injected in those areas, where they are the most nee<strong>de</strong>d and most effective and MFIs<br />
should be supported in different stages of their life cycle in a needs-oriented way.<br />
Last but not least financial and non-financial services should be seen as separate<br />
cost centres, because even if the financial operation may become sustainable in the<br />
long run, business <strong>de</strong>velopment services for disadvantaged target groups will require<br />
subsidies. The technical assistance branch of the Jasmine Initiative for the European<br />
<strong>Microfinance</strong> Sector will be an excellent opportunity to implement these measures,<br />
as long as capacity building is un<strong>de</strong>rstood in holistic approach and not just linked<br />
to training. Other funding opportunities in the European context need to inclu<strong>de</strong><br />
such component to ensure that European MFIs make progress in their institutional<br />
capacity on a broad scale to increase their outreach and sustainability.<br />
Sources: Michael Unterberg, “Reaching out to the hard-to reach: A task of institutional capacity<br />
building in the European non-bank MFIs”, <strong>EMN</strong> Magazine n°6, December <strong>2009</strong>; Jung, M., Lahn, S.,<br />
Unterberg, M. (EVERS&JUNG), EIF Market Study Microlending, Capacity building needs and policy<br />
recommendations, March <strong>2009</strong><br />
67
<strong>EMN</strong> <strong>2008</strong>-<strong>2009</strong> <strong>Overview</strong><br />
68<br />
11 Crisis<br />
G<br />
iven the precarious financial and economic climate that Europe is currently<br />
faced with, particu<strong>la</strong>rly in specific countries such as Greece, Spain and Portugal,<br />
questions arose over the impact this crisis could have on the microcredit sector<br />
and microcredit clients.<br />
The greatest impact of the crisis has been on the client, where the most significant outcome<br />
of the crisis to date has been a severe contraction of the job market – loss of employment,<br />
hiring freezes, pay cuts, and the like. This could have an even greater impact on microcredit<br />
clients, who are already in a vulnerable and precarious financial situation. The European<br />
Union has also realized that microcredit is an effective tool for combating the negative effects<br />
of the crisis by promoting entrepreneurship and preventing high levels of unemployment.<br />
In March 2010, the European Union established the European <strong>Microfinance</strong> Facility for<br />
Employment and Social Inclusion (Progress <strong>Microfinance</strong> Facility) 37 to enable those who are<br />
unemployed and want to start their own business to confront these new challenges in the<br />
wake of the recent crisis.<br />
The survey incorporated new questions as a result of this environment to create a new<br />
section on the impact of the crisis. The drafting of these questions was based on the results of<br />
two polls <strong>EMN</strong> had carried out specifically on the crisis amongst its members in November<br />
<strong>2008</strong> and April <strong>2009</strong>. For this, respon<strong>de</strong>nts were asked to respond to the following questions:<br />
Has the organisation been affected by the crisis? How?<br />
How have clients been affected by the crisis?<br />
Almost three-fourths, or 74%, of responding institutions affirmed that they were<br />
affected by the crisis in some way. The most affected areas for institutions are reflected in<br />
the following graph:<br />
37 The establishment of the Progress <strong>Microfinance</strong> Facility was put into effect by Decision No 283/2010/EU of the European Parliament and of<br />
the Council.
Late/<strong>de</strong>fault payment<br />
Number of loan applicants<br />
Number of loan approved<br />
Graph 53: Areas most affected by the crisis<br />
Interest rate<br />
charged to clients<br />
Access to private<br />
funds for loan capital<br />
Access to public<br />
funds for loan capital<br />
Number of staff<br />
Access to private funds<br />
for operational costs<br />
Access to public funds<br />
for operational costs<br />
0% 10% 20% 30% 40% 50% 60% 70% 80% 90% 100%<br />
11.1 Institutional Impact<br />
Increase<br />
As can be clearly seen in the graph above,<br />
almost 80% of responding institutions have<br />
been affected by <strong>la</strong>te and <strong>de</strong>fault payments<br />
as a result of the crisis. This is in line with<br />
the results of the crisis polls carried out by<br />
<strong>EMN</strong> in <strong>2008</strong> and <strong>2009</strong> amongst its members.<br />
Clients either do not have the money to<br />
make the payments on time, or do not make<br />
the payments at all. This could have serious<br />
repercussions in future surveys regarding<br />
its effect on overall portfolio returns, write<br />
offs and restructured loans. However, at the<br />
present time, the impact of these <strong>la</strong>te and<br />
<strong>de</strong>fault payments has yet to be seen.<br />
More than half of reporting institutions<br />
have seen an increase in the number of<br />
loan applicants, which <strong>de</strong>monstrates that<br />
microcredit has been used as a tool to reduce<br />
the impact of the crisis on the job market.<br />
There has also been a reduction in access<br />
to funds across the board. 50% of responding<br />
institutions have been affected by the reduction<br />
of access to private funds for operational<br />
costs, and to a lesser extent institutions have<br />
been affected by the reduction of access to<br />
public funds for the same purpose. Not much<br />
change was reported in regard to access to<br />
Decrease No change<br />
private and public funds for loan capital.<br />
Less funds are avai<strong>la</strong>ble for operational costs<br />
than for loan capital as it can be expected that<br />
len<strong>de</strong>rs and/or donors would like to see a<br />
return on their contributions.<br />
Institutions did not report any significant<br />
changes in the interest rate charged to clients.<br />
It would be interesting to follow this trend as<br />
<strong>la</strong>te/<strong>de</strong>fault payments begin having an effect<br />
on the overall portfolio to see how institutions<br />
cover this loss.<br />
The number of loans approved has affected<br />
institutions heterogeneously. In countries<br />
such as Germany or Italy, a high number of<br />
institutions that respon<strong>de</strong>d to this question,<br />
67% and 65% respectively, have seen an<br />
increase in the number of loans approved.<br />
However, at the same time, in countries such<br />
as Romania, Bulgaria or Spain, the majority of<br />
institutions have noted a <strong>de</strong>crease in the overall<br />
number of loans approved. In Romania, 100%<br />
of the institutions that respon<strong>de</strong>d to these<br />
questions have seen their number of loans<br />
approved <strong>de</strong>crease. This percentage was 75%<br />
in the case of Bulgaria and 70% in the case<br />
of Spain. An overall difference between the<br />
number of loan applicants and the number of<br />
loans approved can be seen.<br />
69
<strong>EMN</strong> <strong>2008</strong>-<strong>2009</strong> <strong>Overview</strong><br />
70<br />
11.2 Client impact<br />
Graph 54: Clients<br />
Access to other<br />
financing sources<br />
Liquidity<br />
Ability to keep loan<br />
payment schedule<br />
Business performance<br />
Ability to mantain<br />
business staff<br />
Decreasing <strong>de</strong>mand for<br />
your services / products<br />
0% 10% 20% 30% 40% 50% 60% 70% 80% 90% 100%<br />
Very affected<br />
The above graph <strong>de</strong>monstrated the impact<br />
of the crisis on microcredit clients and<br />
their respective microenterprise from the<br />
perspective of the MFI. Where the crisis had<br />
the greatest impact on clients was in the access<br />
to other sources of financing; 50% of MFIs<br />
reported that their clients were very affected<br />
by the crisis in this aspect, followed very<br />
closely by liquidity, or the ability to convert<br />
assets into cash. As the crisis has affected the<br />
general popu<strong>la</strong>tion, <strong>de</strong>mand for said assets<br />
would be expected to <strong>de</strong>crease.<br />
The majority of institutions reported<br />
difficulty in the ability of the client to<br />
Somewhat affected unaffected unknown<br />
keep to the loan payment schedule.<br />
Reporting institutions have noted that<br />
in 70% of cases clients have been either<br />
“very” or “somewhat” affected in their<br />
ability to keep to loan payment schedules.<br />
As almost 80% of responding institutions<br />
also reported an increase in <strong>la</strong>te and/<br />
or <strong>de</strong>fault payments, this figure is not<br />
surprising.<br />
In the remaining areas, the responses<br />
were varied and no observable pattern can<br />
be seen regarding the impact on business<br />
performance, staff retention and <strong>de</strong>mand for<br />
services/products.
Finally, respon<strong>de</strong>nts were asked about their future p<strong>la</strong>ns. However, the questionnaire<br />
on this point was con<strong>de</strong>nsed to ask the same questions as the previous survey but in<br />
a more concise fashion. Respon<strong>de</strong>nts were asked to indicate future p<strong>la</strong>ns on growth<br />
and sustainability through the following questions:<br />
What are your most important future goals?<br />
What are the biggest constraints you face in reaching the above goals?<br />
12.1 Growth<br />
The majority of len<strong>de</strong>rs provi<strong>de</strong>d information regarding their future goals and could choose<br />
one or more responses to this question. The most important challenges are reaching financial<br />
sustainability, which is in line with the responses from the previous survey. Outreach to the<br />
most exclu<strong>de</strong>d is next, which differs from the previous survey, where European institutions<br />
listed social performance as the next most important goal. Scale as a response did not differ<br />
significantly from the responses of the previous survey.<br />
Graph 53: Most important future goals<br />
70%<br />
60%<br />
50%<br />
40%<br />
30%<br />
20%<br />
10%<br />
0%<br />
62%<br />
Financial<br />
sustainability<br />
46%<br />
outreach to the<br />
most exclu<strong>de</strong>d<br />
PeRCeNT oF ReSPoNDeNTS<br />
37%<br />
Social<br />
performance<br />
Future<br />
34%<br />
Scale<br />
12<br />
12%<br />
other<br />
71
<strong>EMN</strong> <strong>2008</strong>-<strong>2009</strong> <strong>Overview</strong><br />
72<br />
Respon<strong>de</strong>nts were asked to i<strong>de</strong>ntify<br />
constraints to growth and to rank their<br />
importance from 1 (most important) to 5 (least<br />
important). Lack of institutional capacity is<br />
the most significant and frequently i<strong>de</strong>ntified<br />
constraint. Appropriate legal and regu<strong>la</strong>tory<br />
environment are also concerns. Accessing<br />
funds to cover operational costs or for lending<br />
IMPoRTANCe<br />
12.2 Challenges<br />
Based on information gathered in the<br />
current study, access to long-term funding is<br />
the most commonly cited challenge faced by<br />
European microfinance institutions. The <strong>la</strong>ck<br />
of access to stable long-term funding restricts<br />
the institution in many ways – it restricts<br />
their ability to grow, to broa<strong>de</strong>n and <strong>de</strong>epen<br />
outreach across the sector, their ability to<br />
build institutional capacity, and their ability<br />
to reach sustainability, especially during<br />
the financial and economic crisis currently<br />
en<strong>de</strong>mic throughout Europe. Institutions also<br />
mentioned the need for regu<strong>la</strong>tory flexibility<br />
to be able to tap new opportunities for growth<br />
as the market is becoming more mature and<br />
saturated within Europe.<br />
The graduation of the previously targeted<br />
group into formal financial services and the<br />
general change of target focus was the next<br />
most cited challenge for institutions. Bulgaria,<br />
+<br />
-<br />
Lack of institutional capacity<br />
are at the bottom of the list. The constraints<br />
i<strong>de</strong>ntified and rated by institutions have<br />
not differed over the previous years. This<br />
<strong>de</strong>monstrates that, in spite of the expansion<br />
of the microfinance sector year after year,<br />
these institutions continue to confront the<br />
same constraints that have yet to be resolved,<br />
which limits growth in the sector.<br />
Lack of appropiate legal and regu<strong>la</strong>tory environment<br />
Lack of funds for lending<br />
Lack of funds to cover operational costs<br />
other<br />
Hungary and the Nether<strong>la</strong>nds noted the<br />
need to adapt and fine-tune the products<br />
and services currently offered to adjust to the<br />
perspectives and economic <strong>de</strong>velopment of<br />
the changing client base.<br />
Hungarian, Romanian and Spainish<br />
organisations raised concerns regarding<br />
the need for the standardization and<br />
professionalization of the sector by increasing<br />
coordination, training, monitoring and<br />
transparency standards across Europe. As<br />
pressure increases on European microfinance<br />
institutions to become more efficient, greater<br />
networking and training is nee<strong>de</strong>d to ensure<br />
that the sector reduces duplication of effort,<br />
works in a transparent manner and has welltrained<br />
professionals working in the sector.<br />
For more information regarding current<br />
challenges that participating countries are<br />
facing, please refer to the individual Country<br />
Summaries.
Conclusion<br />
13<br />
This fourth <strong>EMN</strong> survey presents a European microfinance sector that is beginning<br />
to feel the impact of the economic and financial crisis, but has yet to be <strong>de</strong>terred as a<br />
result. In spite of recent setbacks, such as access to funding, the European Union has<br />
helped keep microfinance activities running in Europe and the sector has continued<br />
to grow as a result. <strong>Microfinance</strong> can therefore be consi<strong>de</strong>red as a tool that is increasingly<br />
accessible for the socially and financially exclu<strong>de</strong>d members of society.<br />
Over the <strong>la</strong>st eight years, the number of microcredit actors has increased. There were<br />
18 new entrants that began lending in <strong>2008</strong> and <strong>2009</strong>. Eastern Europe has the most mature<br />
microfinance market while the Western European microfinance market is un<strong>de</strong>rgoing a<br />
process of consolidation. In terms of value of loans disbursed (or gross loan portfolio) France<br />
and Germany are responsible for 63% of the Western Europe market share and in terms of<br />
loans disbursed they represent a 73% of total number of loans disbursed in Western Europe.<br />
As a whole, the number of loans disbursed in the EU countries <strong>de</strong>creased by 7% between <strong>2008</strong><br />
and <strong>2009</strong>, though the value of loans disbursed increased by 3%, which may suggest an increase<br />
in the average loan value. This represents a change in the trend when compared to the previous<br />
survey. This edition also shows a change over previous years in the trend of average loan size,<br />
which was smaller in Eastern European countries than in Western Europe. Nevertheless, the<br />
average loan size between <strong>2008</strong> and <strong>2009</strong> <strong>de</strong>creased from 11,000 to 9,000 euros.<br />
In <strong>2009</strong>, the number of loans disbursed was 84,523 worth 828 million euros. Eastern European<br />
countries represent 40% of total loans and 26% of total value, whereas Western European<br />
countries represent 60% of total loans and 74% of total value. As a whole, the number of active<br />
clients in the EU was 135,815 at the end of <strong>2009</strong>.<br />
There continues to be diversity in the various types of organisation involved in microlending,<br />
including non-governmental organisations, foundations, government bodies, savings banks,<br />
banks, credit unions and non-bank financial institutions. Sixty percent of respon<strong>de</strong>nts have a<br />
non-profit status, 17% less than the previous survey. Most of the for-profit organisations can<br />
still be found in Bulgaria and Romania while the majority of non-profit organisations can be<br />
found in Hungary, Italy and Spain. As institutions reach for sustainability, long-term access to<br />
stable funding continues to be a challenge. As a result, for-profit institutions may be charging<br />
higher interest rates and granting <strong>la</strong>rger loans to recoup operational and financial costs.<br />
In general, microloans in the EU are disbursed either by small organisations or by big<br />
institutions where the microcredit programme represents a small portion of their activity.<br />
Twenty-four percent of respon<strong>de</strong>nts focus solely on microlending. Thirty-five percent focus<br />
primarily on microlending whilst for 49% lending makes up less than 25% of their activity<br />
73
<strong>EMN</strong> <strong>2008</strong>-<strong>2009</strong> <strong>Overview</strong><br />
74<br />
portfolio. 64% of len<strong>de</strong>rs employ fewer than<br />
five people in their microcredit programme.<br />
The biggest institutions in terms of number of<br />
employees are found in France, followed by<br />
Romania and then Hungary. Overall, Eastern<br />
EU organisations tend to have a greater<br />
number of employees than their Western EU<br />
counterparts.<br />
Len<strong>de</strong>rs continue to have a variety of<br />
mission statements but most are aligned<br />
in their mission focus. The mission of 70%<br />
of len<strong>de</strong>rs in Europe is microenterprise<br />
promotion, followed by job creation, then<br />
social inclusion and poverty reduction. These<br />
mission statements are very simi<strong>la</strong>r to previous<br />
surveys. Overall there is a greater emphasis in<br />
Western EU countries on the creation of jobs<br />
and financial and social inclusion whereas<br />
in the Eastern EU, where a <strong>la</strong>rger number of<br />
non-bank financial institutions exist, there<br />
is a greater emphasis on microenterprise<br />
promotion. The most targeted types of<br />
businesses are start-up enterprises followed<br />
closely by existing enterprises.<br />
57 percent of the European organisations<br />
disbursed less than 50 loans in <strong>2009</strong>. On the<br />
other hand, just 13% of the organisations<br />
disbursed greater than 400 loans in <strong>2009</strong>.<br />
These organisations are located mainly in<br />
Western EU countries (France, Germany and<br />
Spain), which signifies a change in ten<strong>de</strong>ncy<br />
over previous years, where institutions that<br />
disbursed more than 400 loans were located<br />
primarily in Eastern Europe. There are also<br />
some organisations in Bulgaria, Hungary,<br />
Romania and Po<strong>la</strong>nd that operate on a<br />
<strong>la</strong>rger scale.<br />
The increase in the number of organisations<br />
at the bottom-end of the market between<br />
2005 and <strong>2009</strong> may be exp<strong>la</strong>ined by the fact<br />
that a number of new organisations have<br />
entered the market over the <strong>la</strong>st few years,<br />
disbursing a small number of loans. At the<br />
same time, existing p<strong>la</strong>yers are growing<br />
and increasing their total number of loans<br />
disbursed per year.<br />
Microloan sizes varied from 220 euros<br />
to 37,000 euros. Average loan size is usually<br />
linked to the institutional type of the len<strong>de</strong>r.<br />
Banks, non-bank financial institutions and<br />
government bodies tend to offer <strong>la</strong>rger loans<br />
than credit unions, NGOs, savings banks<br />
or foundations. Loan size is also linked to<br />
organisational mission statements with len<strong>de</strong>rs<br />
focusing on SME growth making <strong>la</strong>rger loans<br />
in re<strong>la</strong>tion to per capita gross national income<br />
(GNI) than organisations focused on social and<br />
financial inclusion. In this regard, there is a<br />
clear divergence between Western and Eastern<br />
EU countries. Once again, the countries that<br />
are disbursing loans at over 100% of annual<br />
GNI per capita are Hungary and Romania,<br />
along with Bulgaria.<br />
Financially exclu<strong>de</strong>d people and startup<br />
or existing enterprises with five or fewer<br />
employees remain the primary business<br />
supported. Women, immigrants and/or ethnic<br />
minorities and the unemployed are the most<br />
significant at-risk groups. 44% of microcredit<br />
provi<strong>de</strong>rs in the EU target women, 41% target<br />
immigrants or ethnic minorities and 29% target<br />
youth. The disabled remain un<strong>de</strong>rserved by<br />
EU microfinance organisations.<br />
Loan financial conditions vary across<br />
len<strong>de</strong>rs. However, average microcredit<br />
conditions in EU could be <strong>de</strong>scribed as a<br />
9,400 euro loan granted for three years at<br />
an annual interest rate of 9%, in addition<br />
to some loan fees. 59% of len<strong>de</strong>rs do not<br />
require guarantees, based on the principles<br />
of microcredit. The remaining len<strong>de</strong>rs require<br />
borrowers to be part of a bank, EU or public<br />
guarantee program, or to have col<strong>la</strong>teral. The<br />
average time required by len<strong>de</strong>rs to disburse<br />
a microloan is 26 days.<br />
The majority of EU len<strong>de</strong>rs provi<strong>de</strong><br />
business <strong>de</strong>velopment services (BDS) and<br />
27% do not provi<strong>de</strong> BDS but refer clients to<br />
organisations that do. Microlen<strong>de</strong>rs focus on<br />
providing microenterprise loans with one half<br />
of organisations supplying other financial<br />
services such as personal microcredit loans,<br />
<strong>de</strong>bt counselling, savings, insurance, money<br />
transfer services or mortgages. This suggests<br />
a ten<strong>de</strong>ncy to cross sell other financial services<br />
to microcredit clients.<br />
Financial performance reporting has<br />
improved slightly across the sector. Amongst<br />
the 30% of len<strong>de</strong>rs that provi<strong>de</strong>d information<br />
on their operational self-sufficiency rates,<br />
the average OSS rate in <strong>2009</strong> was 93% and<br />
more than half of the respon<strong>de</strong>nts were<br />
operationally self-sustaining. In <strong>2009</strong>, the<br />
average repayment rate was 63%, 20 points<br />
below the previous survey, which could be<br />
a direct result of the impact of the recent<br />
crisis. The best financially performing<br />
organisations are located in Eastern EU<br />
countries, namely in Bulgaria and Romania,<br />
and are characterised by their for-profit legal<br />
status, as well as in France.<br />
With respect to access to funds to cover<br />
operational costs, in this edition of the survey<br />
the ten<strong>de</strong>ncy over previous surveys has been<br />
reversed. Respon<strong>de</strong>nts reported covering<br />
60% of operational costs through earned<br />
income, while the public sector has <strong>de</strong>clined<br />
as a source of financing. This <strong>de</strong>monstrates<br />
the continuing trend towards efficiency and<br />
self-sustainability as well as a contraction in<br />
public lending across Europe.
Questions regarding social performance<br />
and information technology were ad<strong>de</strong>d for<br />
the first time in the present edition, given the<br />
importance that these two areas represent<br />
in the microfinance sector. In information<br />
technology, microfinance institutions are<br />
becoming increasingly aware of the importance<br />
of a good management information system<br />
(MIS) as a means of increasing the efficiency<br />
and productivity of employees. As a result,<br />
nearly 60% of microfinance institutions are<br />
using MIS software and a <strong>la</strong>rge majority of<br />
respon<strong>de</strong>nts felt that their system covered<br />
their needs. In regards to social performance,<br />
institutions were asked if they carried out<br />
impact studies of their clients and 60%<br />
respon<strong>de</strong>d positively. The most common<br />
methods used to measure social impact<br />
were listed as individual interviews with<br />
clients and staff/loan officer observations.<br />
Responding institutions also noted the impact<br />
microcredit programmes were having on<br />
the lives of their clients. Positive gains were<br />
found in clients’ economic situation and their<br />
financial inclusion.<br />
As a whole, the responding institutions<br />
continue to cite the <strong>la</strong>ck of access to longterm<br />
funding as a challenge to the future of<br />
the sector. Without stable access to funding,<br />
the growth of the microcredit sector may be<br />
limited and institutions may not be able to<br />
reach self-sufficiency as a result. Institutions<br />
also need regu<strong>la</strong>tory flexibility to be able to<br />
tap new opportunities for growth and to target<br />
new groups of people as previous clients<br />
graduate into new financial strata of society.<br />
Greater professionalization of the sector is<br />
nee<strong>de</strong>d with training of new microfinance<br />
experts as well as increased networking<br />
across Europe to increase transparency, to<br />
avoid duplication of effort and to share best<br />
practices in the field.<br />
75
<strong>EMN</strong> <strong>2008</strong>-<strong>2009</strong> <strong>Overview</strong><br />
76<br />
14 Country summaries<br />
Belgium<br />
Macroeconomic data<br />
Total popu<strong>la</strong>tion: 10.8 million (<strong>2009</strong>)<br />
Urban popu<strong>la</strong>tion: 97% (2007)<br />
GDP per capita: €24,700 (<strong>2008</strong>)<br />
Unemployment rate: 8% (<strong>2009</strong>)<br />
Popu<strong>la</strong>tion below the poverty line: 15%<br />
Popu<strong>la</strong>tion in a situation of financial exclusion: 1% (2007)<br />
Sources: Eurostat, Insee, REM, In<strong>de</strong>xmundi.com.<br />
Legal framework for microfinance and policy initiatives<br />
The origin of social finance is very old in Belgium, and goes back to the creation of the “Mont Piété”,<br />
a charitable institution which granted loans against col<strong>la</strong>teral to exclu<strong>de</strong>d persons. This institution still<br />
exists today.<br />
Microcredit, however, <strong>de</strong>veloped significantly with the <strong>la</strong>unching by the King Baudouin Foundation of<br />
the “solidarity loan” project in 1997. The Fonds <strong>de</strong> Participation and Crédal, both created in 1984, have been<br />
operating for more than 25 years. The Fonds <strong>de</strong> Participation is a public credit organism. In 2002, it took over the<br />
“solidarity loan” project of the King Baudouin Foundation.<br />
There is no specific legal framework for microcredit activities. Several organisms have set up training<br />
and support services, in particu<strong>la</strong>r for unemployed people who wish to become self-employed; these<br />
people continue to receive their specific benefits during the training periods, but lose them once their<br />
enterprise has started (there can be certain exemptions for a duration of six months).<br />
Banks themselves do not offer microcredits to their clients; they act through a partnership with the<br />
microfinance institutions. This is, for example, the case of the partnership with the Fonds <strong>de</strong> Participation<br />
which allows the client to apply for a microcredit and a complementary bank loan at the same time.<br />
MFIs are not authorized to collect <strong>de</strong>posits; this limits their scope of action.<br />
Unlike the banks, public authorities give significant support to the microfinance institutions, either<br />
through financing or through guarantee mechanisms.<br />
Principal microfinance activity<br />
N° of survey participants: 4<br />
N° of active clients (Dec. <strong>2009</strong>): 3,491
N° of loans disbursed <strong>2009</strong>: 835<br />
Value of loans disbursed <strong>2009</strong>: €16.7 million<br />
37% of female clients; % immigrant/ethnic minority clients: ND<br />
In Belgium, the four main MFIs are: Fonds <strong>de</strong> Participation; Crédal; Hefboom; Brusoc.<br />
The Fonds <strong>de</strong> Participation, a fe<strong>de</strong>ral financial institution, supports and accompanies self-employed<br />
persons, small and medium-sized enterprises, as well as job-seekers who wish to create their own activity.<br />
Crédal is a credit cooperative that proposes microcredit for entrepreneurial (MC2) and personal<br />
purposes (“prêt social accompagné”, “prêt vert”). Moreover, since 2005, it runs a programme specifically<br />
targeted at women entrepreneurs, the AFFA programme (“Affaires <strong>de</strong> Femmes, Femmes d’Affaires”).<br />
Another organism, Hefboom, has been offering microcredits of a maximum amount of €12,500 since the<br />
end of 2007. Its activity covers the Flemish region.<br />
In Belgium, as in the other European countries, microcredit targets socially exclu<strong>de</strong>d persons or persons<br />
at risk of exclusion (unemployed or economically inactive persons), as well as microentrepreneurs<br />
without access to traditional bank credit. There are specific programmes for young people less than thirty<br />
years old and for women (provi<strong>de</strong>d by Fonds <strong>de</strong> Participation and Crédal in particu<strong>la</strong>r). The <strong>Réseau</strong><br />
Financement Alternatif, created in 1987, is an association which <strong>de</strong>velops tools and financial mechanisms<br />
with an ethical and social character for its members. Organized as a network, it aims to promote alternative<br />
products by means of campaigns, studies and research.<br />
Finally, in<strong>de</strong>pen<strong>de</strong>ntly of the MFIs, it is necessary to mention The Walloon Financing and Guarantee<br />
Company for Small and Medium-sized Enterprises (SOWALFIN), a limited company of public interest,<br />
created in 2002, which aims more wi<strong>de</strong>ly to support the setting up and <strong>de</strong>velopment of SMEs in the<br />
Walloon region. In particu<strong>la</strong>r, it guarantees up to 75% of the amount of the loans granted by banks to very<br />
small or medium-sized companies. In <strong>2009</strong>, 44 microcredits (max. 25,000€) were re-insured for a total<br />
amount of €525,066.<br />
In Belgium, in <strong>2009</strong> 835 microloans were disbursed with an average of €17,000.<br />
Principal challenges<br />
The challenges for the microcredit sector lie in the respective roles of public authorities and MFIs.<br />
It would be helpful to further promote the in<strong>de</strong>pen<strong>de</strong>nt worker status with incentives that have an<br />
immediate effect, i.e. the possibility of maintaining unemployment benefits during the <strong>la</strong>unch of a selfemployed<br />
activity or the reduction of social security contributions. In terms of financing, government<br />
subsidies to MFIs are usually given out punctually; guaranteed recurring funding to MFIs on a longer<br />
term would provi<strong>de</strong> them with a more stable financing source. Additionally, guarantee mechanisms<br />
could be further <strong>de</strong>veloped.<br />
For the MFIs, in or<strong>de</strong>r to reach out to the target public, it could be beneficial to strengthen their<br />
communication means and simplify the loan approval procedure. Moreover, efforts towards operational<br />
and financial sustainability could help MFIs gain more in<strong>de</strong>pen<strong>de</strong>nce from public subsidies. Finally, more<br />
impact studies could help increase the credibility of MFIs and enable them to present concrete results to<br />
public or private financiers.<br />
Sources: http://www.european-microfinance.org/pays_en.php?piId=19; <strong>Réseau</strong> Financement Alternatif, Le microcredit en Belgique:<br />
naissance, état <strong>de</strong>s lieux et future, March <strong>2009</strong>.<br />
Authors: Cesarea Brisbois and Stefanie Lämmermann, <strong>EMN</strong>.<br />
77
<strong>EMN</strong> <strong>2008</strong>-<strong>2009</strong> <strong>Overview</strong><br />
78<br />
Bulgaria<br />
Macroeconomic data (Dec <strong>2009</strong>)<br />
Total popu<strong>la</strong>tion: 7.6 million<br />
Urban popu<strong>la</strong>tion: 71%<br />
GDP per capita: €4,467<br />
Unemployment rate: 9.1%<br />
Popu<strong>la</strong>tion below the poverty line: 21% (<strong>2008</strong>)<br />
Popu<strong>la</strong>tion in a situation of financial exclusion: ND<br />
% of microenterprises: 99% (all sole proprietor, family business, small tra<strong>de</strong> and producing companies<br />
up to 10 employees)<br />
Sources: Bulgarian National Bank, National Statistical Institute, Eurostat, Bulgarian Association of Microenterprises.<br />
Legal framework for microfinance and policy initiatives<br />
There is no special <strong>la</strong>w concerning microcredit. Currently, the legal framework for microscale<br />
lending carried out by smaller institutions in Bulgaria is <strong>de</strong>fined by the Credit Institutions<br />
Act (CIA), the Cooperatives Act and Ordinance No. 26 of 23 April <strong>2009</strong> on Financial Institutions.<br />
The CIA regu<strong>la</strong>tes credit institutions, banks and financial institution that can provi<strong>de</strong> loans as well as<br />
other matters re<strong>la</strong>ted to banks and lending (in this sense also microcredit).<br />
Many of the local microfinance actors are registered un<strong>de</strong>r the Cooperatives Act (CA). Pursuant to Art.36,<br />
par.3 of the CA, cooperatives may perform <strong>de</strong>posit and lending activities, pursuant to a <strong>de</strong>cision of its General<br />
Meeting and a <strong>de</strong>cision of the Bulgarian National Bank un<strong>de</strong>r conditions and procedures stipu<strong>la</strong>ted in a special<br />
<strong>la</strong>w. So far such a <strong>la</strong>w has not been adopted.<br />
Financial institutions, which are not subject to licensing or registering un<strong>de</strong>r another <strong>la</strong>w, shall be recor<strong>de</strong>d<br />
in a register of the BNB in or<strong>de</strong>r to conduct activities. The register shall be public and a certificate shall be<br />
issued thereof. Financial Institutions can provi<strong>de</strong> loans with funds other than accepted <strong>de</strong>posits or other<br />
repayable funds, and through mutual aid funds extending loans only to their members on the account of<br />
contributions ma<strong>de</strong> by them and at their risk according to CIA. Non-Bank <strong>Microfinance</strong> Institutions are not<br />
authorized to collect savings.<br />
Principal microfinance activity<br />
N° of survey participants: 16<br />
N° of active clients in Dec. <strong>2009</strong>: 3,248<br />
N° of loans disbursed <strong>2009</strong>: 2,637<br />
Value of loans disbursed <strong>2009</strong>: €98.3 million<br />
33% of female clients; 4% of immigrant/ethnic minority clients<br />
A total of 16 organisations participated in the survey. However, the whole microfinance sector<br />
in Bulgaria is bigger. In <strong>2009</strong>, microcredits represented an amount of € 566 million for 91,649 loans.<br />
Overall, 20 banks corresponding to 69% of all banks operate in the SME sector. The microfinance sector<br />
in Bulgaria also inclu<strong>de</strong>s a group of experienced MFIs who piloted various programmes over the past<br />
<strong>de</strong>ca<strong>de</strong>. <strong>Microfinance</strong> in Bulgaria emerged in the early 1990s primarily as a donor-driven tool to address<br />
some urgent aspects of transition.<br />
Most microfinance operations started as pilot projects or programmes initiated and fun<strong>de</strong>d by<br />
international donors, which inclu<strong>de</strong>d the United States Agency for International Development (USAID),
the EU Phare Programme, bi<strong>la</strong>teral cooperation mechanisms (with Germany and Switzer<strong>la</strong>nd), the Soros<br />
Open Society Institute, and the Catholic Relief Services (CRS).<br />
Among the pioneers in the industry were the foundation Nacha<strong>la</strong> (established with USAID funds<br />
in 1993) and the EU Phare credit cooperatives (1995). Other programmes also chose that mo<strong>de</strong>l to take<br />
advantage of the credit cooperative exemption, usually un<strong>de</strong>r memoranda of un<strong>de</strong>rstanding between<br />
the Government and donors. The World Council of Credit Unions <strong>la</strong>unched its technical assistance<br />
programme for the kasas, or credit unions, and CRS began a microfinance group-lending program<br />
through USTOI. The United Nations Development Programme piloted alternative microfinance options<br />
through several small projects in 1998-2000, notably loan guarantees and financial leasing for business<br />
equipment. A service company mo<strong>de</strong>l for <strong>de</strong>livering microfinance was <strong>la</strong>unched by the Open Society<br />
Foundation in 1999.<br />
All non-bank MFIs i<strong>de</strong>ntify their mission as a contribution towards fighting social and/or financial<br />
exclusion, job creation and entrepreneurship promotion. <strong>Microfinance</strong> institutions in Bulgaria i<strong>de</strong>ntify<br />
a range of client groups: micro and small businesses, start-up businesses, unemployed people, poor<br />
people, agricultural producers, self-employed, women, ethnic minorities, youth, disabled people, rural<br />
popu<strong>la</strong>tion and the financially exclu<strong>de</strong>d. Some of the institutions target ethnic minorities and have special<br />
products for them.<br />
The banks are providing working capital and investment loans ranging on average between €5,000<br />
and €13,000. Loan terms vary from 3 to 6 years mainly for investment loans. Working capital loans are<br />
usually for 12 months with revolving terms. The interest rates are in the range of 7 to 15 per cent. The<br />
common practice for banks is to guarantee the loans with col<strong>la</strong>teral (real estate or other physical assets).<br />
MFIs in Bulgaria provi<strong>de</strong> a variety of products that address in different ways the main barriers<br />
preventing clients from access to bank financing – <strong>la</strong>ck of assets and property to cover guarantee/<br />
col<strong>la</strong>teral requirements; poor financial skills and no credit history; <strong>la</strong>ck of formal books, accounts and<br />
financial statements among micro and rural entrepreneurs; reluctance to disclose business and income<br />
information to the institutions, etc. <strong>Microfinance</strong> institutions in Bulgaria provi<strong>de</strong> financial products with<br />
terms and conditions adapted for their target groups. The MFIs are providing loans ranging on average<br />
between €1,300 and €15,800. Loan terms vary from 1 to 4 years mainly for investment loans. The interest<br />
rates are in the range of 9 to 23 percent.<br />
Principal challenges<br />
<strong>Microfinance</strong> institutions in Bulgaria are now entering into a phase of maturity, backed by a <strong>de</strong>ca<strong>de</strong> of<br />
experience in the very difficult context of transition, they need to focus on their ability to tap new opportunities<br />
for growth to serve their unique market. They have gained momentum and must be even more innovative<br />
and pro-active, diversifying and improving their approaches, products, services and operating practices.<br />
The big issue is to further broa<strong>de</strong>n and <strong>de</strong>epen the outreach of microfinance to particu<strong>la</strong>r at-risk groups,<br />
which may be more difficult to reach.<br />
Another challenge for the sector, which is particu<strong>la</strong>rly relevant for those non-bank MFIs that are<br />
committed to serving the needs of socially exclu<strong>de</strong>d people and communities, is that most MFIs <strong>la</strong>ck<br />
financial resources to expand their services. Development of long-term funding strategies is essential<br />
for increasing outreach and sustainability, and if such strategies are to work and be successful, they will<br />
require consistent strengthening of MFI capacities. The current clientele of the microfinance industry in<br />
Bulgaria – typically micro and small business owners and self-employed people, is becoming ready to<br />
graduate to formal financial services as a result of economic <strong>de</strong>velopment, financial sector growth and<br />
the critical support they have received through microfinance. Therefore, the MFIs need to be prepared to<br />
adapt and fine-tune their products and <strong>de</strong>livery methods to the needs of the next generation of microcredit<br />
users, with an ever growing shift to disadvantaged popu<strong>la</strong>tions and inclusion.<br />
Author: Niko<strong>la</strong>y Yarmov, CEED.<br />
79
<strong>EMN</strong> <strong>2008</strong>-<strong>2009</strong> <strong>Overview</strong><br />
80<br />
France<br />
Macroeconomic data<br />
Total popu<strong>la</strong>tion: 64.4 millions (<strong>2009</strong>)<br />
Urban popu<strong>la</strong>tion: 77% (2007)<br />
GDP per capita: €22,900 (<strong>2008</strong>)<br />
Unemployment rate: 9,9% (<strong>2009</strong>)<br />
Popu<strong>la</strong>tion below the poverty line: 13% (<strong>2008</strong>)<br />
Popu<strong>la</strong>tion in a situation of financial exclusion: 2% (2007)<br />
% of microenterprises: 92% (2007)<br />
Sources: Eurostat, Insee, REM, In<strong>de</strong>xmundi.com.<br />
Legal framework for microfinance and policy initiatives<br />
France is one of the countries in Europe where the microfinance activity is at present re<strong>la</strong>tively<br />
evolved. Bank microcredit was <strong>de</strong>veloped by France Initiative in 1985. It is a fe<strong>de</strong>ration of organisms<br />
whose mission is to facilitate business start-ups at the local level with the support of the Local Authorities<br />
and in connection with the banks. Moreover, in 1988, the Association France Active was established as<br />
a product of the “Fondation <strong>de</strong> France”, the “Caisse <strong>de</strong>s Dépôts et Consignations”, l’Agence Pour <strong>la</strong><br />
Création d’Entreprise (APCE) and the Crédit Coopératif. Non-bank microcredit was initiated in 1989 by<br />
Maria Nowak who created Adie (Association pour le Droit à l’Initiative Economique) whose fundamental<br />
mission is to grant microcredits to socially and financially exclu<strong>de</strong>d persons.<br />
During the <strong>la</strong>st twenty years, the legis<strong>la</strong>tive context and the whole regu<strong>la</strong>tory framework have evolved,<br />
allowing a more coherent growth of microcredit in the country. This evolution is <strong>la</strong>rgely due to the lobbying<br />
actions of Adie. The “Law for Economic Initiative” of August 2003, and the “Law in favour of Small and<br />
Medium-sized Enterprises” of August 2005, have produced a simplification of procedures. And even more<br />
importantly, the legal measures taken to simplify registration procedures as well as the implementation since<br />
<strong>2009</strong> of the status of “auto-entrepreneur”, have had a very beneficial impact on the <strong>de</strong>velopment of business<br />
start-ups.<br />
Finally, the French State has shown its interest in this activity through the “Supporting the <strong>de</strong>velopment<br />
of microfinance” section of the Social Cohesion Law (Borloo Law of January 2005). This <strong>la</strong>w recognizes<br />
the importance of the auto-entrepreneurship initiative and aims to further facilitate access to support<br />
services for job creation as a way of returning to employment. The Social Cohesion Fund, endowed with<br />
€73 million, created at the same time, in particu<strong>la</strong>r guarantees loans to unemployed persons wishing to<br />
set up their own activity, as well as a new type of loan, the “personal microcredit”, inten<strong>de</strong>d to finance<br />
personal projects (mobility, training, professional integration, etc.).<br />
Principal microfinance activity<br />
N° of survey participants: 6<br />
N° of active clients in Dec. <strong>2009</strong>: 70,252<br />
N° of loans disbursed <strong>2009</strong>: 28,863<br />
Value of loans disbursed <strong>2009</strong>: €152.6 million<br />
35% of female clients: 19% of immigrant/ethnic minority clients<br />
A <strong>la</strong>rge part of the activity is produced by Adie, which has now a network of 130 offices and 400<br />
contact points throughout France. Adie has more than 400 employees and 1,200 volunteers and 14,581
loans granted in <strong>2009</strong>. It has at the moment more than 26,500 active clients. The integration rate of the<br />
persons financed (meaning the rate of financed persons who left social assistance programmes during the<br />
<strong>la</strong>st five years) stands at 80%. Since 2001, modifications to the banking <strong>la</strong>w have allowed Adie to directly<br />
on-lend funds borrowed from the banks; this contributed appreciably to improving the functioning of<br />
the whole programme by accelerating the processing of requests. Adie serves exclusively non-bankable<br />
borrowers, i.e. financially and often socially exclu<strong>de</strong>d persons.<br />
Other significant associations work at the local or national level. They primarily serve nearly bankable<br />
clients (existing microenterprises and c<strong>la</strong>ssical microenterprises in the start-up phase). The France<br />
Initiative association, which has a <strong>de</strong>centralized network, has a highly <strong>de</strong>veloped activity with regard<br />
to so-called “honour loans” (“prêts d’honneur”), loans at zero interest, which allow the beneficiaries to<br />
access significant complementary bank credits. The Association France Active which operates mainly<br />
with funds from the Caisse <strong>de</strong>s Dépôts, participates actively in the <strong>de</strong>velopment of economic activity, in<br />
particu<strong>la</strong>r through the guarantee funds which it has set up. These funds target microentrepreneurs, and<br />
guarantee the loans obtained from other organisms (banks, etc.).<br />
Parcours Confiance, created in 2006, brings together the associations set up by the savings banks<br />
(“caisses d’épargne”) which also aim to fight financial exclusion through the provision of microloans.<br />
These associations are non-profit bodies, even if they remain connected to the banks that created them.<br />
Finally the MFI CREA-SOL is an association created by the Caisse d’Epargne <strong>de</strong> Provence-Alpes-Corse. It<br />
finances and accompanies persons exclu<strong>de</strong>d from the banking system; it grants microcredits to individuals<br />
or very small firms. In <strong>2009</strong> 28,863 loans were disbursed (including the “prêts d’honneur” of France<br />
Initiative) in France, with an average of 4,950€.<br />
Principal challenges<br />
Despite its dynamism, the microcredit activity in France still faces several barriers. The concept of<br />
microcredit as such does not exist, and the only existing <strong>de</strong>finition today is that of the European Union<br />
(credits below €25,000). The sector brings together very different actors, with different economic mo<strong>de</strong>ls<br />
and sources of funding, and thus heterogeneous mo<strong>de</strong>s of functioning. Potential clients may thus find<br />
the offer -microcredit and support services- complex and difficult to un<strong>de</strong>rstand; however, the <strong>de</strong>mand<br />
remains high.<br />
The challenges are important because both offer and <strong>de</strong>mand are significantly growing in this sector<br />
of activity and private financial organisms and public institutions are getting more and more interested,<br />
in view of the results obtained by the sector in the recent years. The recently published report of the<br />
Department of Financial Supervision (Inspection Générale <strong>de</strong>s Finances) proposes four concrete axes<br />
of action in or<strong>de</strong>r to reinforce the activity and improve the efficiency of the programmes: c<strong>la</strong>rifying<br />
the <strong>de</strong>finitions and contents of the offer, further <strong>de</strong>veloping the support services which consi<strong>de</strong>rably<br />
improve the clients’ success chances, easing and simplifying guarantee mechanisms, and finally, inciting<br />
commercial banks to engage more strongly in the microcredit sector.<br />
Sources: Rapport <strong>de</strong> l’Inspection Générale <strong>de</strong>s Finances <strong>de</strong> décembre <strong>2009</strong> sur le microcrédit (Rapport n°<strong>2009</strong>-M-085-03).<br />
Authors: Cesarea Brisbois and Stefanie Lämmermann, <strong>EMN</strong>.<br />
81
<strong>EMN</strong> <strong>2008</strong>-<strong>2009</strong> <strong>Overview</strong><br />
82<br />
Germany<br />
Macroeconomic data<br />
Total popu<strong>la</strong>tion: 81,850 million (<strong>2009</strong>)<br />
Urban popu<strong>la</strong>tion: 74% (<strong>2009</strong>)<br />
GDP per capita: €29,400 (<strong>2009</strong>)<br />
Unemployment rate: 8.6% (2010)<br />
Popu<strong>la</strong>tion below the poverty line: 15% (<strong>2008</strong>)<br />
Popu<strong>la</strong>tion in a situation of financial exclusion: 3% (2007)<br />
Sources: Bun<strong>de</strong>sagentur für Arbeit, Statistisches Bun<strong>de</strong>samt Deutsch<strong>la</strong>nd, Eurostat, INSEE, <strong>EMN</strong>.<br />
Legal framework for microfinance and policy initiatives<br />
The German banking sector alone is authorized to supply credits; this state of affairs obliges<br />
microfinance institutions to make agreements with banks in or<strong>de</strong>r to be able to grant loans. Besi<strong>de</strong>s this,<br />
public bodies - like (regional) Ministries - are allowed to disburse loans as a component of employment<br />
and economic <strong>de</strong>velopment schemes.<br />
Principal microfinance activity<br />
N° of survey participants: 16<br />
N° of loans disbursed <strong>2009</strong>: 8,208<br />
Value of loans disbursed <strong>2009</strong>: €147.8 million<br />
2% of female clients; 1% of immigrant/ethnic minority clients<br />
In Germany, the microfinance sector is <strong>de</strong>veloping. In the past, banks and public authorities showed<br />
re<strong>la</strong>tively little interest in this type of activity. However, for about ten years, the interest of public<br />
authorities in this sector has been growing. We can notice significant and continual changes in products<br />
and institutions supplying microcredits. In recent years, several microfinance programmes have entered<br />
the market while others have withdrawn from it or changed their products and operations.<br />
Today we can note three types of programs:<br />
Those of the regional and <strong>de</strong>velopment banks, of which the most conspicuous is the KfW<br />
Mittelstandsbank (KfW) which, in particu<strong>la</strong>r, targets small and medium-sized enterprises; KfW<br />
supplies credit lines, guarantees 80 % of the loans granted by the banks (public banks, savings<br />
banks, cooperative banks and private banks) and fixed processing fees per loan disbursed (f.e.<br />
“KfW Startgeld”). In addition to investment finance, KfW Mittelstandsbank provi<strong>de</strong>s advice<br />
(“Grün<strong>de</strong>rcoaching Deutsch<strong>la</strong>nd”) by regional institutions like chambers of commerce. Here starters<br />
and young enterprises can apply for grants to finance approved consultants.<br />
Those of private bodies, set up in business start-up centres, accredited by the German <strong>Microfinance</strong><br />
Institute (Deutsches Mikrofinanz Institut, DMI); these private bodies operates as intermediaries and<br />
provi<strong>de</strong> loans by the ethical-ecological GLS Bank within the framework of the German Microloan<br />
Fund. Besi<strong>de</strong> approval of loan application, loan recommendation to the bank and ongoing client<br />
/ loan monitoring, they often also provi<strong>de</strong> companies with the necessary support and training.<br />
Their target groups are often economically disadvantaged areas and target groups. Basic principle<br />
of accreditation as a DMI-MFI is the participation at a quality and risk management system with<br />
a monthly analysis of portfolio of risk for all MFIs (DMI Benchmarking) and the participation at<br />
bimonthly workshops. The German Microloan fund started on January, 27, 2010 and supports the<br />
provision of loans to microenterprise starters and micro / small enterprises with a volume of € 100
Mio (€ 60 Mio by the European Social Fund and € 40 Mio budget fund of the Fe<strong>de</strong>ral Ministry of<br />
Employment and Social Affairs). Besi<strong>de</strong> risk covering for microloans, the fund grants at this time €<br />
800 for each microloan, which MFIs can use to cover institution building costs. This helps to increase<br />
the number of MFIs and microloans (2006-<strong>2009</strong>: 12 MFIs and 521 microloans thereof 273 microloans<br />
in <strong>2009</strong>; I. Quarter 2010: 15 MFIs and 270 microloans).<br />
Those of governmental or para-governmental bodies such as the ARGEs (local job centres<br />
resulting from an agreement between social services and the municipalities) that locally target<br />
financially and socially exclu<strong>de</strong>d persons such as immigrants and the unemployed.<br />
Principal challenges<br />
The sector is <strong>de</strong>veloping, even if microfinance is still a young activity. The <strong>la</strong>ck of financing and the<br />
<strong>la</strong>ck of means in general affect the activity overall, in particu<strong>la</strong>r that of the private bodies. This is a crucial<br />
point, particu<strong>la</strong>rly when consi<strong>de</strong>ring that DMI-MFIs e.g. have to cover 20% of the <strong>de</strong>fault risk for which<br />
they have to set up a <strong>de</strong>posit account at the cooperating GLS Bank. Thus, the creation of the “Microloan<br />
Fund Germany” in 2010 and its financial support for MFI is an import step forward for the <strong>de</strong>velopment<br />
of a microfinance sector.<br />
Banks and microfinance institutions serve different clients. Therefore it is important to improve the<br />
provision of bank loans for bankable starters and SMEs on the one hand and nearly bankable microenterprise<br />
starters and very small and small enterprises on the other hand.<br />
Concerning the second target group the general goal of the “Mikrokreditfonds Deutsch<strong>la</strong>nd“ is the<br />
disbursement of total 15,000 microloans until 2015. In or<strong>de</strong>r to reach this goal the “German <strong>Microfinance</strong><br />
Institute” DMI and the affiliated microfinance institutions have to achieve increased professionalism to<br />
bring microfinance from small numbers into the mainstream (increase of outreach) and to establish more<br />
intermediaries (increase of MFIs). MFIs have a special need for improvement regarding the following<br />
topics: co-operation to boost outreach (multiplier); product-<strong>de</strong>velopment; public re<strong>la</strong>tion / common<br />
DMI-branding; production /processes; building of competences / personal / qualifications; sources to<br />
finance cost of operations and raising liability / risk capital (20% of yearly loan sum).<br />
To support this <strong>de</strong>velopment, a transnational exchange project – support by the Fe<strong>de</strong>ral Ministry of<br />
Employment and Social Affairs – started and is searching for cooperation with microfinance networks<br />
and practitioners in EU member states for the next two years.<br />
Authors: Stefanie Lämmermann, <strong>EMN</strong> and Brigitte Maas, DMI.<br />
83
<strong>EMN</strong> <strong>2008</strong>-<strong>2009</strong> <strong>Overview</strong><br />
84<br />
Hungary<br />
Macroeconomic data (Dec <strong>2009</strong>)<br />
Total popu<strong>la</strong>tion: 10 million<br />
Urban popu<strong>la</strong>tion: 30%<br />
GDP per capita: €5.390<br />
Unemployment rate: 10,8%<br />
Popu<strong>la</strong>tion below the poverty line: 12%<br />
Popu<strong>la</strong>tion in a situation of financial exclusion: 34%<br />
% of microenterprises: 95%<br />
Legal framework for microfinance and policy initiatives<br />
Microcredit in Hungary microcredit has been provi<strong>de</strong>d by the Local Enterprise Agencies (or LEAs),<br />
which are the specialized units of the enterprise promotion foundations created with the financial and<br />
technical assistance of the EU PHARE programme since 1992. In 2000 the Hungarian Foundation for<br />
Enterprise Promotion (HFEP) <strong>la</strong>unched the National Microcredit Programme through the LEAs, partly<br />
by centralizing the local microcredit funds of the LEAs. Since 2004, other non-bank institutions have also<br />
been providing microcredit. In 2005, started the Microcredit Plus Programme operated by the Hungarian<br />
Development Bank through the limited liability companies owned by the LEAs. In 2007, the JEREMIE<br />
programme was implemented in Hungary and bran<strong>de</strong>d New Hungary Microcredit Programme,<br />
disbursing credit through 52 intermediary agencies (including several commercial banks and savings<br />
cooperatives). However, over 97% of the amount disbursed the <strong>la</strong>st 2 years was lent by 10 LEAs and<br />
MIFIN, a new organization foun<strong>de</strong>d by HFEP, with the share of LEAs in microcredit provision increasing<br />
gradually. In the <strong>la</strong>st 14 months their total microcredit disbursement of LEAs excee<strong>de</strong>d each month the<br />
amount disbursed by all other organizations combined.<br />
In terms of legis<strong>la</strong>tion Act XXXIX/2003 on the modification of Act CXII/1996 on lending institutions<br />
and financial enterprises, <strong>de</strong>fines operational rules and conditions for microcredit provision by profitoriented<br />
financial institutions. However, the microlending activities of the enterprise promotion<br />
foundations and any lending from the National Microcredit Fund,are exempted from this <strong>la</strong>w, on the<br />
basis of Article 1 of this Act.<br />
A significant part of commercial banks and saving cooperatives take part in the New Hungary Microcredit<br />
Programme, however their share in the disbursement of microcredit is minimal. Banks provi<strong>de</strong> mainly<br />
regu<strong>la</strong>r loans to microenterprises without any counselling or mentoring.<br />
Banks provi<strong>de</strong> personal consumer loans provi<strong>de</strong>d as well as some other financial institutions (e.g.<br />
PROVIDENT) and informal credit provi<strong>de</strong>rs (moneylen<strong>de</strong>rs) at very high interest rates. However, such<br />
activities cannot be consi<strong>de</strong>red as microcredit since they do not help in creation of microenterprises,<br />
emplyment or social inclusion.<br />
Principal microfinance activity<br />
N° of survey participants: 22<br />
N° of active clients in Dec. <strong>2009</strong>: 181,897<br />
N° of loans disbursed <strong>2009</strong>: 10,402<br />
Value of loans disbursed <strong>2009</strong>: €181.9 million<br />
2.5 % of female clients; 0.33% of immigrant/ethnic minority clients
The local enterprise agencies in the counties and the capital cities that make up the Hungarian<br />
<strong>Microfinance</strong> Network are the most important actors of the Hungarian microfinance sector. http://www.<br />
hungarian-microfinance.org.hu/. The members of the Hungarian <strong>Microfinance</strong> Network, the local<br />
enterprise agencies in the counties and the capital city started their microfinance activities in 1992 with<br />
professional and financial support from the PHARE SME program. Since its inception, the LEA Network<br />
ma<strong>de</strong> over 29,000 loan contracts and dispersed over HUF 60 billion (ca. EUR 220-230 million) worth Microcredit<br />
and Microcredit Plus to microenterprises (up to autumn <strong>2009</strong>), <strong>de</strong>spite permanent <strong>la</strong>ck of resources and<br />
shortcomings in central regu<strong>la</strong>tions which hin<strong>de</strong>red their operation.<br />
Other <strong>Microfinance</strong> institutions in Hungary, besi<strong>de</strong>s the LEAS, inclu<strong>de</strong> Mikrohitel Zrt and Life Career<br />
Foundation, which also have microcredit programmes, although their microcredit portfolio is small and<br />
their activities are not exclusively oriented towards SME lending but also inclu<strong>de</strong> lending to NGOs, or<br />
Inclusion lending. Mikrohitel together with Autonomia Foundation have managed a small pilot program<br />
based on the Grameen mo<strong>de</strong>l for lending to Roma Communities in rural communities. Besi<strong>de</strong>s this, the<br />
Polgár Foundation for Equal Opportunities has just <strong>la</strong>unched a new microcredit program targeting Roma<br />
communities with EU support, also based on the Grameen mo<strong>de</strong>l. Constructions currently operated by<br />
the Hungarian <strong>Microfinance</strong> Network: In December 2005, after several years of professional <strong>de</strong>bate, the<br />
Economy Minister, approved of most of the initiatives of the Hungarian Enterprise Promotion Network<br />
Consortium regarding the re-establishment of the Local Microcredit Funds and the rationalization of the<br />
National Microcredit Program, with the re-establishment in 2006-2007 of Local Microcredit Funds.<br />
The Hungarian Enterprise Promotion Network Consortium <strong>de</strong>veloped a multi-stage microcredit<br />
system, with complementary products that is operated by LEAs members of the network, including:<br />
The Local Microcredit Program (with resources from Local Microcredit Funds)<br />
The National Microcredit Program (with resources from the National Microcredit Fund)<br />
The Microcredit Plus Program (with resources from the Hungarian Development Bank)<br />
The New Hungary Microcredit Programme: it was created from European Union funds within<br />
the framework of the Hungarian Economic Development Operative Programme (i.e. GOP) on the<br />
initiative of the JEREMIE programme. The funds for this programme are managed by Venture Finance<br />
Hungary Private Limited Company, which provi<strong>de</strong>s funding for microcredit, guarantees and venture<br />
capital funds. 12 LEAs, have been refinanced through this program for their microcredit activities.<br />
Principal challenges for <strong>Microfinance</strong> in Hungary<br />
Enforcing professionalism of the sector and rationalization of the national Microcredit Program.<br />
Developing structures that are more suited to the target group of social and entrepreneurial microlending.<br />
Enforcing a more effective national co-ordination of training, monitoring and marketing services for<br />
microentrepreneurs.<br />
Access to alternative funding resources for the operation of the Local Microcredit Programs.<br />
Improving the efficiency and professional standards of the individual microfinance institutions up<br />
to a unified standard and homogeneous level.<br />
Developing further the JEREMIE Microcredit Program with a focus on entreprise promotion, taking<br />
into account the importance of counselling as well as financing programmes, and focusing on refinancing<br />
on specialized provi<strong>de</strong>rs rather than spreading financing through a multitu<strong>de</strong> of private<br />
financial operators, which are unable to reach microentrepreneurs and have little impact.<br />
Sources used: KSG, DG Employment, The Microlending sector in Hungary, Microlending to SMEs by Istvan Kovacs, and studies<br />
written by Tibor Szekfu.<br />
Authors: Istvan Kovacs, Hungarian <strong>Microfinance</strong> Network and Daniel Sorrosal, <strong>EMN</strong>.<br />
85
<strong>EMN</strong> <strong>2008</strong>-<strong>2009</strong> <strong>Overview</strong><br />
86<br />
Italy<br />
Macroeconomic data (Dec <strong>2009</strong>)<br />
Total popu<strong>la</strong>tion: 60.3 million (Oct. <strong>2009</strong>)<br />
Urban popu<strong>la</strong>tion: 68% (2007)<br />
GDP per capita: €26,250 (<strong>2008</strong>)<br />
Unemployment rate: 8.6%<br />
Popu<strong>la</strong>tion living in re<strong>la</strong>tive poverty: 13.6%; absolute poverty: 4.9% (<strong>2008</strong>)<br />
Popu<strong>la</strong>tion in a situation of financial exclusion: 16%<br />
% of microenterprises: 94.9% of total enterprises; 47.7% of employees (2006)<br />
Sources: istat.it; European Commission, March <strong>2008</strong>, “Financial Services Provision and Prevention of Financial Exclusion”.<br />
Legal framework for microfinance and policy initiatives<br />
There is a <strong>la</strong>ck of a specific microfinance <strong>la</strong>w, <strong>de</strong>spite an increasing awareness amongst domestic<br />
practitioners of the need of a proper legal framework. Loan provision is regu<strong>la</strong>ted un<strong>de</strong>r the<br />
mainstream bank legis<strong>la</strong>tion: according to the D. Lgs. 385/1993, financial intermediation is mainly<br />
reserved to banks. Non-banking financial institutions may grant loans and provi<strong>de</strong> payment services<br />
if registered un<strong>de</strong>r the article n. 106 with a minimum capital requirement of €600,000. Interest rates<br />
are limited by the <strong>la</strong>w n. 108, 7 march 1996. The Bank of Italy records the average actual interest<br />
rates applied in the market for several financial services so as to <strong>de</strong>termine which level represents<br />
usury. Interest rates cannot exceed the i<strong>de</strong>ntified value increased by the half, unless they would be<br />
consi<strong>de</strong>red usurer and sanctioned.<br />
Principal microfinance activity<br />
N° of survey participants: 32<br />
N° of active clients in Dec. <strong>2009</strong>: 2,146<br />
N° of loans disbursed <strong>2009</strong>: 1,909<br />
Value of loans disbursed <strong>2009</strong>: €10.9 million<br />
40% of female clients; 30% of immigrant/ethnic minority clients<br />
One of the main consequences of the legal framework is that the activity of microloan provision<br />
in Italy often involves more than one entity: with the exception of commercial banks and authorized<br />
non-bank financial institutions, most of the Italian microcredit projects involve three entities:<br />
1. a promoter or mediator: a public or private entity (often an NGO or a non-profit institution) that<br />
is rooted in the local context and often close to target groups, which is responsible for the selection<br />
process (collects information and documents from the potential client, conducts preliminary<br />
investigations, selects borrowers to be presented to the len<strong>de</strong>r, provi<strong>de</strong>s them with guarantees<br />
directly or through a third party) and provi<strong>de</strong>s non-financial services and/or business <strong>de</strong>velopment<br />
services. Promoters (or mediators) are i<strong>de</strong>ntified as MFIs in the data collection process, as you find<br />
in the Italian database;<br />
2. a len<strong>de</strong>r: commercial banks and authorized non-bank financial institutions;<br />
3. a guarantor: the promoter or a third subject (banking foundations, public agencies or Confidi) create<br />
a guarantee fund to secure the loan.
Principal challenges<br />
One must take into account the above-<strong>de</strong>scribed structure of the Italian mo<strong>de</strong>l of microloans provision<br />
in the analysis of the data collected through the survey questionnaire. Some changes are requested to the<br />
Italian database in or<strong>de</strong>r to avoid data over<strong>la</strong>pping and the resulting overestimation of loan portfolios. More<br />
precisely, Banca Etica (a commercial ethical bank) and PerMicro (non-bank financial institution) are two survey<br />
participants allowed to lend money. Part of the lending activity (n° of loans and corresponding amounts)<br />
<strong>de</strong>scribed by Banca Etica and PerMicro is managed on behalf of partner institutions (NGOs, associations,<br />
public agencies not allowed to grant loans by the <strong>la</strong>w) that are the actual promoter of the microcredit project.<br />
As such PerMicro manages the whole lending activity of MicroProgress as well as part of Micro.Bo’s lending.<br />
Banca Etica manages the lending of Caritas Diocesana Vicentina – Ass. Diakonia Onlus, Caritas Andria,<br />
Comune di Venezia, Caritas Diocesana di Andria, Fondazione La Casa and part of Progetto SMOAT.<br />
Adjustments to the Italian database<br />
Some adjustments to the Italian database were collected in the follow-up phase with some responding<br />
MFIs. Please take into account the following changes to data collected through the on-line database:<br />
Loans disbursed by Microprogress<br />
<strong>2008</strong>: 1 loan (value: €8,100);<br />
<strong>2009</strong>: 18 loans (value: €98,500) – out of these: 7 to women (€21,850) and 15 to immigrant/ethnic minority<br />
entrepreneurs (€82,150), 4 to young entrepreneurs (€44,500) and 4 to start-up enterprises (€27,500).<br />
Loans disbursed by Associazione micro.Bo Onlus:<br />
<strong>2008</strong>: 23 loans (value €115,649)<br />
<strong>2009</strong>: 6 loans (value of €43,193) - out of these: 3 to women (€25,000), 2 to immigrant/ethnic minority<br />
entrepreneurs (€10,000), 6 to young entrepreneurs (€43,193) and 6 to start-up enterprises (€43,193).<br />
Authors: Maria Cristina Negro, Fondazione Giordano Dell’Amore and Fabrizio Botti, microfinance expert.<br />
87
<strong>EMN</strong> <strong>2008</strong>-<strong>2009</strong> <strong>Overview</strong><br />
88<br />
Portugal<br />
Macroeconomic data (Dec <strong>2009</strong>)<br />
Total popu<strong>la</strong>tion: 10.7 million (July <strong>2009</strong> est.)<br />
Urban popu<strong>la</strong>tion: 59%<br />
GDP per capita: $21,800 or about €16,000 (<strong>2009</strong> est.)<br />
Unemployment rate: 9.2% (<strong>2009</strong> est.)<br />
Popu<strong>la</strong>tion below the poverty line: 18% (2006)<br />
Popu<strong>la</strong>tion in a situation of financial exclusion: 17%<br />
Sources: CIA World Factbook; Eurobarometer 60.2; Eurostat, News Release STAT/08/47, April <strong>2008</strong>.<br />
Legal framework for microfinance and policy initiatives<br />
The main binding legis<strong>la</strong>tion in Portugal is the Legal Framework of Credit Institutions and Financial<br />
Companies (Regime Geral das Instituições <strong>de</strong> Crédito e Socieda<strong>de</strong>s Financeiras). This <strong>la</strong>w regu<strong>la</strong>tes the activities<br />
of credit institutions and financial enterprises, which are the only two that are able to grant credit on a<br />
professional basis. Financial enterprises do not have bank status and are allowed to lend but not to<br />
borrow. The Institutions concerned are commercial banks, state-owned and savings banks. There is no<br />
specific legis<strong>la</strong>tion for microcredit or microfinance institutions. There is also a <strong>la</strong>ck of usury <strong>la</strong>ws as well<br />
as a <strong>la</strong>ck of regu<strong>la</strong>tions restricting the amount of interest an institution can charge.<br />
Principal microfinance activity<br />
N° of survey participants: 2<br />
N° of active clients in Dec. <strong>2009</strong>: 829<br />
N° of loans disbursed <strong>2009</strong>: 454<br />
Value of loans disbursed <strong>2009</strong>: €3.8 million<br />
47.7% of female clients; 7% of immigrant/ethnic minority clients<br />
Microcredit was introduced in Portugal in 1999 by the Associação Nacional <strong>de</strong> Direito ao Crédito<br />
(ANDC). This initiative was aimed at people exclu<strong>de</strong>d from the banking system, in particu<strong>la</strong>r those<br />
unemployed. ANDC hence searched for partners that would enable them to respond to financing<br />
needs. Presently, ANDC has signed protocols with three of the <strong>la</strong>rgest financial institutions in Portugal<br />
(Millenium bcp, Caixa Geral <strong>de</strong> Depósitos and Banco Espirito Santo). Another important partner is<br />
Instituto <strong>de</strong> Emprego e Formação Profissional (Institute for Employment and Vocational Training) that<br />
financially supports ANDC while also promoting employment. ANDC grants loans between €1,000 and<br />
€5,000 with convenient repayment schemes. It is also important to note that due to the necessity for<br />
microcredit in Portugal, Millenium bcp and Casa da Misericórdia <strong>de</strong> Lisboa created their own initiatives.<br />
Millennium bcp, the <strong>la</strong>rgest private financial institution in Portugal and partner of ANDC since 1999, has<br />
set up its autonomous network of microcredit in 2005. It is an exception for microcredit in Portugal as it<br />
is the only project that applies non-preferential interest rates.<br />
Portugal has seen a significant shift in social policies since 1996, with the introduction of the Minimum<br />
Guaranteed Income and also due to a change in allocation of EU funds. There is now increased support and<br />
more incentives focused on the creation of employment and microentreprises. Especially in the current<br />
economic context with unemployment rates of more than 10%, microcredit is seen as an instrument to<br />
promote employment.<br />
There are today a number of public entities that are working towards these goals. It is important to<br />
mention two in particu<strong>la</strong>r: Instituto <strong>de</strong> Emprego e Formação Profissional-IEFP (Institute for Employment
and Vocational Training) and Instituto <strong>de</strong> Apoio às Pequenas e Médias Empresas-IAPMEI (Institute to<br />
Support Small and Medium-sized Enterprises). IAPMEI has implemented instruments in or<strong>de</strong>r to help<br />
microentreprises, focussing on both microcredit and micro risk capital.<br />
In September <strong>2009</strong> the Government ma<strong>de</strong> an agreement with several banks in partnership with IEFP<br />
aiming to expand microcredit strongly (Microinvest). The goal is to create a National Programme of<br />
microcredit (PADRES), sponsored by the government in partnership with banks and private institutions<br />
and associations. In December <strong>2009</strong> the Portuguese government created new legis<strong>la</strong>tion that regu<strong>la</strong>tes<br />
microfinance institutions.<br />
Principal challenges<br />
There has been a slow but positive evolution of microfinance in Portugal, in particu<strong>la</strong>r in the <strong>la</strong>st <strong>de</strong>ca<strong>de</strong>.<br />
This is <strong>la</strong>rgely due to better awareness of the issue and its complexity with respect to the entities more directly<br />
involved, whether they are public or from civil society. In spite of the existing incentives and the progress of<br />
the <strong>la</strong>st years, there are still obstacles that remain in the path.<br />
Presently only banks are allowed to lend money in Portugal. Since the beginning ANDC <strong>de</strong>fen<strong>de</strong>d that<br />
it should be possible, in certain cases, to extend loans directly to the microentrepreneurs, as this is the<br />
case in France for example. To create the necessary conditions for the introduction of alterations to the<br />
Financial Institutions Regu<strong>la</strong>tion may, in the future and un<strong>de</strong>r specific conditions, allow the <strong>de</strong>velopment<br />
of ethical financial institutions, a <strong>de</strong>velopment that will bring financial, economic and social advantages<br />
to public administration. Since December <strong>2009</strong> specific regu<strong>la</strong>tion is un<strong>de</strong>r study and it will be presented<br />
and discussed during 2010. For bank microfinance provi<strong>de</strong>rs, efficiency and cost management as well as<br />
tight risk management are important challenges.<br />
Sources used: The Regu<strong>la</strong>tion of <strong>Microfinance</strong> in Europe (European Commission); <strong>Microfinance</strong> in Portugal: A Sparkling<br />
Activity, <strong>EMN</strong> Newsletter, July-Sept 2007; Manuel Brandao Alves, “Microcredit in Portugal”, in: Handbook Of Microcredit In<br />
Europe Social Inclusion through Microenterprise Development, 2010.<br />
Authors: Casey Conzett, Fundación Nantik Lum, Spain and Stefanie Lämmermann, <strong>EMN</strong>.<br />
89
<strong>EMN</strong> <strong>2008</strong>-<strong>2009</strong> <strong>Overview</strong><br />
90<br />
Romania<br />
Macroeconomic data (Dec <strong>2009</strong>)<br />
Total popu<strong>la</strong>tion: 21.6 million<br />
Urban popu<strong>la</strong>tion: 53.2%<br />
GDP per capita (<strong>2009</strong>): €10,300<br />
Unemployment rate: 7.8%<br />
Popu<strong>la</strong>tion below the poverty line:<br />
• Popu<strong>la</strong>tion below 1,25 UDS a day (extreme poverty):
Value of loans disbursed <strong>2009</strong>: €20.3 million (not including UNCAR)<br />
24 % female clients; % of immigrant/ethnic minority clients: ND<br />
The ten MFIs including the Credit Unions apex structure that took part in the survey, are registered as<br />
NBFIs and one of them, CAPA Finance, is in the process of transformation to a SME Bank: Patria Credit.<br />
Out of these, seven are mature MFIs: Patria Credit, Express Finance, Good bee Romania, Opportunity<br />
Microcredit Romania, FAER, ROMCOM and LAM with more than 10 years of operations, operationally<br />
sustainable and more social-oriented, serving un<strong>de</strong>rserved entrepreneurs located rural and peri-urban<br />
areas in. Moreover, two new MFIs with less than 5 years of operations participated: Aurora credit and<br />
Fair Credit House, registered since the enforcement of the new legal framework for non bank financial<br />
services, more commercial, serving mainly clients from urban and peri-urban areas.<br />
The Credit Unions apex structure UNCAR, with less than 10% of the portfolio re<strong>la</strong>ted to microcredits<br />
fun<strong>de</strong>d Aurora MFIs in or<strong>de</strong>r to increase the microfinance operation.<br />
Principal challenges<br />
In 2007, when the Romanian MF sector reached operational sustainability and Romania was<br />
admitted as a member of the EU, the initial donors and foun<strong>de</strong>rs withdrew from the MFIs, selling their<br />
shares or handing them over to the initial foundations, maintaining more a consultative position at the<br />
institution’s Board.<br />
The 700 million Euros estimated uncovered credit <strong>de</strong>mand of the microenterprise sector un<strong>de</strong>rserved<br />
by the formal financial sector is, within the current liquidity crisis, the biggest challenge of the Romanian<br />
microcredit sector.<br />
It is also a challenge that the innovative mo<strong>de</strong>ls <strong>de</strong>veloped by the mature MFIs prove to be sustainable<br />
and replicable at <strong>la</strong>rger scale in Romania as well as in the other Eastern and Central European countries.<br />
In the following period, overcoming the difficulties faced by the sector in implementing its <strong>de</strong>velopment<br />
strategies and vision, which are to serve the un<strong>de</strong>rserved entrepreneurs and contribute to the <strong>de</strong>velopment<br />
of the sustainable microenterprise and poverty alleviation, supporting the enhancement of the triple<br />
bottom line impact of the microcredit: financial, social and environmental, improvement of MIS/IT<br />
infrastructure and staff performance and a improvement of the funding mo<strong>de</strong>l to keep growing in an<br />
competitive market environment, is challenging the Romanian MF sector as well.<br />
Sources used: Eurom Consultancy and studies- Benchmarking Romanian MF Sector <strong>2008</strong>-<strong>2009</strong>; www.eurom-consultany.ro.<br />
Author: Maria Doiciu, Eurom Consultancy and Studies.<br />
91
<strong>EMN</strong> <strong>2008</strong>-<strong>2009</strong> <strong>Overview</strong><br />
92<br />
Spain<br />
Macroeconomic data (Dec <strong>2009</strong>)<br />
Total popu<strong>la</strong>tion: 46.7 million<br />
Urban popu<strong>la</strong>tion: 67.52%<br />
GDP per capita: €22,886<br />
Unemployment rate: 18.83%<br />
Popu<strong>la</strong>tion below the poverty line: 19.9%<br />
Popu<strong>la</strong>tion in a situation of financial exclusion: 8%<br />
% of microenterprises: 98.7%<br />
Sources: National Institute of Statistics (Instituto Nacional <strong>de</strong> Estadística), La Pob<strong>la</strong>ción <strong>de</strong> España 1900 – <strong>2009</strong> Fundación<br />
BBVA, Eurobarometer 60.2, INE-DIRCE <strong>2009</strong>, *2004 – INE Encuesta <strong>de</strong> Condiciones <strong>de</strong> Vida 2004.<br />
Legal framework for microfinance and policy initiatives<br />
Thus far, no specific regu<strong>la</strong>tory measures exist regarding microfinance and microcredit activity<br />
in Spain. There have been, however, wi<strong>de</strong>spread requests from social and financial institutions<br />
<strong>de</strong>manding a more well-established legal framework to accompany the increase in microcredit<br />
activity. At the national level, a usury <strong>la</strong>w simi<strong>la</strong>r to that of other European countries exists that<br />
effects microcredit operations by regu<strong>la</strong>ting interest rates. The usury <strong>la</strong>w dates back to 1908 (Ley <strong>de</strong><br />
represión <strong>de</strong> <strong>la</strong> usura, 2 <strong>de</strong> Julio <strong>de</strong> 1908). In general terms, this <strong>la</strong>w establishes that those loan contracts<br />
with an interest rate much higher than the market rate and disproportionate to the circumstances<br />
will not be valid, including in those cases where the interest rate has been accepted by the borrowers<br />
due to a strenuous situation, his/her inexperience or limited mental faculties (Bank of Spain, <strong>2009</strong>a).<br />
At the regional level so far, it appears that only the Autonomous Community of Murcia has inclu<strong>de</strong>d<br />
specific mention of microcredit in its legis<strong>la</strong>ture. In October 2003, Murcia enacted Decree 166/2003<br />
in an attempt to further regu<strong>la</strong>te the Social Work of its savings banks. The <strong>de</strong>cree established the<br />
granting of microcredit as a priority <strong>de</strong>velopment area for Murcia’s savings banks.<br />
Principal microfinance activity<br />
N° of survey participants: 20<br />
N° of active clients in Dec. <strong>2009</strong>: 9,786<br />
N° of loans disbursed <strong>2009</strong>: 5,172<br />
Value of loans disbursed <strong>2009</strong>: €46.6 million<br />
40% of female clients; 45% of immigrant/ethnic minority clients<br />
Most microfinance institutions began lending between the years 2005 and <strong>2009</strong>. The primary focus<br />
of institutions is on social inclusion and the reduction of poverty as well as job creation (81%). 50% of<br />
respon<strong>de</strong>nts in Spain are listed as non-profit organizations. The target client profile that most institutions<br />
sought were immigrants and/or ethnic minorities, but also targeted those financially exclu<strong>de</strong>d from the<br />
system and women. In Spain, there is a limited offering of products and services which are primarily<br />
focused on lending to start or expand businesses. Loans for consumption, savings, insurance and the like<br />
have yet to catch on. The average effective interest rate charged to clients is 8.6% and a grand majority do<br />
not charge additional fees over and above this rate. Individual loans are the most common methodology<br />
with 88% of the loan portfolio based on individual lending for all responding institutions. Even though<br />
Spain has been severely affected by the economic crisis, the number of loans given rose from 7,386 in <strong>2008</strong><br />
to 11,984 loans in <strong>2009</strong>, counting for an increase of over 4,500 loans. However, the average loan amount
<strong>de</strong>creased by almost a third – in <strong>2008</strong> the average loan size amounted for €9,504 and in <strong>2009</strong> that number<br />
fell to €3,976, perhaps representing the clients capacity and the subsequent effects of the economy on<br />
their borrowing capacity. The number of active clients also rose from 7,892 clients in <strong>2008</strong> to 9,786 in <strong>2009</strong>,<br />
representing an increase of about 19% in one year. 8 in 10 Spanish microfinance institutions have been<br />
impacted by the recent economic crisis, with the greatest effects being felt in the <strong>la</strong>te or <strong>de</strong>fault payment<br />
by the clients and the <strong>de</strong>creasing number of loans being approved. When asked about the most important<br />
future goals for Spanish institutions, 85% listed financial sustainability.<br />
Principal challenges<br />
Coordination, Networking and Training: institutions need to coordinate to increase efficiency and<br />
efficacy as well as to avoid duplicity, such as the organisation of workshops to discuss any issues, for<br />
example, an agreement on a singu<strong>la</strong>r <strong>de</strong>finition for what will be consi<strong>de</strong>red “microcredit” in the Spanish<br />
context. Another challenge is the training and professionalization of employees and loan officers.<br />
Financing: microfinance in rich countries is not financially sustainable, therefore attracting external funds<br />
in the form of grants and financiers willing to back mechanisms for reducing risk is indispensable.<br />
Social Impact and Performance Measurement: a common methodology needs to be <strong>de</strong>veloped that<br />
establishes indicators, tracking and reporting methodologies, as in a European Mix Market system.<br />
Sources used: Evaluación <strong>de</strong> <strong>la</strong>s necesida<strong>de</strong>s <strong>de</strong> fortalecimiento institucional <strong>de</strong> <strong>la</strong>s Instituciones Microfinancieras Españo<strong>la</strong>s by<br />
Bárbara Jayo and Alex Stein (pending publication).<br />
Author: Casey Conzett, Fundación Nantik Lum, Spain.<br />
93
<strong>EMN</strong> <strong>2008</strong>-<strong>2009</strong> <strong>Overview</strong><br />
94<br />
Swe<strong>de</strong>n<br />
Macroeconomic data (Dec <strong>2009</strong>)<br />
Total popu<strong>la</strong>tion: 9.3 million<br />
Urban popu<strong>la</strong>tion: 47%<br />
GDP per capita: €33,480<br />
Unemployment rate: 9%<br />
Popu<strong>la</strong>tion below the poverty line: 9.1% 2010 45<br />
Popu<strong>la</strong>tion in a situation of financial exclusion: 2%<br />
% of microenterprises: 95% (As <strong>de</strong>fined by Swedish standards, to qualify as a microenterprise the<br />
enterprise should have a total of 10 or less employees).<br />
Sources: Statistics Swe<strong>de</strong>n, Unit for Popu<strong>la</strong>tion Statistics; Swedish Tax Authorities (Skatteverket); Social Styrelsen http://<br />
www.socialstyrelsen.se/publikationer2010/2010-3-11; <strong>EMN</strong> http://www.european-microfinance.org/niveauxexclusions_en.php;<br />
Enterprise Association (Företagar Förbun<strong>de</strong>t) http://www.foretagarforbun<strong>de</strong>t.se; Newsletter 2, February <strong>2009</strong> from Ministry of<br />
Enterprise, Energy and Communications.<br />
Legal framework for microfinance and policy initiatives<br />
There is no established legal framework for microfinance. However, the organization MFI is currently<br />
in policy dialog with government concerning legal framework for microfinance.<br />
Principal microfinance activity<br />
N° of survey participants: 4<br />
N° of loans disbursed <strong>2009</strong>: 864<br />
Value of loans disbursed <strong>2009</strong>: €18.8 million<br />
42% of female clients; 30 of % immigrant/ethnic minority clients<br />
In <strong>2009</strong>, Swe<strong>de</strong>n not only topped the economic ranking with a GDP per capita of €33,480, but also<br />
ranked high in the social c<strong>la</strong>ssification with a HDI (human <strong>de</strong>velopment in<strong>de</strong>x) that allowed it to be<br />
in 7th position worldwi<strong>de</strong>. However, in this country with strong social values, certain individuals are<br />
exclu<strong>de</strong>d from access to formal financial services because they do not belong to the client groups targeted<br />
by financial institutions. The people exclu<strong>de</strong>d are found mainly among migrants and those wishing to<br />
start their own businesses. There is, therefore, a strong <strong>de</strong>mand for microfinance in Swe<strong>de</strong>n.<br />
There are several socially-oriented financial institutions: the network of savings banks, the JAK<br />
(cooperative bank), ALMI Företagspartner (public support agency for very small businesses and SMEs)<br />
and Ekobanken (ethical bank).<br />
However some individuals, especially the most vulnerable, are unable to find services tailored<br />
to their situation with existing financial institutions. This is the reason that some NGOs providing<br />
assistance and support services to exclu<strong>de</strong>d people have <strong>de</strong>ci<strong>de</strong>d in addition to provi<strong>de</strong> microfinance<br />
services to meet the growing <strong>de</strong>mand. Among these organizations there is NEEM (for women from<br />
ethnic minorities) and Basta Workers’ Cooperative (for the poorest and most vulnerable people<br />
such as ex-prisoners). Through a project created by NEEM (Network of Entrepreneurs from Ethnic<br />
Minorities), microfinance is now offered to immigrant women who are financially exclu<strong>de</strong>d from the<br />
banking sector.<br />
The project Micro Finance Institute (MFI), is the only organization in Swe<strong>de</strong>n that offer the entire<br />
spectrum of micro finance such as, business p<strong>la</strong>nning, business <strong>de</strong>velopment, financial advice, and
a three year follow-up. Most of existing financial services are offered to the target group to make<br />
them productive members of society. Loans are not given out by MFI due to structural and financial<br />
restraints. Instead private banks provi<strong>de</strong> the loans as MFI is signed up as the guarantor for the loan.<br />
Up to Dec <strong>2009</strong>, about 3 enterprises had been set up successfully with the services provi<strong>de</strong>d by MFI.<br />
Principal challenges<br />
The biggest challenges microfinance is facing in Swe<strong>de</strong>n are structural and funding challenges. Since<br />
there is no established microfinance company yet, the Swedish banking structure have not yet adapted<br />
to the requests of MFI. However, a big <strong>de</strong>mand exists and from the successful pilot project run by NEEM,<br />
policy dialog have been initiated and funding sources are being sought out. One principal challenge, the<br />
maximum amount of microloans that can be given has been re<strong>la</strong>xed in one MFI. ALMI has raised the<br />
ceiling for microloans from 10,000 Euro to 25,000 Euro in <strong>2009</strong>, so microentreprenuers can have access to<br />
greater capital.<br />
Author: Joyce Kimwaga Lundin, NEEM.<br />
45 To find oneself living in poverty in Swe<strong>de</strong>n, one has to have an income less than 60% of the average income level. It should be noted that unlike<br />
the OECD, which has set a European poverty level of 50%, the Swedish Social Ministry has set a 60% standard. Total rate of the popu<strong>la</strong>tion<br />
who live in poverty are 9.1%. Swe<strong>de</strong>n has categorized poverty into three groups with the poorest first: (1) Very poor – 25% less than the average<br />
poverty level, (2) Poor – average poverty level, (3) Limited income – 25% above average poverty level. The first group, very poor, consists of<br />
1.9% of the total Swedish popu<strong>la</strong>tion. Second group, poor, consists of 5.5% of the total popu<strong>la</strong>tion. Third, the limited income group inclu<strong>de</strong>s<br />
14.1% of total popu<strong>la</strong>tion.<br />
95
<strong>EMN</strong> <strong>2008</strong>-<strong>2009</strong> <strong>Overview</strong><br />
96<br />
The Nether<strong>la</strong>nds<br />
Macroeconomic data (Dec <strong>2009</strong>)<br />
Total popu<strong>la</strong>tion: 16,72 million<br />
Urban popu<strong>la</strong>tion: 49%<br />
GDP per capita: €29,200<br />
Unemployment rate: 5%<br />
Popu<strong>la</strong>tion below the poverty line: 10.5%<br />
Popu<strong>la</strong>tion in a situation of financial exclusion: 1%<br />
% of microenterprises: 38% - A microenterprise is <strong>de</strong>fined as an enterprise with less than 10 employees<br />
and a turnover or yearly ba<strong>la</strong>nce sheet of un<strong>de</strong>r €2 million.<br />
Sources: Worldfacts Book (https://www.cia.gov/library/publications/the-world-factbook/in<strong>de</strong>x.html) and (http://europa.eu/<br />
legis<strong>la</strong>tion_summaries/enterprise/business_environment/n26026_nl.htm)<br />
Legal framework for microfinance and policy initiatives<br />
There is no special legal framework for MFIs in the Nether<strong>la</strong>nds. Institutions legally registered (either<br />
foundations or private limited) are allowed to extend (micro-) loans as long as they do not offer savings<br />
facilities. There exist only limitations (interest caps) for consumer loans; interest rates for loans for economic<br />
purpose are not regu<strong>la</strong>ted by the Central Bank of the Nether<strong>la</strong>nds and the Financial Market Support<br />
Authority. In the Nether<strong>la</strong>nds, most MFIs offer their services at market rates (or with a small increase of 2<br />
to 4%). Recipients of loans un<strong>de</strong>r the social security programme have access to lending at a lower rate (4%<br />
below market rates).<br />
Principal microfinance activity<br />
N° of survey participants: 4;<br />
N° of active clients in Dec. <strong>2009</strong>: 850<br />
N° of loans disbursed <strong>2009</strong>: 572<br />
Value of loans disbursed <strong>2009</strong>: €11.7 million<br />
32% of female clients; 18% of immigrant/ethnic minority clients<br />
In <strong>2009</strong> a total of 44 organisations exten<strong>de</strong>d 1,107 microloans. The two private NBFIs - Qredits and<br />
HandsOn - provi<strong>de</strong>d 555 microloans 38 . The 13 NGOs and municipal programmes with special target<br />
group focused microcredit programmes gave 333 loans in <strong>2009</strong>. The national public programme extending<br />
comprehensive services (BDS and loans) provi<strong>de</strong>d 52 loans 39 and the pilot scheme with banks 129 loans 40 .<br />
Five municipal banks with microcredit programmes gave 43 loans 41 . No general bank had an explicit<br />
microfinance programme in <strong>2009</strong>, but six banks had “hid<strong>de</strong>n/ undisclosed” microlending activity 42 .<br />
Finally, there are twelve credit provi<strong>de</strong>rs on the internet 43 .<br />
Principal challenges<br />
The sector has <strong>de</strong>veloped dramatically in the past two years. In 2007, about 12 organisations reported<br />
to be active in microfinance 44 but none of these organisations had a portfolio of more than 20 clients<br />
per annum. The situation in <strong>2009</strong> tells us that the number of clients has increased significantly mainly<br />
attributable to one new NBFI; Qredits. This organisation started disbursing loans in <strong>2009</strong> and has shaken<br />
up the sector consi<strong>de</strong>rably.
There are some major changes taking p<strong>la</strong>ce in the Dutch society and in the <strong>la</strong>bour market:<br />
1. Society is becoming more diverse ;<br />
2. Lifelong employment and lifelong entrepreneurship are fading away;<br />
3. More people want to become active citizens and do not accept to remain socially exclu<strong>de</strong>d.<br />
Thus, new target groups for microcredit and microfinance emerge:<br />
The socially exclu<strong>de</strong>d look for ways to combine the social benefits with income generating<br />
activities;<br />
The young professionals look at self-employment not as a career, but as a temporary activity;<br />
The housewives and househusbands – even or maybe just those who have not been registered<br />
as “unemployed” – look for ways to initiate small economic activities that would allow them to<br />
generate additional income, albeit on a small scale;<br />
The part-time employed will look for ways to generate additional income through part-time selfemployment<br />
and small economic activities.<br />
Sources used: <strong>Microfinance</strong> and enterprising people…different markets with specific approaches..., K<strong>la</strong>as Molenaar Professor in <strong>Microfinance</strong><br />
and Small Enterprise Development INHol<strong>la</strong>nd University of Applied Sciences The Nether<strong>la</strong>nds, 2010 (forthcoming – sec, ed.).<br />
Author: André Wou<strong>de</strong>nberg, Centrum voor Micro Finance & Small Business, INHol<strong>la</strong>nd Den Haag.<br />
38 Including 530 loans of one NBFI- Stichting Microkrediet Ne<strong>de</strong>r<strong>la</strong>nd , operating with tra<strong>de</strong> name Qredits<br />
39 Source: Ministry of Social Affairs and Employment - 2010<br />
40 Source: Ministry of Social Affairs and Employment - 2010<br />
41 Source: Central Bureau of Statistics, 2010<br />
42 See also Triodos Facet (2005) – general banks not explicitly reporting on <strong>Microfinance</strong> but important p<strong>la</strong>yer (personal loans, overdrafts, current<br />
account, mortgage loans)<br />
43 Only two specialising in micro finance products; others mainly offering consumer loans<br />
44 Estimates of Senter Novem, corrected by the Centrum voor Microfinanciering INHol<strong>la</strong>nd – Sept 2007 / <strong>2009</strong><br />
97
<strong>EMN</strong> <strong>2008</strong>-<strong>2009</strong> <strong>Overview</strong><br />
98<br />
United Kingdom<br />
Macroeconomic data (Dec <strong>2009</strong>)<br />
Total popu<strong>la</strong>tion: 61.4 million<br />
Urban popu<strong>la</strong>tion: 90%<br />
GDP per capita: 23,900 euros<br />
Unemployment rate: 7.8%<br />
Popu<strong>la</strong>tion below the poverty line: 19%<br />
Popu<strong>la</strong>tion in a situation of financial exclusion: 6%<br />
% of microenterprises - less than 10 employees: 97%<br />
Sources: Office for National Statistics, UK Popu<strong>la</strong>tion Estimates (popu<strong>la</strong>tion figures <strong>2008</strong>); <strong>EMN</strong> Country Information (urban<br />
popu<strong>la</strong>tion; GDP per capita) ONS Labour Market Bulletin, February 2010 (Unemployment); Poverty line: Eurostat, At-Risk-<br />
Of Poverty rate after social transfers, February 2010 (data for <strong>2008</strong>); Popu<strong>la</strong>tion in situation of financial exclusion and GDP<br />
per capita from <strong>EMN</strong> country website; Office of National Statistics: UK Business: Activity, Size and Location <strong>2009</strong> / own<br />
calcu<strong>la</strong>tion (% of enterprises).<br />
Legal framework for microfinance and policy initiatives<br />
There is no specific legis<strong>la</strong>tion for microfinance; community <strong>de</strong>velopment finance institutions<br />
(CDFIs) cannot take <strong>de</strong>posits. To <strong>de</strong>liver personal loans, they (and other organisations, e.g. Credit<br />
Unions) need to hold need a consumer credit license from the Office of Fair Trading. Deposit taking<br />
institutions such as Credit Unions or banks have stricter regu<strong>la</strong>tions, but these do not re<strong>la</strong>te to<br />
microfinance, but to <strong>de</strong>posit-taking. Credit Unions represent a very small proportion of personal<br />
lending in the UK, and, with a few notable exceptions such as ScotCash (a registered CDFI), they are<br />
run by volunteers.<br />
There is no interest rate ceiling in the UK; social len<strong>de</strong>rs have an average APR of 11.9 % for<br />
business loans and 27% for personal loans. This is much below the level (up to 2000% APR) charged<br />
by sub-prime len<strong>de</strong>rs. A floating interest rate ceiling is un<strong>de</strong>r discussion, but is unlikely to be<br />
introduced before the next general election in May. This would be set at a level unlikely to affect<br />
affordable len<strong>de</strong>rs.<br />
In the past, the government has supported both business and personal lending from CDFIs<br />
(exceeding the microfinance threshold of €25,000) with operational and capital funds. The current<br />
programme called the Growth Fund targets personal len<strong>de</strong>rs. Between <strong>2008</strong> and 2011, £32m will be<br />
ma<strong>de</strong> avai<strong>la</strong>ble to third sector len<strong>de</strong>rs (CDFIs and credit unions). Enterprise lending CDFIs have not<br />
benefited from additional support since the economic crisis. The Small Firms Loan guarantee scheme<br />
was reformed to the Enterprise Finance Scheme to inclu<strong>de</strong> loans of £1000, but the reforms, however,<br />
have resulted in reduced guarantee coverage, and from anecdotal evi<strong>de</strong>nce, the conditions are not<br />
helpful to CDFIs.<br />
Principal microfinance activity<br />
N° of survey participants: 22<br />
N° of active clients: 3,102<br />
N° of loans disbursed: 880<br />
Value of loans disbursed <strong>2009</strong>: €6.7 million<br />
26% of female clients; 6% of immigrant/ethnic minority clients
<strong>Microfinance</strong> in the UK is <strong>de</strong>livered by Community Development Finance Institutions (CDFIs) which<br />
were set up on the mid-<strong>la</strong>te 1980s to counteract capital flight from <strong>de</strong>prived areas. They initially were<br />
<strong>de</strong>signed to give loans to existing or start-up local enterprises whose loan applications were rejected<br />
by banks but had a viable business proposition. From the beginning, loans excee<strong>de</strong>d the microfinance<br />
threshold of €25,000; the average loan size for all CDFI lending is €45,298 (All CDFIs reporting to the<br />
cdfa). As a consequence of this <strong>de</strong>velopment, there is only a very small <strong>de</strong>dicated microfinance sector, and<br />
the distinction is mostly based on employment figures rather than loan sizes. Most organisations provi<strong>de</strong><br />
loans to companies of all sizes and loans of up to £150,000 (€163,500).<br />
Exceptions to this are the <strong>EMN</strong> members Business Finance Solutions, Fair Finance, First Enterprise<br />
Business Agency, Foundation East, the PSYBT and WEETU. They use microfinance methodology and<br />
terminology. Of the six, PSYBT is the <strong>la</strong>rgest. In <strong>2009</strong>, the loaned just over €2m in business loans to young<br />
people who cannot access loans from banks. Since they started lending in 1989, they’ve ma<strong>de</strong> 9.097 loans<br />
with a value of 34m. Their maximum loan size is €5,550, and the minimum loan size 550. Their average<br />
loan is €3,582.<br />
The next <strong>la</strong>rgest provi<strong>de</strong>rs are First Enterprise Business Agency and Business Finance Solutions with<br />
157 and 127 active clients and average loan amounts of €14,231 and €19,423 respectively. Moreover, in<br />
London, Fair Finance has served 155 clients since 2005 to date, providing loans with a value of €634,642.<br />
It serves currently 82 clients, of which ca 20 are business clients and 62 are personal loan clients. They<br />
have no specific target popu<strong>la</strong>tion, but due to their area of operation, they attract a high share of ethnic<br />
minorities (79%). They lend a maximum of £10,000 (€12,000) in their business lending programme<br />
and a maximum of £2000 (€2,400) for personal loans. In <strong>2009</strong>, they disbursed 38 loans with a value of<br />
€138,750.<br />
Principal challenges<br />
Organisations responding to the survey overwhelmingly stated that <strong>la</strong>ck of funds for lending (13) and<br />
<strong>la</strong>ck of an appropriate regu<strong>la</strong>tory and legal framework (8) were the principal challenges for the future.<br />
This reflects the <strong>la</strong>ck of recognition of especially microlen<strong>de</strong>rs in the UK as a separate market strand with<br />
its own particu<strong>la</strong>r challenges.<br />
Sources used: CDFA Insi<strong>de</strong> Out <strong>2009</strong>; <strong>EMN</strong> additional questions UK survey; <strong>EMN</strong> Full survey; UK personal Len<strong>de</strong>rs Survey.<br />
Author: Veronika Thiel, Centre for Responsible Credit.<br />
99
<strong>EMN</strong> <strong>2008</strong>-<strong>2009</strong> <strong>Overview</strong><br />
100<br />
15 Summary of data<br />
Sector Characteristics<br />
Countries<br />
Average loan size Number of loans Active clients45 <strong>2008</strong> <strong>2009</strong> <strong>2008</strong> <strong>2009</strong> <strong>2008</strong> <strong>2009</strong><br />
Belgium 16.118€ 17.029€ 844 835 2.982 3.491<br />
Bulgaria 7.926€ 6.298€ 5.040 2.637 6.012 3.248<br />
Croatia 4.907€ 6.250€ 996 160 1.987 508<br />
Fin<strong>la</strong>nd 19.674€ 19.058€ 2.709 3.194 19.400 19.600<br />
France 6.296€ 4.959€ 26.709 28.863 22.797 70.252<br />
Germany 10.782€ 10.214€ 7.700 8.205 1.963 2.513<br />
Hungary 13.826€ 16.138€ 6.990 10.402 2.046 2.589<br />
Ire<strong>la</strong>nd 13.750€ 14.545€ 80 55 175 151<br />
Italy 5.367€ 5.875€ 1.364 1.909 1.389 2.146<br />
Latvia 1.375€ 2.658€ 60 149 60 63<br />
Nether<strong>la</strong>nds 4.000€ 14.745€ 16 572 13 541<br />
Norway 7.963€ 3.645€ 43 6 - -<br />
Po<strong>la</strong>nd 3.811€ 3.318€ 17.760 16.655 1.422 1.769<br />
Portugal 8.018€ 7.811€ 351 454 467 829<br />
Romania 8.702€ 6.837€ 11.265 3.493 19.978 15.163<br />
Spain 9.587€ 8.279€ 7.132 5.172 7.892 9.786<br />
Swe<strong>de</strong>n 16.667€ 13.949€ 913 864 1 8<br />
Switzer<strong>la</strong>nd 13.875€ 11.944€ 16 18 30 56<br />
United Kingdom 5.440€ 9.623€ 617 880 1.766 3.102<br />
Institutional types Loan Size by Institutional Type<br />
Bank 5% 11.070€<br />
CDFI 11% 11.379€<br />
Credit Union/ cooperative 8% 8.054€<br />
Government body 5% 15.852€<br />
NGo or foundation 26% 10.948€<br />
Non-bank Financial Institution 16% 8.340€<br />
other 23% 6.456€<br />
Savings Bank 6% 9.144€<br />
45 It should be noted that there are some organisations that have respon<strong>de</strong>d to number of loans disbursed but not the number of active<br />
borrowers. This is the case for Germany (big provi<strong>de</strong>r), Hungary (big provi<strong>de</strong>r), Latvia, Norway, Spain and Swe<strong>de</strong>n. There are also organisations<br />
that have respon<strong>de</strong>d more number of loans disbursed than number of active borrowers (e.g. in the Nether<strong>la</strong>nds). In the case of Po<strong>la</strong>nd the<br />
difference is due to the fact that in number of loans disbursed Fundusz Micro is inclu<strong>de</strong>d but not in number of active clients.
Clients<br />
Number of staff members<br />
0 to 5 64%<br />
6 to 10 14%<br />
11 to 20 7%<br />
over 20 15%<br />
Bankable 68.3%<br />
Non-bankable 40.3%<br />
Type of business supported<br />
Informal sector/unregistered businesses 24%<br />
Entrepreneurs in the pre-start-up phase for feasibility studies, etc. 32%<br />
Start-up enterprises 78%<br />
Existing enterprises 62%<br />
Registered businesses with less than 5 employees 55%<br />
Registered businesses with 5-9 employees 45%<br />
other 15%<br />
Clients specific targeting<br />
Rural popu<strong>la</strong>tion 32%<br />
Urban popu<strong>la</strong>tion 38%<br />
Unemployed people or people on welfare 32%<br />
Women 44%<br />
Ethnic minorities and/or immigrants 41%<br />
youth 29%<br />
Disabled people 21%<br />
People exclu<strong>de</strong>d from mainstream financial services 47%<br />
No client-specific targeting 30%<br />
other %<br />
Client targeting of the institutions by country<br />
Women Ethnic minorities<br />
and / or immigrants<br />
youth<br />
Belgium 25% 0% 25%<br />
Bulgaria 56% 56% 38%<br />
Croatia 100% 100% 0%<br />
Estonia 100% 0% 0%<br />
Fin<strong>la</strong>nd 100% 0% 0%<br />
France 33% 50% 50%<br />
Germany 31% 25% 0%<br />
Hungary 10% 0% 10%<br />
Italy 27% 33% 18%<br />
Latvia 50% 0% 50%<br />
Nether<strong>la</strong>nds 50% 50% 50%<br />
Norway 50% 50% 50%<br />
Portugal 50% 100% 50%<br />
Romania 33% 22% 0%<br />
Spain 80% 90% 60%<br />
Swe<strong>de</strong>n 75% 100% 75%<br />
Switzer<strong>la</strong>nd 100% 100% 100%<br />
United Kingdom 68% 50% 45%<br />
101
<strong>EMN</strong> <strong>2008</strong>-<strong>2009</strong> <strong>Overview</strong><br />
102<br />
Products and services<br />
% microloans<br />
for entrepreneurial activity<br />
less than 5% 7,5%<br />
5-25% 9,9%<br />
25-50% 7,5%<br />
50-75% 6,2%<br />
more than 75% 68,9%<br />
Interest rate<br />
Belgium 4,7%<br />
Bulgaria 14,3%<br />
Croatia 11,0%<br />
Estonia 7,0%<br />
Fin<strong>la</strong>nd 2,0%<br />
France 4,8%<br />
Germany 4,5%<br />
Hungary 7,8%<br />
Ire<strong>la</strong>nd 9,0%<br />
Italy 3,7%<br />
Latvia 6,0%<br />
Lithuania 4,0%<br />
Nether<strong>la</strong>nds 8,3%<br />
Norway 6,0%<br />
Po<strong>la</strong>nd 17,0%<br />
Portugal 3,0%<br />
Romania 16,9%<br />
Spain 8,6%<br />
Swe<strong>de</strong>n 6,7%<br />
Switzer<strong>la</strong>nd 4,0%<br />
United Kingdom 22,2%<br />
Social Performance<br />
Average loan size<br />
and mission statement<br />
Social inclusion<br />
and poverty reduction<br />
8.031€<br />
Microentreprise promotion 9.620€<br />
Job creation 10.334€<br />
Financial inclusion 11.732€<br />
SME promotion 13.021€<br />
Fees charged by microlen<strong>de</strong>rs<br />
BDS fees 1%<br />
Loan application fee 15%<br />
Loan closing fee 9%<br />
Loan processing fee 23%<br />
other 18%<br />
Loan security<br />
Personal Savings 12%<br />
Borrower contribution 13%<br />
Peer Group Guarantee 25%<br />
Guarantee 23%<br />
Friend or Family 41%<br />
Col<strong>la</strong>teral 49%<br />
Bank / public /<br />
EU Guarantee Programme<br />
52%<br />
No guarantee 59%<br />
Business <strong>de</strong>velopment services<br />
yes, it is obligatory 20%<br />
yes, but only if a client 14%<br />
asks for it<br />
yes, in some cases<br />
20%<br />
we require it, in others not<br />
No, but we refer clients 27%<br />
to organisations that do<br />
No 19%
operational Performance<br />
Operational self-sufficiency<br />
less than 60% 20%<br />
60% to 100% 20%<br />
over 100% 60%<br />
Repayment rate<br />
Less than 80% 37%<br />
81% to 90% 27%<br />
91% to 100% 37%<br />
Portfolio at risk rate<br />
0% to 5% 23%<br />
6% to 15% 39%<br />
16% to 25% 21%<br />
over 25% 18%<br />
Write-off ratio<br />
0% to 5% 69%<br />
6% to 10% 14%<br />
over 10% 17%<br />
Funding<br />
Sources operational<br />
and Financial Costs<br />
Public Sector 34%<br />
Private Sector 42%<br />
Earned Income 60%<br />
Debt / equity ratio<br />
0% to 2% 29%<br />
3% to 10% 29%<br />
11% to 80% 22%<br />
81% to 100% 11%<br />
101% to 200% 2%<br />
over 200% 7%<br />
Portfolio yield<br />
0% to 5% 53%<br />
6% to 15% 23%<br />
16% to 25% 14%<br />
over 25% 9%<br />
operating expenses ratio<br />
0% to 5% 39%<br />
6% to 15% 28%<br />
16% to 40% 24%<br />
over 40% 9%<br />
Sources of Loan Capital<br />
Public Sector 50%<br />
Private Sector 36%<br />
Commercial Debt 19%<br />
own Funds 44%<br />
Client <strong>de</strong>posits 24%<br />
103
<strong>EMN</strong> <strong>2008</strong>-<strong>2009</strong> <strong>Overview</strong><br />
104<br />
16 Bibliography<br />
ABADJIEVA, Lilia (<strong>2008</strong>): Poverty and Social Exclusion in Rural Areas, Annex I, Country<br />
Studies, Bulgaria. Commission by the European Commission’s Directorate General (DG) for<br />
Employment, Social Affairs and Equal Opportunities.<br />
CARTWRIGHT, Peter (2004): “Banks, Consumers and Regu<strong>la</strong>tion”, quoted in Howell:<br />
Financial Exclusion and <strong>Microfinance</strong>: An <strong>Overview</strong> of Issues, Australia.<br />
COPESTAKE, J., GREELEY, M., JOHNSON, S., KABEER, N., and SIMANOWITZ, A. (2005):<br />
Money with a Mission: <strong>Microfinance</strong> and Poverty Reduction, Volume 1, ITDG Publishing.<br />
COPISAROW, Rosalind (2004): Street UK- a <strong>Microfinance</strong> Organisation, Lessons Learned from<br />
its First Three Years’ Operations, Street UK Foundation, Birmingham.<br />
DALEY-HARRIS, Sam (<strong>2009</strong>): State of the Microcredit Summit Campaign Report <strong>2009</strong>,<br />
Microcredit Summit Campaign, Washington D.C. pp. 27.<br />
<strong>EMN</strong> (<strong>2008</strong>): <strong>Overview</strong> of the Microcredit Sector in Europe 2006-2007, by Bárbara Jayo, Silvia<br />
Rico and Maricruz Lacalle, Working Paper Number 5, Paris.<br />
_____ (2006): <strong>Overview</strong> of the Microcredit Sector in Europe 2004-2005, by Tamara Un<strong>de</strong>rwood,<br />
Working Paper Number 4, Paris.<br />
_____ (2006a): Women and Microlending in Western Europe, by Tamara Un<strong>de</strong>rwood, Paris.<br />
_____ (2006b): Immigrant Participation in Microloan Programmes in Western Europe, by Miriam<br />
Guzy and Tamara Un<strong>de</strong>rwood, <strong>EMN</strong> Working Paper Number 3, Paris.<br />
EUROPEAN COMMISION (<strong>2009</strong>): Eurobarometer Survey on Poverty and Social<br />
Exclusion, Eurobarometer, Commissioned by the European Commission’s<br />
Directorate General (DG) for Employment, Social Affairs and Equal Opportunities.<br />
See http://www.2010againstpoverty.eu/extranet/Eurobarometre_150DPI_091113.pdf (Last<br />
accessed 06 May 2010).<br />
_________ (2007): Discrimination in the European Union, Eurobarometer, Directorate-General<br />
Employment, Social Affairs and Equal Opportunities and coordinated by the Directorate-<br />
General Communication. See http://equality2007.europa.eu.<br />
________ (2007a): Expert Group Report: The Regu<strong>la</strong>tion of Microcredit in Europe, Enterprise<br />
Industry, Brussels.
____ (2004): Joint Report on Social Inclusion 2004, European Commission Directorate for<br />
Employment and Social Affairs, Brussels.<br />
____ (2004a): Microcredit for Small Businesses and Business Creation: Bridging a Market Gap,<br />
European Union, DG Enterprise, Brussels.<br />
EUROPEAN UNION (2007): European Year of Equal Opportunities for All, 2007,<br />
see http://equality2007.europa.eu.<br />
EUROSTAT (<strong>2009</strong>): Popu<strong>la</strong>tion of foreign citizens in the EU27 in <strong>2008</strong>, STAT09/184.<br />
_____ (2007): Europe in Figures: Eurostat Year Book, 2007.<br />
FACER, EVERS&JUNG, NEF, (2005): Policy measures to promote the use of microcredit for social<br />
inclusion, Nether<strong>la</strong>nds.<br />
GREENE F. (2005): Youth Entrepreneurship: Latent Entrepreneurship, Market Failure and<br />
Enterprise Support, National Council for Graduate Entrepreneurship, Policy Paper 2, UK.<br />
MCDOWELL, Malcolm (2006): Microcredit in Europe: The Experience of Savings Banks,<br />
European Savings Bank Group.<br />
MICROFINANCE CENTER, EUROPEAN MICROFINANCE NETWORK, COMMUNITY<br />
DEVELOPMENT FINANCE ASSOCIATION (2007): From Exclusion to Inclusion through<br />
<strong>Microfinance</strong>, Working Group 1 – Social and Financial Exclusion Map.<br />
MIDDLESEX UNIVERSITY BUSINESS SCHOOL (2000): Young Entrepreneurs, Women<br />
Entrepreneurs, Ethnic Minority Entrepreneurs and Co-Entrepreneurs in the European Union and<br />
Central and Eastern Europe, March, Middlesex.<br />
NEW ECONOMICS FOUNDATION (nef) (2005): <strong>Overview</strong> of the <strong>Microfinance</strong> Sector in<br />
Europe, <strong>EMN</strong> Working Paper Number 1, <strong>EMN</strong>, Paris.<br />
RICO, Silvia, LACALLE, Maricruz, MÁRQUEZ, Javier & DURÁN, Jaime (2007): Microcredit<br />
in Spain, Foro Nantik Lum <strong>de</strong> Microfinanzas y European <strong>Microfinance</strong> Network, Madrid.<br />
RICO, Silvia y LACALLE, Maricruz (2006): “Exercising the Right to Credit: Financial<br />
Inclusion and the Role of Savings Banks in Spain”, in VV.AA., “Europe: <strong>la</strong> microfinance se fait<br />
une p<strong>la</strong>ce”, finance & common good, nº. 25, Observatoire <strong>de</strong> <strong>la</strong> Finance y European <strong>Microfinance</strong><br />
Network, pp. 94-100, Geneva.<br />
TNS Opinion & Social (2007) Poverty and exclusion. Special Eurobarometer 279. Luxembourg:<br />
Office for Official Publications of the European Communities.<br />
WORLD BANK (<strong>2009</strong>): Data and Statistics <strong>2008</strong>, www.worldbank.com<br />
VV.AA. (2006): “Europe: <strong>la</strong> microfinance se fait une p<strong>la</strong>ce”, finance & common good, nº. 25,<br />
Observatoire <strong>de</strong> <strong>la</strong> Finance y European <strong>Microfinance</strong> Network, Geneva.<br />
105
<strong>EMN</strong> <strong>2008</strong>-<strong>2009</strong> <strong>Overview</strong><br />
106<br />
17 Appendix - Survey Participants<br />
<strong>2008</strong>-<strong>2009</strong> 2006-2007 2004-2005 2002-2003<br />
Austria - ÖSB Consulting GmbH - -<br />
Belgium BRuSoC BRuSoC<br />
Crédal Crédal Crédal Crédal<br />
Fonds <strong>de</strong> Participation Fonds <strong>de</strong> Participation Fonds <strong>de</strong> Participation Fonds <strong>de</strong> Participation<br />
Hefboom vzw Hefboom vzw<br />
Bulgaria MIKRoFoND AD MIKRoFoND AD - -<br />
uNDP JoBS Project uNDP JoBS Project -<br />
ustoi JSC ustoi JSC -<br />
Nacha<strong>la</strong> Cooperative Nacha<strong>la</strong> Cooperative<br />
DSK ABV<br />
Microcredit Guarantee<br />
Fund Project<br />
Croatia<br />
Piraeus Bank<br />
Russe Popu<strong>la</strong>r Kassa<br />
Credit Group<br />
Credible<br />
BC Lending Ruse<br />
“Primorska Popu<strong>la</strong>r Business<br />
Cooperative organization”<br />
Credit Coop Smilyan<br />
Credit Coop Doverie<br />
Credit Coop General Toshevo<br />
“Cooperation MCCPAP-<br />
Stopanin x Haskovo”<br />
Credit Coop Aetos<br />
DeMoS<br />
NoA<br />
- - -<br />
Estonia enterprise Women in estonia<br />
(etna)<br />
- - -<br />
Fin<strong>la</strong>nd Finnvera plc Finnvera plc Finnvera Plc Finnvera Plc<br />
France Adie Adie Adie Adie<br />
Groupe Caisse d’epargne Groupe Caisse d’epargne AIRDIe AIRDIe<br />
CReA-SoL AFILe 77<br />
Crédit Coopératif<br />
Credit Municipal <strong>de</strong> Paris<br />
France Initiative<br />
Société financière <strong>de</strong> <strong>la</strong> Nef<br />
Germany<br />
Arbeitsför<strong>de</strong>rung Kassel-Stadt<br />
GmbH<br />
Behör<strong>de</strong> für Wirtschaft<br />
und Arbeit (Hamburg<br />
Kleinstkreditprogramm)<br />
iq consult GmbH<br />
Goldrausch e.V.<br />
GuM Gesellschaft für<br />
unternehmens - beratung und<br />
Mikrofinanzierung mbH<br />
Investitionsbank Berlin<br />
(Mikrokredit aus <strong>de</strong>m KMu-Fonds)<br />
Arbeitsför<strong>de</strong>rung Kassel Stadt<br />
GmbH<br />
GLS Bank<br />
Investitionsbank Schleswig<br />
Holstein<br />
KfW-Mittelstandsbank KfW Bankengruppe<br />
Land Bran<strong>de</strong>nburg<br />
Mikrofinanzagentur Thuringen<br />
Arbeitsför<strong>de</strong>rung Kassel Stadt<br />
GmbH<br />
enterBusiness GmbH / iq<br />
consult GmbH<br />
Behör<strong>de</strong> für Wirtschaft und<br />
Arbeit Hamburg<br />
enigma Siebte Säule<br />
Microlending GmbH<br />
eXzeT<br />
existenzgrün<strong>de</strong>rzentrum<br />
Stuttgart e.V<br />
GoLDRAuSCH-<br />
Frauennetzwerk Berlin e.V<br />
Investitionsbank Berlin Investitionsbank Berlin<br />
Investitionsbank Schleswig-<br />
Holstein<br />
L- Bank<br />
Lan<strong>de</strong>shauptstadt München<br />
Referat für Arbeit und<br />
Wirtschaft<br />
Magistrat Stadt Kassel,<br />
Sozia<strong>la</strong>mt, ProGeS
Hungary<br />
Mikrofinanzzentrum NRW/<br />
Nie<strong>de</strong>rsachsen - Brechmann<br />
Management GmbH<br />
MONEX Mikrofinanzierung<br />
MozAIK innovative Beratung eg<br />
Regionale Wirtschaftsför<strong>de</strong>rung<br />
Dahme-Spreewald<br />
Sächsische Aufbaubank<br />
Senatorin für Arbeit, Frauen,<br />
Gesundheit, Jugend und Soziales<br />
Westerwäl<strong>de</strong>r Initiativeund<br />
Betriebe-Netz e.V.<br />
“Feuerwehrfonds”<br />
Bács-Kiskun Megyei<br />
Vál<strong>la</strong>lkozásfejlesztési<br />
A<strong>la</strong>pítvány<br />
Baranya Megyei Vál<strong>la</strong>lkozói<br />
Központ A<strong>la</strong>pítvány a Vidék<br />
Kis- és Középvál<strong>la</strong>lkozásainak<br />
Fejlesztésére<br />
Budapesti<br />
Vál<strong>la</strong>lkozásfejlesztési<br />
Köza<strong>la</strong>pítvány<br />
Heves Megyei Vál<strong>la</strong>lkozás- és<br />
Területfejlesztési A<strong>la</strong>pítvány<br />
Jász-Nagykun-Szolnok Megyei<br />
Vál<strong>la</strong>lkozásfejlesztési A<strong>la</strong>pítvány<br />
Kelet Gazdaságélénkítő Zrt.<br />
KKV Fejlesztő Kft.<br />
Komárom-esztergom Megyei<br />
Regionális Vál<strong>la</strong>lkozásfejlesztési<br />
A<strong>la</strong>pítvány<br />
KRF Észak-Magyarországi<br />
Regionális Fejlesztési zrt.<br />
Nógrád Megyei Regionális<br />
Vál<strong>la</strong>lkozásfejlesztési A<strong>la</strong>pítvány<br />
oTP Bank<br />
Pest Megyei Vál<strong>la</strong>lkozásfejlesztési<br />
A<strong>la</strong>pítvány<br />
PRIMoM Szabolcs-<br />
Szatmár-Bereg megyei<br />
Vál<strong>la</strong>lkozásélénkítő A<strong>la</strong>pítvány<br />
Progress Vál<strong>la</strong>lkozásfejlesztő<br />
A<strong>la</strong>pítvány<br />
Rakamaz és Vidéke Körzeti<br />
Takarékszövetkezet<br />
Somogy Megyei Vál<strong>la</strong>lkozói<br />
Központ Köza<strong>la</strong>pítvány<br />
Szigetvári Takarékszövetkezet<br />
Tolna Megyei<br />
Vál<strong>la</strong>lkozásfejlesztési<br />
A<strong>la</strong>pítvány<br />
Vas Megye és Szombathely Város<br />
Regionális Vál<strong>la</strong>lkozásfejlesztési<br />
A<strong>la</strong>pítvány<br />
Veszprém Megyei<br />
Vál<strong>la</strong>lkozásfejlesztési<br />
A<strong>la</strong>pítvány<br />
za<strong>la</strong> Megyei<br />
Vál<strong>la</strong>lkozásfejlesztési A<strong>la</strong>pítvány<br />
Mikrofinanzzentrum NRW/<br />
Nie<strong>de</strong>rsachsen - Brechmann<br />
Management GmbH<br />
MONEX Mikrofinanzierung<br />
Ba<strong>de</strong>n-Württemberg e. V.<br />
Saarländische<br />
Invesitionskreditbank AG<br />
Senatorin für Arbeit, Frauen,<br />
Gesundheit, Jugend und Soziales<br />
Stadt Mainz - MiMi Mikrolending<br />
in Mainz Initiative<br />
Westerwäl<strong>de</strong>r Initiativeund<br />
Betriebe-Netz e.V.<br />
“Feuerwehrfonds”<br />
Budapesti<br />
Vál<strong>la</strong>lkozásfejlesztési<br />
Köza<strong>la</strong>pítvány<br />
Magyar Vál<strong>la</strong>lkozásfejelsztési<br />
Hálózat Konzorcium Nonprofit Kft.<br />
PRIMoM Szabolcs-<br />
Szatmár-Bereg megyei<br />
Vál<strong>la</strong>lkozásélénkítő A<strong>la</strong>pítvány<br />
za<strong>la</strong> Megyei<br />
Vál<strong>la</strong>lkozásfejlesztési A<strong>la</strong>pítvány<br />
Mikrofinanzzentrum NRW<br />
- Brechmann Management<br />
GmbH<br />
MONEX Mikrofinanzierung<br />
Ba<strong>de</strong>n-Württemberg e.V<br />
run - Rheinhessisches<br />
Senatorin fur Arbeit, Frauen,<br />
Gesundheit, Jugend und Soziales<br />
Hungarian <strong>Microfinance</strong> Network<br />
Ire<strong>la</strong>nd First Step <strong>Microfinance</strong> - First Step <strong>Microfinance</strong> First Step <strong>Microfinance</strong><br />
Italy Associazione Diakonia onlus Associazione Diakonia onlus -<br />
Associazione Micro.Bo Associazione Micro.Bo onlus Associazione Micro.Bo<br />
Associazione Progetto Se.Me. Progetto Seme<br />
Banca Popo<strong>la</strong>re etica Banca Popo<strong>la</strong>re etica<br />
Caritas Andria<br />
Caritas Dicesana Vicentina -<br />
Diakonia onlus<br />
Caritas Diocesana di Agrigento<br />
Caritas Diocesana di Gorizia<br />
Caritas Diocesana di Reggio<br />
emilia e Guastal<strong>la</strong><br />
Caritas Diocesiana Vicentina-<br />
Ass.Diakonia onlus<br />
-<br />
107
<strong>EMN</strong> <strong>2008</strong>-<strong>2009</strong> <strong>Overview</strong><br />
108<br />
Caritas Diocesana di Trento<br />
Compagnia di San Paolo<br />
Caritas Italiana<br />
Compagnia Del SS. Sacramento -<br />
Caritas Reggiana<br />
Compagnia di San Paolo<br />
Comune Di Torino Comune Di Torino<br />
Comune Di Venezia<br />
emilbanca<br />
Comune Di Venezia<br />
ecipar emilia Romagna Scarl<br />
Dieci Talenti<br />
essere - Fondo di Aiuto Sociale Fondo essere<br />
Fondazione Anti usura Crt<br />
Fondazione Antiusura “Padre Fondazione Antiusura “Padre<br />
Pino Puglisi - o.N.L.u.S.”<br />
Fondazione Cassa di<br />
Risparmio Carpi<br />
Fondazione Cassa di<br />
Risparmio Pistoia e Pesci<br />
Pino Puglisi - o.N.L.u.S.”<br />
Fondazione Don Mario operti Fondazione Don Mario operti<br />
oNLuS<br />
Fondazione Giovanni dalle<br />
Fabbriche<br />
oNLuS<br />
Fondazione La Casa onlus Fondazione La Casa onlus<br />
Fondazione Lucana Antiusura Fondazione Lucana Antiusura<br />
M. V. Caval<strong>la</strong><br />
M. V. Caval<strong>la</strong><br />
Fondazione Risorsa Donna<br />
Fondazione San Carlo oNLuS<br />
Fondazione Risorsa Donna<br />
Fondazione San Giuseppe<br />
Moscati onlus<br />
Fondazione Antiusura “San<br />
Matteo Apostolo”<br />
Fondazione S. Maria <strong>de</strong>l<br />
Soccorso Catanzaro<br />
Fondazione Risorsa Donna<br />
Fondazione Santa Maria <strong>de</strong>l Fondazione Santa Maria <strong>de</strong>l Fondazione Santa Maria <strong>de</strong>l<br />
Soccorso di Genova<br />
Fondazione SS. Simplicio<br />
e Antonio<br />
Le piaggie - Cooperativa<br />
Sociale Il Cerro<br />
Soccorso di Genova<br />
Fondazione Toscana Per La<br />
Prevenzione Dell’usura - oNLuS<br />
Soccorso di Genova<br />
MAG2 Finance<br />
Mag 4 - Piemonte Società<br />
Cooperativa<br />
MAG2 Finance<br />
Mag Soc. Mutua per<br />
Mag Soc. Mutua per<br />
L’Autogestione (Verona)<br />
Micro Progress onlus<br />
L’Autogestione<br />
Magvenezia Soc. Cooperativa<br />
Microcredito Siena Di Microcredito Siena Di<br />
Solidarietà Spa<br />
Solidarietà Spa<br />
PerMicro PerMicro<br />
Progetto SMoAT Progetto SMoAT<br />
Sviluppo Lazio S.P.A.<br />
Terre In Valigia Servizi -<br />
Fondazione Di Venezia<br />
Latvia Mortgage and Land Bank - - -<br />
Latvia Rural Women Association<br />
Lithuania Ministry of economy - - -<br />
The<br />
Nether<strong>la</strong>nds<br />
INVeGA<br />
Handson Microkrediet<br />
Ne<strong>de</strong>r<strong>la</strong>nd<br />
Kunstenaars&Co<br />
Microkredietfonds Amsterdam<br />
Qredits<br />
Norway Nettverkskreditt BA (Network<br />
Credit Norway - NCN)<br />
GKB Drenthe<br />
Handson Microkrediet<br />
Ne<strong>de</strong>r<strong>la</strong>nd<br />
Kredietbank utrecht<br />
- -<br />
Materiaalfonds voor Beel<strong>de</strong>n<strong>de</strong><br />
Kunst en Vormgeving<br />
Senter Novem<br />
STASoN<br />
-<br />
Nettverkskreditt BA (Network<br />
Credit Norway - NCN)<br />
Po<strong>la</strong>nd<br />
Cultura Bank<br />
Inicjatywa Mikro Inicjatywa Mikro -<br />
Rural Development Foundation Rural Development Foundation<br />
Foundation for the<br />
Development of Polish<br />
Agriculture (FDPA)<br />
Portugal<br />
Associação Nacional <strong>de</strong><br />
Direito ao Crédito – ANDC<br />
Millenium Bank<br />
Associação Nacional <strong>de</strong><br />
Direito ao Crédito – ANDC<br />
Associação Nacional <strong>de</strong><br />
Direito ao Crédito – ANDC<br />
Nettverkskreditt BA (Network<br />
Credit Norway - NCN) with its<br />
loan Fund Microinvest<br />
Associação Nacional <strong>de</strong><br />
Direito ao Crédito – ANDC
Romania<br />
express Finance Institutie<br />
Financiara Nebancara S.A.<br />
FAIR CReDIT HouSe IFN S.A.<br />
GooD.Bee RoMANIA IFN S.A.<br />
oPPoRTuNITY MICRoCReDIT<br />
RoMANIA IFN S.A.<br />
PATRIA BANK (former CAPA<br />
Finance IFN)<br />
express Finance Institutie<br />
Financiara Nebancara S.A.<br />
oPPoRTuNITY MICRoCReDIT<br />
RoMANIA IFN S.A.<br />
SC CAPA FINANCe IFN S.A.<br />
- -<br />
S.C. De MICRoFINANTARe<br />
AuRoRA IFN S.A.<br />
S F Rura<strong>la</strong> FAeR IFN S.A. S F Rura<strong>la</strong> FAeR IFN S.A.<br />
IFN RoMCoM S.A. IFN RoMCoM S.A.<br />
SoCIeTATeA De FINANTARe<br />
RuRALA LAM - I.F.N. S.A.<br />
uNCAR (Romanian Credit union)<br />
Slovakia - Integra Foundation Integra Foundation -<br />
Voka Slovakia<br />
Spain ACAF<br />
Acció Solidaria Contra l’Atur Acció Solidaria Contra l’Atur<br />
AD Molinos<br />
Asociación Grupo <strong>de</strong> Apoyo<br />
a Proyectos<br />
Asociación Tierra Nueva/<br />
Fundación Valdocco<br />
Agencia Desarrollo Local<br />
Ayuntamiento <strong>de</strong> Alcoy<br />
Ayuntamiento <strong>de</strong> Col<strong>la</strong>do Vil<strong>la</strong>lba<br />
Ayuntamiento <strong>de</strong> Saba<strong>de</strong>ll-<br />
Promicio economica <strong>de</strong><br />
Saba<strong>de</strong>ll S.L.<br />
Ayuntamiento <strong>de</strong> Santa Lucia<br />
<strong>de</strong> Tirajana<br />
Barcelona Activa<br />
BBK Solidarioa Fundazioa<br />
BBK Gazte Lanbi<strong>de</strong>an Fundazioa<br />
BBK Solidarioa Fundazioa BBK Solidorioa Fundazioa<br />
Fundación Caixa Catalunya Fundación Caixa Catalunya Fundación Caixa Catalunya Fundación Caixa Catalunya<br />
Caixa Galicia<br />
Caixa Saba<strong>de</strong>ll<br />
Caixa Galicia Caixa Galicia<br />
Caja <strong>de</strong> Ahorros <strong>de</strong> Gipuzkoa<br />
San Sebastian - Kuxta<br />
Caja <strong>de</strong> Ahorros <strong>de</strong> <strong>la</strong> Caja <strong>de</strong> Ahorros <strong>de</strong> <strong>la</strong><br />
Caja <strong>de</strong> Ahorros <strong>de</strong>l<br />
Mediterraneo (CAM)<br />
Caja <strong>de</strong> Baleares “Sa Nostra”<br />
Inmacu<strong>la</strong>da <strong>de</strong> Aragón<br />
Caja <strong>de</strong> Ahorros <strong>de</strong> Valencia,<br />
Castellón y Alicante - Bancaja<br />
Inmacu<strong>la</strong>da <strong>de</strong> Aragon<br />
Caja <strong>de</strong> Ahorros <strong>de</strong> <strong>la</strong> Rioja<br />
Caja <strong>de</strong> Ahorros <strong>de</strong> zaragoza,<br />
Aragon y Rioja - Ibercaja<br />
Caja Duero (dpto. Banca universal)<br />
Fundación CajaGranada Fundacion CajaGranada<br />
Caja Sol<br />
Desarrollo Solidario<br />
Desarrollo Solidario<br />
Cámara <strong>de</strong> Comercio <strong>de</strong> Girona -<br />
Chamber of Commerce<br />
Cámara <strong>de</strong> Comercio <strong>de</strong> Peru<br />
in Spain<br />
Colonya Caixa Pollença<br />
Fe<strong>de</strong>racion <strong>de</strong> Mujeres Progresistas<br />
Fundación economistas Sin<br />
Fronteras<br />
Fundación Magda<strong>la</strong><br />
Fundación Secretariado Gitano<br />
Colonya Caixa Pollença Colonya-Caixa <strong>de</strong> Pollenca<br />
Consorci <strong>de</strong> Promoció<br />
económica <strong>de</strong> Lleida<br />
Cruz Roja espano<strong>la</strong><br />
empresa Municipal per al a <strong>la</strong><br />
Formacio ocupacional<br />
Fundació Privada Trinijove<br />
Fundacion Genus<br />
Fundacion International <strong>de</strong> <strong>la</strong><br />
Mujer empren<strong>de</strong>dora - FIDeM<br />
Fundación Mujeres, Spain<br />
Interarts<br />
Microbank La Caixa Microbank La Caixa Microbank La Caixa<br />
MITA oNG<br />
MITA oNG Centro <strong>de</strong> Desarrollo<br />
<strong>de</strong> Iniciativas empresariales<br />
organizacion <strong>de</strong> Mujeres<br />
empresarias y Gerenicia<br />
Activa (oMeGA)<br />
109
<strong>EMN</strong> <strong>2008</strong>-<strong>2009</strong> <strong>Overview</strong><br />
110<br />
SeCoT, Seniors esponoles<br />
para <strong>la</strong> Cooperacion Tecnica<br />
Transformando Sociedad<br />
Cooperativa Madrid<br />
union <strong>de</strong> Asociaciones <strong>de</strong><br />
Trabajadoras Autonomas y<br />
empren<strong>de</strong>doras<br />
Women’s World Banking -<br />
Banco Mundial <strong>de</strong> <strong>la</strong> Mujer<br />
Fundacion Laboral WWB<br />
en españa<br />
Swe<strong>de</strong>n ALMI Företagspartner AB<br />
NeeM - Swe<strong>de</strong>n<br />
Ros<strong>la</strong>gen Sparbank - Swe<strong>de</strong>n<br />
Sörm<strong>la</strong>nds Sparbank - Swe<strong>de</strong>n<br />
- ALMI Företagspartner AB<br />
ekobanken Medlemsbank<br />
ALMI Företagspartner AB<br />
Switzer<strong>la</strong>nd<br />
United<br />
Kingdom<br />
Microcrédit Solidaire Suisse<br />
(formerly known as Fondation<br />
Asece – Georges Aegler)<br />
Fondation Asece – Georges<br />
Aegler<br />
Fondation ASeCe - Georges<br />
Aegler<br />
ART (Aston Reinvestment Trust) ART (Aston Reinvestment Trust) ART (Aston Reinvestment Trust)<br />
B<strong>la</strong>ck Country Reinvestment<br />
Society Ltd<br />
B<strong>la</strong>ck Country Reinvestment<br />
Society Ltd<br />
B<strong>la</strong>ck Country Reinvestment<br />
Society<br />
B<strong>la</strong>ckpool Moneyline<br />
Aspire <strong>Microfinance</strong><br />
Bristol enterprise<br />
Development fund Ltd<br />
Capitalise Business Support<br />
Business in Prisons<br />
Capitalise Business Support Ltd<br />
Coventry and Warwickshire<br />
Reinvestment Trust<br />
Derbyloans<br />
Developing Strathcly<strong>de</strong><br />
Derby Loans<br />
DSL DSL<br />
east end Microcredit Consortium<br />
east Lancs Moneyline east Lancs Moneyline<br />
east London Small Business<br />
Centre<br />
east Lancs Moneyline<br />
Fair Finance Fair Finance Fair Finance<br />
First enterprise Business First enterprise Business First enterprise Business<br />
Agency Loans east Mid<strong>la</strong>nds<br />
Foundation east Limited<br />
Agency<br />
Agency<br />
Fre<strong>de</strong>ricks Foundation<br />
GLe one London<br />
Gloucestershire Development Gloucestershire Development<br />
Goole Phoenix Loan Fund<br />
Loan Fund Ltd<br />
Loan Fund Ltd<br />
Head for Business<br />
Incredit<br />
Innovative Finance (Hastings Trust)<br />
Key Fund Yorkshire<br />
Leicester Shire Moneyline<br />
(IPS) Ltd<br />
Moneyline Yorkshire (IPS) Ltd<br />
Norfolk and Waveny<br />
enterprise SVS<br />
Northern Pinetree Trust trading<br />
as Spirit of enterprise<br />
NWeS Advance<br />
PRIMe<br />
Prince’s Scottish Youth<br />
The Prince’s Scottish Youth<br />
Business Trust (PSYBT)<br />
Business Trust (PSYBT)<br />
Salford Moneyline<br />
Senet Ltd<br />
Salford MoneyLine<br />
Portsmouth Area Regeneration<br />
Southcoast Moneyline Southcoast Moneyline Trust (now known as South<br />
Coast MoneyLine)<br />
South West Investment Group<br />
Street Cred / Quaker Social Action<br />
Street uK<br />
Street Northeast<br />
Suffolk Regeneration Trust<br />
Street uK<br />
The enterprise Fund Ltd The enterprise Fund Ltd The enterprise Fund Ltd The enterprise Fund Ltd<br />
The Five Lamps organisation The Five Lamps organisation<br />
WeeTu WeeTu WeeTu WeeTu
<strong>EMN</strong> Working Paper nº 6<br />
<strong>2008</strong>-<strong>2009</strong><br />
<strong>Overview</strong><br />
of the Microcredit Sector<br />
in the European Union<br />
Paris<br />
103 Rue <strong>de</strong> Vaugirard<br />
75006 Paris - FRANCe<br />
Tel: +33 (0)1 42 22 01 19<br />
Fax: +33 (0)1 42 22 06 44<br />
Brussels<br />
EU Liaison Office<br />
in the premises of<br />
Fonds <strong>de</strong> participation - Participatiefonds<br />
rue <strong>de</strong> Ligne 1<br />
1000 Brussels - BeLGIuM<br />
Tel: +32 2 209 08 38<br />
Fax: +32 2 209 08 32<br />
emn@european-microfinance.org<br />
www.european-microfinance.org<br />
- N° DOSSIER


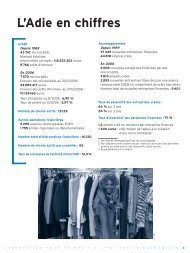


![Joint Report on Social Protection and Social Inclusion [2005]](https://img.yumpu.com/19580638/1/190x132/joint-report-on-social-protection-and-social-inclusion-2005.jpg?quality=85)