Gender Equality National Report Hungary - European-microfinance ...
Gender Equality National Report Hungary - European-microfinance ...
Gender Equality National Report Hungary - European-microfinance ...

Create successful ePaper yourself
Turn your PDF publications into a flip-book with our unique Google optimized e-Paper software.
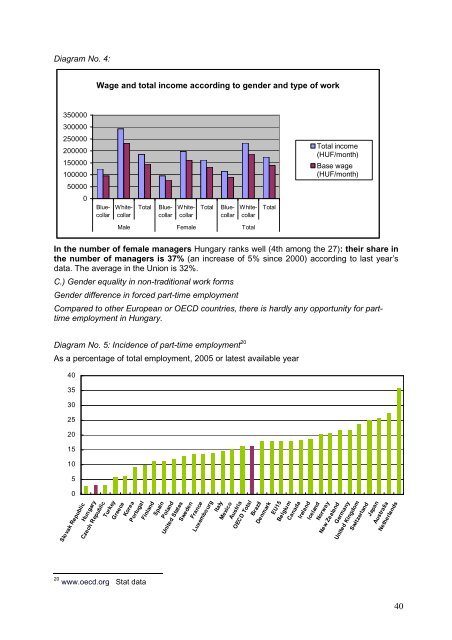
Diagram No. 4:<br />
350000<br />
300000<br />
250000<br />
200000<br />
150000<br />
100000<br />
50000<br />
0<br />
Wage and total income according to gender and type of work<br />
Bluecollar<br />
Whitecollar<br />
Total Bluecollar<br />
Whitecollar<br />
Total Bluecollar<br />
Whitecollar<br />
Male Female Total<br />
Total<br />
Total income<br />
(HUF/month)<br />
Base wage<br />
(HUF/month)<br />
In the number of female managers <strong>Hungary</strong> ranks well (4th among the 27): their share in<br />
the number of managers is 37% (an increase of 5% since 2000) according to last year’s<br />
data. The average in the Union is 32%.<br />
C.) <strong>Gender</strong> equality in non-traditional work forms<br />
<strong>Gender</strong> difference in forced part-time employment<br />
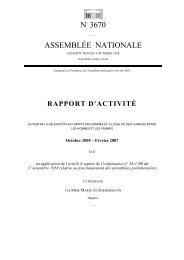
Compared to other <strong>European</strong> or OECD countries, there is hardly any opportunity for parttime<br />
employment in <strong>Hungary</strong>.<br />
Diagram No. 5: Incidence of part-time employment 20<br />
As a percentage of total employment, 2005 or latest available year<br />
40<br />
35<br />
30<br />
25<br />
20<br />
15<br />
10<br />
5<br />
0<br />
Slovak Republic<br />
<strong>Hungary</strong><br />
Czech Republic<br />
Turkey<br />
Greece<br />
Korea<br />
Portugal<br />
Finland<br />
Spain<br />
20 www.oecd.org Stat data<br />
Poland<br />
United States<br />
Sweden<br />
France<br />
Luxembourg<br />
Italy<br />
Mexico<br />
OECD Total<br />
Brazil<br />
Denmark<br />
Austria<br />
EU15<br />
Belgium<br />
Canada<br />
Ireland<br />
Iceland<br />
New Zealand<br />
Germany<br />
United Kingdom<br />
Switzerland<br />
Norway<br />
Japan<br />
Australia<br />
Netherlands<br />
40


![Joint Report on Social Protection and Social Inclusion [2005]](https://img.yumpu.com/19580638/1/190x132/joint-report-on-social-protection-and-social-inclusion-2005.jpg?quality=85)