sbornik_s_2011.pdf
sbornik_s_2011.pdf
sbornik_s_2011.pdf

Create successful ePaper yourself
Turn your PDF publications into a flip-book with our unique Google optimized e-Paper software.
XI. Woorkshop<br />
of Physsical<br />
Chemists and a Electrochemmists´11<br />
XXI.<br />
PPraco<br />
ovní setk kání fyzik f kální ích<br />
chhemi<br />
iků a elek ktroc chemmiků<br />
11th WWorkshop<br />
p of Physsical<br />
Che emists an nd Electrrochemi<br />
ists<br />
Sborník<br />
př říspěv vků<br />
1. – 2. 6. 2011 2<br />
Přírodo ovědecká ffakulta<br />
Ma asarykovy y univerzityy<br />
a<br />
Agronommická<br />
faku ulta MEND DELU<br />
Brno o<br />
- 1 -<br />
Brnoo
XI. Workshop oof<br />
Physical Cheemists<br />
and Electrochemists´11<br />
Přírodovvědecká<br />
ffakulta<br />
MU M V Brněě<br />
Ústav chemmie<br />
Kotlářská 2<br />
611 37 Brnno<br />
http://wwww.sci.munii.cz/<br />
Agronommická<br />
fakkulta<br />
MEN NDELU v BBrně<br />
Ústav chemmie<br />
a biochhemie<br />
Zemědělskká<br />
1<br />
613 00 Brnno<br />
http://ucb. .af.mendeluu.cz<br />
Libuše Trnnková<br />
libuse@chhemi.muni.ccz<br />
(Ústav ch hemie, RECCETOX,<br />
Př řF MU)<br />
René Kizek<br />
kizek@sci.muni.cz<br />
(ÚÚstav<br />
chem mie a biocheemie<br />
MEND DELU, REC CETOX, PřFF<br />
MU)<br />
Vojtěch AAdam,<br />
Sylvie<br />
Holubová,<br />
Kristina Nádeníčko ová, Olga Kr ryštofová, JJiří<br />
Sochor, Petr<br />
Koudelka a Ondřej Zíítka<br />
Publikace neprošla jaazykovou<br />
kontrolou. k Jednotlivé příspěvky jsou publiikovány<br />
tak k, jak<br />
byly dodáány<br />
autoryy.<br />
Za věcn nou a odbbornou<br />
spr rávnost jsou<br />
plně oddpovědni<br />
autoři a<br />
příspěvků. .<br />
Podrobné informacee<br />
včetně sb borníku přííspěvků<br />
jso ou k dispoz zici na inteernetové<br />
adrese<br />
a<br />
http://labiffel.byethosst24.com/<br />
ISBN 9788‐80‐73755‐514‐0<br />
ORRGANIZA<br />
ACE POŘŘÁDAJÍC<br />
CÍ KONFE ERENCI<br />
ORGGANIZAČ<br />
ČNÍ ZABEEZPEČEN<br />
NÍ KONFERENCEE<br />
- 2 -<br />
Brno
XI. Woorkshop<br />
of Physsical<br />
Chemists and a Electrochemmists´11<br />
PPracovvní<br />
setk kání byylo<br />
podpořeno<br />
výzzkumn<br />
nými<br />
projekty<br />
Spo onzoři pracov vního setkán s ní<br />
- 3 -<br />
Brnoo
XI. Workshop oof<br />
Physical Cheemists<br />
and Electrochemists´11<br />
Úvodemm<br />
Milí přátellé,<br />
pro konánní<br />
letošníhoo<br />
XI. Pracov vního setkáání<br />
fyzikáln ních chemi iků a elektrrochemiků<br />
Workshopp<br />
of Physiccal<br />
Chemist ts and Elect ctrochemist ts) bylo zvo oleno datumm<br />
1. a 2. če ervna<br />
roku 2011.<br />
Místem kkonání<br />
je op pět jihomorravská<br />
met tropole, Brn no. Na účasstníky<br />
z Če eské a<br />
Slovenské republiky čekají dva konferenční<br />
dny nap plněné blok kem plenárn rních předn nášek,<br />
přednášekk<br />
nadaných studentů (Sekce ( mladdých)<br />
a pře ednášek, které<br />
shrnujíí<br />
nové pozn natky<br />
v oblasti ffyzikální<br />
a biofyzikál lní chemie, , elektroch hemie a bio oelektrocheemie,<br />
analy ytické<br />
chemie a chemie noových<br />
či po okročilých materiálů. . Již druhý ým rokem jje<br />
do prog gramu<br />
kromě přííspěvků<br />
zaaměřených<br />
na výukuu<br />
zařazen také t blok přednášek k věnovaný ých v<br />
současnostti<br />
hojně diskutova aným témmatům,<br />
jako<br />
je nanověda,<br />
nanomate eriály,<br />
nanotechnnologie<br />
a naanobiotech<br />
hnologie. Vššichni<br />
se mohou m těšit na vědeckké<br />
diskuse, které<br />
budou iniccializoványy<br />
nejen těmito<br />
přednášškami,<br />
ale i prezentace emi velkéhoo<br />
počtu pos sterů.<br />
Záštitu nnad<br />
konferencí<br />
převzali<br />
jak rektoři obou univ verzit (Prrof.<br />
PhDr.<br />
Petr<br />
Fiala, Ph.DD.,<br />
LL.M. a Prof. Ing g. Jaroslav Hlušek, CS Sc., Dr.h.c. .), tak děkkani<br />
přísluš šných<br />
fakult: za Přírodověědeckou<br />
fakultu<br />
MU doc. RND Dr. Jaromír r Leichmannn,<br />
Ph.D. a za<br />
Agronomiickou<br />
fakulttu<br />
MENDE ELU Prof. Inng.<br />
Ladislav v Zeman, CSc.<br />
Počeet<br />
konferennčních<br />
příspěvků<br />
s poostupujícím<br />
mi ročníky neustále rooste.<br />
V leto ošním<br />
roce je jicch<br />
více nežž<br />
osmdesát. . Je nejen vvíce<br />
poster rových sděl lení, ale taaké<br />
i plenárních<br />
přednášekk.<br />
Pozvání nna<br />
letošní ročník PS FCH a EL LCH přijalo celkem šeest<br />
význam mných<br />
českých věědců<br />
z obooru<br />
fyzikáln ní chemie a z oborů, kde fyzikál lní chemie hraje důle ežitou<br />
roli – bioffyzikální<br />
chhemie,<br />
biof fyzika, bioeelektrochem<br />
mie, biome edicína (Inng.<br />
Tomáš Fessl,<br />
Dr. Michaael<br />
Heyrovsský,<br />
Prof. Emil E Palečeek,<br />
Prof. Iv van Švancar ra, Prof. Moojmír<br />
Šob, Prof.<br />
Jiří Zíma). . Postupnýý<br />
nárůst př říspěvků zaaznamenává<br />
á i Sekce mladých, m vee<br />
které stu udenti<br />
prezentujíí<br />
a obhajují<br />
výsledky y své prácee<br />
v anglické ém jazyce. Jako každdý<br />
rok, vyb braná<br />
komise buude<br />
hodnotiit<br />
jejich výkon<br />
a tři nnejlepší<br />
bud dou oceněni<br />
věcnými dary a dipl lomy.<br />
Hodnocenní<br />
nebude vynechán no ani v ppřípadě<br />
po osterů a z důvodů objektivně ějšího<br />
hodnoceníí<br />
bude poster<br />
doplněn n krátkou prrezentací<br />
je ejího autora a, popř. autoorů.<br />
Jak ssi<br />
jistě všimmnete,<br />
vše echna abstrrakta<br />
jsou v jazyce an nglickém, mmají<br />
rozšíř řenou<br />
podobu a obsahují bbarevné<br />
ob brázky či ggrafy.<br />
Abstr rakta jsou součástí sbborníku<br />
s ISBN<br />
(sborník ppříspěvků<br />
odpovídá kritériím k ppro<br />
hodnoc cení VaV v kategoriii<br />
„Příspěve ek do<br />
sborníku“) ). Mohou být<br />
základem m připravovvané<br />
publik kace pro ča asopis Internnational<br />
Journal<br />
of Electrocchemical<br />
Science<br />
– IJES<br />
(http://wwww.electr<br />
rochemsci. org/) s IF 22.175<br />
(z 2009).<br />
2<br />
Podrobnossti<br />
(odevzdáání<br />
rukopis su a výše pooplatku)<br />
bu udou sdělen ny během ko konference.<br />
- 4 -<br />
Brno<br />
ů (11 th
XI. Workshop of Physical Chemists and Electrochemists´11 Brno<br />
Vítáme všechny účastníky XI. Pracovního setkání fyzikálních chemiků a<br />
elektrochemiků a přejeme všem úspěšnou prezentaci, která může být spolu s diskusními<br />
příspěvky velmi užitečným pomocníkem v jejich bádání.<br />
Organizační a vědecký výbor:<br />
doc. RNDr. Libuše Trnková, CSc.<br />
doc. Ing. René Kizek, Ph.D.<br />
doc. Ing. Jaromír Hubálek, Ph.D.<br />
RNDr. Vojtěch Adam, Ph.D.<br />
Technické zabezpečení Pracovního setkání:<br />
Mgr. Sylvie Holubová,<br />
Mgr. Olga Kryštofová,<br />
Kristina Nádeníčková<br />
Ing. Jiří Sochor<br />
- 5 -<br />
Libuše Trnková
XI. Workshop oof<br />
Physical Cheemists<br />
and Electrochemists´11<br />
Orgaanizátoři<br />
děěkují<br />
všem letošním ssponzorům<br />
za podpor ru, která ummožnila<br />
po ořádat<br />
tuto, již trradiční,<br />
akcci:<br />
ANTON PAAR spool.<br />
s r.o., EN NVINET sp pol. s r.o., CCHROMSERVIS<br />
spol. s r. o., MANEKKO<br />
spol. s r. o., METTROHM<br />
sp pol. s r. o. , PRAGOLLAB<br />
spol. s r.o.,<br />
RADANAL<br />
spol. s r. . o., 2-THE ETA spol. s r. o., TRIG GON PLUS S spol. s r. o., též ČE ESKÁ<br />
SPOLEČNNOST<br />
CHEMMICKÁ<br />
(po obočka Brnoo).<br />
Věda V máá<br />
svůj sm mysl,<br />
pokkud<br />
je chápána c a jako cesta c k pravdě p<br />
- 6 -<br />
Brno
XI. Workshop of Physical Chemists and Electrochemists´11 Brno<br />
ELECTROCHEMISTRY OF<br />
METALLOTHIONEINS<br />
Vojtěch ADAM 1 , Ondřej BLASTIK 1 , Ivo FABRIK 1 , Pavlína ŠOBROVÁ 1 , Jitka<br />
PETRLOVÁ 1 , Petr MAJZLÍK 1 , Libuše TRNKOVÁ 1 , René KIZEK 1<br />
1 Mendel University in Brno, Zemedelska 1, CZ-613 00 Brno, CZ<br />
Abstract<br />
Metallothioneins (MT) are a family of ubiquitous, biologically interesting proteins which<br />
have been isolated and studied in a wide variety of organisms, including prokaryotes,<br />
plants, invertebrates and vertebrates. Due to the property of MT being metal-inducible<br />
and, also, due to their high affinity to metal ions, homeostasis of heavy metal levels is<br />
probably their most important biological function. In addition, MT are involved in other<br />
important biochemical pathways including scavenging of reactive oxygen species,<br />
activation of transcription factors or participation in carcinogenesis. Detection and<br />
quantification of MT is not simple due to the high content of cysteine and relatively low<br />
molecular mass. These proteins can be detected very sensitively by electrochemical<br />
methods. Moreover, MT can be used as a part of biosensors.<br />
1. INTRODUCTION<br />
Metallothioneins (MT) belonging to the group of intracellular and low molecular<br />
mass proteins (from 2 to 16 kDa) were discovered in 1957, when Margoshes and Valee<br />
isolated them from a horse renal cortex tissue [1]. These proteins have been isolated and<br />
studied in a wide variety of organisms, including prokaryotes, plants, invertebrates and<br />
vertebrates [2]. Concerning their primary structure, they are rich in cysteine and have no<br />
aromatic amino acids. The metal binding domain of MT consists of 20 cysteine residues<br />
juxtaposed with basic amino acids (lysine and arginine) arranged in two thiol-rich sites<br />
called α and β. The cysteine sulfhydryl groups can bind 7 moles of divalent metal ions per<br />
mol of MT, while the molar ratio for monovalent metal ions (Cu and Ag) is twelve.<br />
Although the naturally occurring protein has Zn2+ in both binding sites, this ion may be<br />
substituted for another metal ion that has a higher affinity for thiolate such as Pb, Cu, Cd,<br />
Hg, Ag, Fe, Pt and/or Pd [3,4].<br />
Besides the metalthiolate clusters and the absence of aromatic amino acids, MT do<br />
not have other characteristic structural features. The primary structure is extremely<br />
variable, whereas it is only conserved within closely related species, which makes the<br />
classification of MT problematic [5]. Based on their metal-inducible properties and their<br />
high affinity for metal ions, homeostasis of heavy metal levels is probably MT's most<br />
important biological function. MT can also serve as “maintainers” of the redox pool of a<br />
cell [6]. In mammals, these proteins may serve as a reservoir of metals (mainly zinc and<br />
copper) for synthesis of apoenzymes and zinc-finger transcription regulators. Moreover,<br />
new roles of these proteins have been discovered including those needed in the<br />
carcinogenic process [7].<br />
- 7 -
XI. Workshop of Physical Chemists and Electrochemists´11 Brno<br />
It is not surprising that techniques using for detection and determination of MT<br />
have been reviewed several times [8-14] . Isolation, separation, detection and/or<br />
quantification of MT are not easy tasks for modern bioanalytical chemistry. Thanks to MT<br />
low molecular mass and unique primary structure, commonly used methods for detection<br />
of proteins suffer from many deficiencies including insufficient specificity and sensitivity.<br />
The most frequent methods used for detection of these proteins are indirect and based on<br />
quantification of heavy metal ions occurring in their structure or on high content of<br />
sulfhydryl groups.<br />
2. ISOLATION PROCEDURES<br />
2.1 Blood, blood serum and cells<br />
Isolation and consequent detection of MT in blood and/or blood serum samples is<br />
not so frequently carried out in comparison with tissues analysis. Heat treatment of a<br />
sample (app. 100 °C for more than five minutes) to denature and remove high molecular<br />
mass proteins from samples proposed by Erk et al. [15] is nowadays successfully applied to<br />
blood and blood serum samples [16,17]. Moreover, Petrlova et al. showed that using of tris<br />
(2-carboxyethyl)phosphine as a reducing agent could be beneficial for quantification of<br />
MT. The modified method was utilized for preparation of blood and blood serum samples<br />
of patients with various tumour diseases [18,19]or preparation fish sperm [20], in which<br />
these proteins have not been quantified before. Caulfield et al. used heat treatment for<br />
preparation of human red blood cells [21]. Cells were disrupted by repeated freezethawing<br />
cycles. The lysates obtained were heat treated and analysed. The authors had<br />
drawn blood from patients by venipuncture into tubes containing heparin. The presence<br />
of heparin or others compounds such as ethylenediaminetetraacetic acid (EDTA) can<br />
seriously influence quantification of MT in blood, blood serum or blood fractions, when<br />
electrochemical methods are used. Adam et al. showed that the presence of EDTA<br />
influenced voltammetric signals markedly [22].<br />
2.2 Animal tissues<br />
To isolate MT from animal tissues, a preparation of crude extract from a tissue and<br />
purification of such extract by using gel filtration is one of the most commonly used<br />
protocols [23]. Tissue extract is prepared in the presence of Tris HCl with added sucrose<br />
[24], glucose and antioxidant specie (mercaptoethanol, dithiothreitol and/or TCEP) [25].<br />
This extract is centrifuged or heat treated with subsequent centrifugation. Erk et al.<br />
reported on comparison of different procedures to purify MT from the digestive glands of<br />
mussels (Mytilus galloprovincialis) exposed to cadmium: heat treatment (at 70 and 85 °C),<br />
solvent precipitation, and gel-filtration [15]. They found that the most convenient was<br />
using heat treatment for the preparation of both heavy metal stressed and non-stressed<br />
tissues with consequent voltammetric detection. Moreover, Beattie et al. successfully<br />
utilized solid phase extractors for MT isolation [26].<br />
2.3 Plant tissues<br />
Preparation of plant tissues, cells and parts to isolate phytochelatins (included into<br />
MT Class III) have been shown in many papers and reviewed several times [27]. MT Class<br />
I and II cannot be found in plant tissues without genetic modification of a plant genome.<br />
- 8 -
XI. Workshop of Physical Chemists and Electrochemists´11 Brno<br />
Macek et al. inserted MT genes from yeast and human into tobacco to enhance their<br />
ability to accumulate metal ions [28]. To detect MT, Diopan et al. prepared crude extracts<br />
from these plants and heat treated the extracts. Results on content of MT were similar to<br />
those detecting expression of mRNA [29].<br />
3. ELECTROCHEMICAL METHODS<br />
Determination of MT by electrochemical methods is based on electroactivity of –SH<br />
moieties, which tend to be oxidized or catalyze evolution of hydrogen from a supporting<br />
electrolyte. To prevent interferences and lower detection limits, an adsorptive transfer<br />
stripping technique (AdTS) is often coupled with electrochemical methods. The main<br />
improvement of AdTS is based on removing the electrode from a solution after<br />
accumulation of a target molecule on its surface, rinsing of the electrode and transferring<br />
it to a pure supporting electrolyte, where no interferences are present [22]. To detect MT,<br />
linear sweep, cyclic, differential pulse and square wave voltammetry have been used.<br />
Usage of these techniques was reviewed by Sestakova and Navratil [30]. Besides the<br />
previously mentioned voltammetric methods, differential pulse voltammetry with a<br />
modification called after its founder “Brdicka reaction” is the most commonly used<br />
electrochemical method for detection of MT in various types of samples since Olafson<br />
optimized it on fish tissues [31]. Over several decades, the method has been optimized<br />
with detection limit under fM [16]. Temperature of the supporting electrolyte (app. 5 °C)<br />
and concentration of cobalt(III) ions (app. 1 mM) play the key role in the reaching the<br />
lowest detection limit. Raspor attempted to elucidate the exact mechanisms of this<br />
reaction [32]. Based on these results, Raspor and her colleagues have done a lot of work to<br />
propose physical and chemical conditions to achieve comparable results in various<br />
laboratories [33]. Moreover, sample-preparation-steps including heat treatment<br />
(mentioned in chapter 2) must precede a measurement. Measurements can be also<br />
automated and thus used for larger set of samples, as was shown by Fabrik et al. [34]. In<br />
spite of the fact that Brdicka reaction is commonly used for detection of MT, Pedersen et<br />
al. showed that differential pulse polarography was found to be unsuitable for crustacean<br />
tissues due to unidentified interfering compounds which led to 5- to 20-fold<br />
overestimation of metallothionein levels [35]. The interfering compounds such as other<br />
low molecular mass thiols, ionic strength or surfactants contained in a sample can be<br />
considered [36].<br />
Besides voltammetric methods, chronopotentiometric stripping analysis (CPSA) can<br />
be also utilized for detection of MT. This method is the most sensitive analytical tool for<br />
detection and determination of MT with detection limits estimated as units of aM [17].<br />
Reaction and therefore sensitivity of determination depends on many parameters such as<br />
pH and ionic strength of a supporting electrolyte, and isoelectric point of measured<br />
protein. Temperature is not a concern compared to Brdicka reaction. Another study<br />
discovered that addition of [Co(NH3)6]Cl3 to a supporting electrolyte can increase<br />
sensitivity up to 30 % [37]. The signal amplification is probably caused by complex<br />
inorganic salt-protein formation. AdTS coupled with the CPSA method was used for<br />
detection of MT expressed in yeast Yarrowia lipolytica exposed to Zn, Ni, Co and Cd [38].<br />
However, Petrlova et al. found that the CPSA signal of MT is dependent on content of<br />
- 9 -
XI. Workshop of Physical Chemists and Electrochemists´11 Brno<br />
metals in the sample, because MT-metal complex gives lower CPSA signal compared to<br />
metal free MT [39]. However, the results can be re-calculated on the content of metals.<br />
Detection limits of electrochemical methods are summarized in Table 1. It is obvious that<br />
electrochemical methods are the most sensitive, however, they can suffer from<br />
misinterpreting of the measured data or inadequate preparation of a sample.<br />
4. BIOSENSORS<br />
The wide spectrum of metal-binding proteins from naturally occurred to artificial<br />
one, prepared using protein engineering, which is mostly specific for one metal ion, is<br />
used for non-enzymatic or affinity based biosensors employed for heavy metal ions<br />
determination. Heavy metal binding proteins including metallothioneins are mostly used<br />
for biosensors construction for different heavy metal ions e.g. mercury(II), copper(II),<br />
cadmium(II), zinc(II) and lead(II) in wide concentration range from fM to mM. These<br />
biosensors have good sensitivity and selectivity, and also acceptable stability time<br />
(approximately 2 weeks) besides wide concentration intervals (Castillo et al. 2004). The<br />
other approach used in biosensing of heavy metal ions is fusion of SmtA metallothionen<br />
from nostoc (families of cyanobacteria) with glutathione-S-transferase. Such modified<br />
metallothionein demonstrated wide selectivity to heavy metals (Zn(II), Cd(II), Cu(II) and<br />
Hg(II)) with high sensitivity up to fM. Glutathione-S-transferase-SmtA electrode was<br />
based on electric capacity determination and it was regenerated with EDTA and stored for<br />
16 days (Corbisier et al. 1999). Rabbit metallothionein was successfully employed as<br />
biological agent of biosensor for cadmium(II) and zinc(II) ions (Adam et al. 2007b),<br />
palladium(II) ions (Adam et al. 2007a), silver(I) ions (Krizkova et al. 2010), and cisplatin<br />
(Huska et al. 2009) determination.<br />
5. ACKNOWLEDGEMENT<br />
The work was by GA AV IAA401990701.<br />
6. REFERENCES<br />
[1] M. Margoshes, B.L. Vallee, J. Am. Chem. Soc. 79 (1957) 4813.<br />
[2] P. Coyle, J.C. Philcox, L.C. Carey, A.M. Rofe, Cell. Mol. Life Sci. 59 (2002) 627.<br />
[3] T.T. Ngu, M.J. Stillman, IUBMB Life 61 (2009) 438.<br />
[4] M. Nordberg, G.F. Nordberg, Cell. Mol. Biol. 46 (2000) 451.<br />
[5] J.H.R. Kagi, Method Enzymol. 205 (1991) 613.<br />
[6] A. Viarengo, B. Burlando, N. Ceratto, I. Panfoli, Cell. Mol. Biol. 46 (2000) 407.<br />
[7] T. Eckschlager, V. Adam, J. Hrabeta, K. Figova, R. Kizek, Curr. Protein Pept. Sci. 10 (2009) 360.<br />
[8] J.C. Amiard, C. Amiard-Triquet, S. Barka, J. Pellerin, P.S. Rainbow, Aquat. Toxicol. 76 (2006) 160.<br />
[9] A.T. Miles, G.M. Hawksworth, J.H. Beattie, V. Rodilla, Crit. Rev. Biochem. Mol. Biol. 35 (2000) 35.<br />
[10] K. Das, V. Debacker, J.M. Bouquegneau, Cell. Mol. Biol. 46 (2000) 283.<br />
[11] T. Minami, S. Ichida, K. Kubo, J. Chromatogr. B 781 (2002) 303.<br />
[12] A. Prange, D. Schaumloffel, Anal. Bioanal. Chem. 373 (2002) 441.<br />
[13] J. Szpunar, Analyst 125 (2000) 963.<br />
[14] J. Szpunar, Analyst 130 (2005) 442.<br />
[15] M. Erk, D. Ivanković, B. Raspor, J. Pavicić, Talanta 57 (2002) 1211.<br />
[16] J. Petrlova, D. Potesil, R. Mikelova, O. Blastik, V. Adam, L. Trnkova, F. Jelen, R. Prusa, J. Kukacka, R.<br />
Kizek, Electrochim. Acta 51 (2006) 5112.<br />
[17] R. Kizek, L. Trnkova, E. Palecek, Anal. Chem. 73 (2001) 4801.<br />
- 10 -
XI. Workshop of Physical Chemists and Electrochemists´11 Brno<br />
[18] I. Fabrik, S. Krizkova, D. Huska, V. Adam, J. Hubalek, L. Trnkova, T. Eckschlager, J. Kukacka, R.<br />
Prusa, R. Kizek, Electroanalysis 20 (2008) 1521.<br />
[19] S. Krizkova, I. Fabrik, V. Adam, J. Kukacka, R. Prusa, G.J. Chavis, L. Trnkova, J. Strnadel, V. Horak,<br />
R. Kizek, Sensors 8 (2008) 3106.<br />
[20] I. Fabrik, Z. Svobodova, V. Adam, S. Krizkova, L. Trnkova, M. Beklova, M. Rodina, R. Kizek, J. Appl.<br />
Ichthyol. 24 (2008) 522.<br />
[21] L.E. Caulfield, C.M. Donangelo, P. Chen, J. Junco, M. Merialdi, N. Zavaleta, Nutrition 24 (2008) 1081.<br />
[22] V. Adam, S. Krizkova, O. Zitka, L. Trnkova, J. Petrlova, M. Beklova, R. Kizek, Electroanalysis 19<br />
(2007) 339.<br />
[23] Y. Li, W. Maret, J. Anal. At. Spectrom. 23 (2007) 1055.<br />
[24] J.H. Beattie, M.P. Richards, R. Self, J. Chrom. 632 (1993) 127.<br />
[25] H. Vodickova, V. Pacakova, I. Sestakova, P. Mader, Chem. Listy 95 (2001) 477.<br />
[26] J.H. Beattie, R. Self, M.P. Richards, Electrophoresis 16 (1994) 322.<br />
[27] C. Cobbett, P. Goldsbrough, Annu. Rev. Plant Biol. 53 (2002) 159.<br />
[28] T. Macek, M. Mackova, D. Pavlikova, J. Szakova, M. Truksa, S. Cundy, P. Kotrba, N. Yancey, W.H.<br />
Scouten, Acta Biotech. 22 (2001) 101.<br />
[29] V. Diopan, V. Shestivska, V. Adam, T. Macek, M. Mackova, L. Havel, R. Kizek, Plant Cell Tissue<br />
Organ Cult. 94 (2007) 291.<br />
[30] I. Sestakova, T. Navratil, Bioinorg. Chem. Appl. 3 (2003) 43.<br />
[31] R.W. Olafson, P.E. Olsson, Method Enzymol. 205 (1991) 205.<br />
[32] B. Raspor, J. Electroanal. Chem. 503 (2001) 159.<br />
[33] B. Raspor, M. Paic, M. Erk, Talanta 55 (2001) 109.<br />
[34] I. Fabrik, Z. Ruferova, K. Hilscherova, V. Adam, L. Trnkova, R. Kizek, Sensors 8 (2008) 4081.<br />
[35] K.L. Pedersen, S.N. Pedersen, J. Knudsen, P. Jerregaard, Environ. Sci. Technol. 42 (2008) 8426.<br />
[36] S. Krizkova, I. Fabrik, V. Adam, J. Kukacka, R. Prusa, L. Trnkova, J. Strnadel, V. Horak, R. Kizek,<br />
Electroanalysis 21 (2008) 640.<br />
[37] M. Tomschik, L. Havran, E. Palecek, M. Heyrovsky, Electroanalysis 12 (2000) 274.<br />
[38] M. Strouhal, R. Kizek, J. Vecek, L. Trnkova, M. Nemec, Bioelectrochemistry 60 (2003) 29.<br />
[39] J. Petrlova, S. Krizkova, O. Zitka, J. Hubalek, R. Prusa, V. Adam, J. Wang, M. Beklova, B. Sures, R.<br />
Kizek, Sens. Actuator B-Chem. 127 (2007) 112.<br />
- 11 -
XI. Workshop of Physical Chemists and Electrochemists´11 Brno<br />
ELECTROCHEMISTRY IN SPACE<br />
René KIZEK 1 , Vojtěch ADAM 1 , Jaromír HUBÁLEK 2<br />
1 Mendel University in Brno, Zemedelska 1, CZ-613 00 Brno, CZ<br />
2 Brno University of Technology, Technicka 10, CZ-616 00 Brno, CZ<br />
Abstract<br />
The exploration of Mars has been an important part of the space exploration programs of<br />
many countries in the world. Dozens of robotic spacecraft, including orbiters, landers, and<br />
rovers, have been launched toward Mars since the 1960s. These missions were aimed at<br />
gathering data about current conditions and answering questions about the history of<br />
Mars as well as a preparation for a possible human mission to Mars. The questions raised<br />
by the scientific community are expected to not only give a better appreciation of the red<br />
planet but also yield further insight into the past, and possible future, of Earth. It seems<br />
that electrochemistry could play a key role in the development of well portable and<br />
sensitive analyzers.<br />
1. INTRODUCTION<br />
In 2008, researchers from Brno University of Technology, Mendel University in<br />
Brno and Masaryk Universtiy succeeded in the program Nanotechnology for Society<br />
supported by the government of the Czech Republic and the ongoing project is<br />
successfully solving the priority tasks. This project is focused on development of new<br />
nanosystems applicable in medicine as biosensors for online monitoring particular<br />
physiological characteristics and treatment progression in general. To further reinforce<br />
the collaboration of Brno Universities (Masaryk University, Brno University of<br />
Technology, and Mendel University in Brno) the centre of excellence called CEITEC<br />
(Central European Institute of Technology) and Regional research centre SIX: Sensors,<br />
information and communication systems have been established to create an effective<br />
platform for research in nanotechnnology and nanoscience comprising materials and<br />
functional structures suitable for nanoelectronics and nanophotonics in general,<br />
addressing both the preparation and the characterization of nanostructures applicable in<br />
bio-medical areas, energetic and information and communication technologies. This<br />
platform based on specific experiences of members will enable the participation on<br />
important projects founded by European Union, which have begun by fruitful<br />
participation in ongoing project MAS (Nanoelectronics for Mobile AAL-Systems). During<br />
the last five years, the results of Laboratory of Metallomics and Nanotechnologies have<br />
been published as 128 publications in ISI-indexed journals with a total impact factor<br />
241,664. The most important results can be found in highly impacted journals as TRAC-<br />
Trends in Analytical Chemistry, Analytical Chemistry, Current Medical Chemistry, PLoS<br />
ONE, Biochemical Pharmacology and the others<br />
- 12 -
XI. Workshop of Physical Chemists and Electrochemists´11 Brno<br />
2. ADVANCED ROBOTIC NANOBIOTECHNOLOGIES FOR EXPLORATION<br />
OF MARS’S SURFACE<br />
The ARNEMS project is focused on the development of a unique multi-purpose<br />
detector called Eurydica for analysis of surface and environment at Mars. The<br />
multipurpose detector Eurydica uses the latest lab-on-chip nanobiotechnologies. The<br />
developed detector will be controlled by our developed software, to which neural<br />
networks and artificial intelligence will be implemented with regard to do the most<br />
sensitive evaluation and processing of signals. Eurydica detector will be also implemented<br />
in the reconnaissance robot Orpheus. Moreover, the robot will carry additional<br />
equipments for sampling of Mars environment and for cultivating and handling with<br />
bacteria able to live on the Mars and create oxygen atmosphere. This feature will serve as<br />
so called incubator for the microorganisms. Using sensing devices, we will be able to<br />
analyse simultaneously outer environment and inner conditions in bacteria colony.<br />
ARNEMS will be equipped with:<br />
• fully automatic r reconnaissance robotic systems for exploring of a plant surface and<br />
carrying additional equipments,<br />
• the robotic system enables wireless data transfer and telepresentation based user<br />
interface,<br />
• chemical and biochemical analyser based on electrochemical lab-on-chip techniques,<br />
• dock for bacteria and their cultivation medium.<br />
ARNEMS will enable to us!<br />
• ability to detect living species,<br />
• ability to analyze water,<br />
• ability to detect desired gases,<br />
• to maintain and monitor conditions for cultivation of bacteria.<br />
3. NOWADAYS TECHNOLOGIES - PHOENIX<br />
Phoenix was a robotic spacecraft on a space exploration mission on Mars under the<br />
Mars Scout Program. The Phoenix lander descended on Mars on May 25, 2008. Mission<br />
scientists used instruments aboard the lander to search for environments suitable for<br />
microbial life on Mars, and to research the history of water there. The multi-agency<br />
program was headed by the Lunar and Planetary Laboratory at the University of Arizona,<br />
under the direction of NASA's Jet Propulsion Laboratory. The program was a partnership<br />
of universities in the United States, Canada, Switzerland, Denmark, Germany, the United<br />
Kingdom, NASA, the Canadian Space Agency, the Finnish Meteorological Institute,<br />
Lockheed Martin Space Systems, MacDonald Dettwiler & Associates (MDA) and other<br />
aerospace companies. It was the first mission to Mars led by a public university in NASA<br />
history. The mission underscored the value of university-led management. It was led<br />
directly from the University of Arizona's campus in Tucson, with project management at<br />
the Jet Propulsion Laboratory in Pasadena, Calif., and project development at Lockheed<br />
- 13 -
XI. Workshop of Physical Chemists and Electrochemists´11 Brno<br />
Martin in Denver, Colorado. The operational funding for the mission extended through<br />
November 10, 2008 [1-6].<br />
Phoenix is NASA's sixth successful landing out of seven attempts and is the most<br />
recent spacecraft to land successfully on Mars as well as the first successful landing in a<br />
Martian polar region. The lander completed its mission in August 2008, and made a last<br />
brief communication with Earth on November 2 as available solar power dropped with<br />
the Martian winter. The mission was declared concluded on November 10, 2008, after<br />
engineers were unable to re-contact the craft. After unsuccessful attempts to contact the<br />
lander by the Mars Odyssey orbiter up to and past the Martian summer solstice on May<br />
12, 2010, JPL declared the lander to be dead. Like the two Mars Exploration Rovers, the<br />
program was considered a success because it exceeded its planned mission length by<br />
several months [7,8].<br />
On June 24, 2008, NASA's scientists launched a major series of tests. The robotic arm<br />
scooped up more soil and delivered it to 3 different on-board analyzers: an oven that<br />
baked it and tested the emitted gases, a microscopic imager, and a wet chemistry lab. The<br />
lander's Robotic Arm scoop was positioned over the Wet Chemistry Lab delivery funnel<br />
on Sol 29 (the 29th Martian day after landing, i.e. June 24, 2008). The soil was transferred<br />
to the instrument on Sol 30 (June 25, 2008), and Phoenix performed the first wet<br />
chemistry tests. On Sol 31 (June 26, 2008) Phoenix returned the wet chemistry test results<br />
with information on the salts in the soil, and its acidity. The wet chemistry lab was part of<br />
the suite of tools called the Microscopy, Electrochemistry and Conductivity Analyzer<br />
(MECA) [9].<br />
Preliminary wet chemistry lab results showed the surface soil is moderately alkaline,<br />
between pH 8 and 9. Magnesium, sodium, potassium and chloride ions were found; the<br />
overall level of salinity is modest. Chloride levels were low, and thus the bulk of the<br />
anions present were not initially identified. The pH and salinity level were viewed as<br />
benign from the standpoint of biology. TEGA analysis of its first soil sample indicated the<br />
presence of bound water and CO2 that were released during the final (highesttemperature,<br />
1,000°C) heating cycle. Results published in the journal Science after the<br />
mission ended reported that chloride, bicarbonate, magnesium, sodium potassium,<br />
calcium, and possibly sulfate were detected in the samples. The pH was narrowed down to<br />
7.7±0.5. Perchlorate (ClO4), a strong oxidizer at elevated temperatures, was detected. This<br />
was a significant discovery. The chemical has the potential of being used for rocket fuel<br />
and as a source of oxygen for future colonists. Under certain conditions perchlorate can<br />
inhibit life; however some microorganisms obtain energy from the substance (by<br />
anaerobic reduction). The chemical when mixed with water can greatly lower freezing<br />
points, in a manner similar to how salt is applied to roads to melt ice. So, perchlorate may<br />
be allowing small amounts of liquid water to form on Mars today. Gullies, which are<br />
common in certain areas of Mars, may have formed from perchlorate melting ice and<br />
causing water to erode soil on steep slopes [10].<br />
- 14 -
XI. Workshop of Physical Chemists and Electrochemists´11 Brno<br />
4. WET CHEMISTRY LAB<br />
The wet chemistry lab (WCL) sensor assembly and leaching solution were designed<br />
and built by Thermo Fisher Scientific. The WCL actuator assembly was designed and built<br />
by Starsys Research in Boulder, Colorado. Tufts University developed the reagent pellets,<br />
barium ISE, ASV electrodes, and performed the preflight characterization of the sensor<br />
array [9-13].<br />
The robotic arm scooped up some soil, put it in one of four wet chemistry lab cells,<br />
where water was added, and while stirring, an array of electrochemical sensors measured<br />
a dozen dissolved ions such as sodium, magnesium, calcium, and sulfate that have leached<br />
out from the soil into the water. This provided information on the biological compatibility<br />
of the soil, both for possible indigenous microbes and for possible future Earth visitors<br />
[14]. Every wet chemistry cell has 26 chemical sensors and a temperature sensor. The<br />
polymer Ion Selective Electrodes were able to determine the concentration of ions by<br />
measuring the change of electric potential within the sensor, which is separated from the<br />
wet chemistry cell by an ion selective membrane. The two gas sensing electrodes for<br />
oxygen and carbon dioxide work on the same principle and are separated from the wet<br />
chemistry cell by a gas permeable membrane. A gold micro-electrode array is used for the<br />
Cyclic voltammetry and Anodic Stripping Voltammetry. Cyclic voltammetry is a method<br />
to study ions by applying a waveform of varying potential and measuring the currentvoltage<br />
curve. Anodic Stripping Voltammetry first deposits the metals onto the gold<br />
electrode with an applied potential. After the potential is reversed, the current is<br />
measured while the metals are stripped off the electrode. The first measurement indicated<br />
that the surface layer contained water soluble salts and had a pH between 8 and 9.<br />
Additional tests on soil composition revealed the presence of perchlorate [14].<br />
Later publication of results in the journals Science and JGR reported that chloride, bicarbonate,<br />
magnesium, sodium potassium, calcium, and possibly sulfate were detected in the samples. The pH<br />
was narrowed down to 7.7 + or – 0.5 [9-11]. Further data analysis has indicated that the soil contains<br />
soluble sulfate at a minimum of 1.1% wt % SO3 and provided a refined formulation of the soil [9].<br />
5. ACKNOWLEDGEMENT<br />
The work was by NanoBioTECell GA ČR P102/11/1068.<br />
6. REFERENCES<br />
[1] R.A. Kerr, Science 329 (2010) 1267.<br />
[2] R.G. Bonitz, L. Shiraishi, M. Robinson, R.E. Arvidson, P.C. Chu, J.J. Wilson, K.R. Davis, G. Paulsen,<br />
A.G. Kusack, D. Archer, P. Smith, Journal of Geophysical Research-Planets 113 (2008) 10.<br />
[3] J.R. Guinn, M.D. Garcia, K. Talley, Journal of Geophysical Research-Planets 113 (2008) 16.<br />
[4] J.H. Hoffman, R.C. Chaney, H. Hammack, Journal of the American Society for Mass Spectrometry 19<br />
(2008) 1377.<br />
[5] H.U. Keller, W. Goetz, H. Hartwig, S.F. Hviid, R. Kramm, W.J. Markiewicz, R. Reynolds, C.<br />
Shinohara, P. Smith, R. Tanner, P. Woida, R. Woida, B.J. Bos, M.T. Lemmon, Journal of Geophysical<br />
Research-Planets 113 (2008) 15.<br />
[6] P.A. Taylor, D.C. Catling, M. Daly, C.S. Dickinson, H.P. Gunnlaugsson, A.M. Harri, C.F. Lange,<br />
Journal of Geophysical Research-Planets 113 (2008) 8.<br />
[7] R.E. Arvidson, R.G. Bonitz, M.L. Robinson, J.L. Carsten, R.A. Volpe, A. Trebi-Ollennu, M.T. Mellon,<br />
P.C. Chu, K.R. Davis, J.J. Wilson, A.S. Shaw, R.N. Greenberger, K.L. Siebach, T.C. Stein, S.C. Cull, W.<br />
- 15 -
XI. Workshop of Physical Chemists and Electrochemists´11 Brno<br />
Goetz, R.V. Morris, D.W. Ming, H.U. Keller, M.T. Lemmon, H.G. Sizemore, M. Mehta, Journal of<br />
Geophysical Research-Planets 114 (2009) 21.<br />
[8] R. Bonitz, L. Shiraishi, M. Robinson, J. Carsten, R. Volpe, A. Trebi-Ollennu, R.E. Arvidson, P.C. Chu,<br />
J.J. Wilson, K.R. Davis, Ieee, in 2009 Ieee Aerospace Conference, Vols 1-7, Ieee, New York, 2009, p.<br />
42.<br />
[9] S.P. Kounaves, M.H. Hecht, S.J. West, J.M. Morookian, S.M.M. Young, R. Quinn, P. Grunthaner,<br />
X.W. Wen, M. Weilert, C.A. Cable, A. Fisher, K. Gospodinova, J. Kapit, S. Stroble, P.C. Hsu, B.C.<br />
Clark, D.W. Ming, P.H. Smith, Journal of Geophysical Research-Planets 114 (2009) 20.<br />
[10] W.V. Boynton, D.W. Ming, S.P. Kounaves, S.M.M. Young, R.E. Arvidson, M.H. Hecht, J. Hoffman,<br />
P.B. Niles, D.K. Hamara, R.C. Quinn, P.H. Smith, B. Sutter, D.C. Catling, R.V. Morris, Science 325<br />
(2009) 61.<br />
[11] M.H. Hecht, S.P. Kounaves, R.C. Quinn, S.J. West, S.M.M. Young, D.W. Ming, D.C. Catling, B.C.<br />
Clark, W.V. Boynton, J. Hoffman, L.P. DeFlores, K. Gospodinova, J. Kapit, P.H. Smith, Science 325<br />
(2009) 64.<br />
[12] S.P. Kounaves, Chemical & Engineering News 86 (2008) 8.<br />
[13] S.R. Lukow, S.R. Kounaves, Electroanalysis 17 (2005) 1441.<br />
[14] S.P. Kounaves, S.R. Lukow, B.P. Comeau, M.H. Hecht, S.M. Grannan-Feldman, K.<br />
Manatt, S.J. West, X.W. Wen, M. Frant, T. Gillette, Journal of Geophysical<br />
Research-Planets 108 (2003) 12.<br />
- 16 -
XI. Workshop of Physical Chemists and Electrochemists´11 Brno<br />
ANATOMICAL STUDY OF VEGETATIVE<br />
ORGANS OF RHUS HIRTA (L.) SUDW.<br />
(ANACARDIACEAE)<br />
Petr BABULA 1 , Anna KORVASOVÁ 1 , Vojtěch ADAM 2 , René KIZEK 2<br />
1 Department of Natural Drugs, Faculty of Pharmacy, University of Veterinary and Pharmaceutical Sciences<br />
Brno, Palackeho 1/3, CZ-61242 Brno, Czech Republic.<br />
2 Department of Chemistry and Biochemistry, Faculty of Agronomy, Mendel University, Zemedelska 1, CZ-<br />
61300 Brno, Czech Republic<br />
Abstract<br />
Family Anacardiaceae (cashew family, sumac family) consists of about 700 species of<br />
shrubs and trees classified in 82 genera. Some species are used for production of fruit<br />
(mango, pistachio, cashew nuts), some species are important toxicologically – for example<br />
poison ivy (Toxicodendron radicans). Rhus hirta (L.) Sudw. (staghorn sumac), small<br />
deciduous tree native to Southeastern Canada, is widely cultivated in gardens as<br />
ornamental plant. Despite this fact, anatomical study of individual vegetative organs of R.<br />
hirta is still missing. This study is focused on the anatomy of vegetative organs – roots,<br />
stems and leaves – of Rhus hirta (L.) Sudw. using methods of light and fluorescence<br />
microscopy.<br />
1. INTRODUCTION<br />
Family Anacardiaceae Lindl. comprises evergreen or deciduous shrubs and trees<br />
usually with latex of tropical and subtropical regions (Tingshuang, et al.). Some plants are<br />
widely cultivated due to edible fruits or seeds – mango (Mangifera indica), pistachio<br />
(Pistacia vera), cashew nuts (Anacardium occidentale) or pink pepper (Schinus<br />
terebinthifolius). Wood of species of South American genus Schinopsis - “quebracho<br />
colorado” - is used for its hardness. Some plants of this family have toxicological<br />
importance due to ability to irritate skin and induce dermatitis after contact. Especially<br />
species of genus Toxicodendron, which are placed also in the genus Rhus, are responsible<br />
for cases of poisoning – poison ivy (T. radicans, T. rydbergii), Eastern poison oak (T.<br />
toxicarium), Western poison oak (T. versilobum) and poison sumac (T. vernix). Chinese<br />
and Japanese species Toxicodendron vermicifluum - “Japanese lac tree” and Metopium<br />
toxiferum - “poison wood” - a shrub native to South Florida and Northern West Indies are<br />
also responsible for contact dermatitis (Lampe; Beaman, Hurtado). Urushiol, a mixture of<br />
3-alkylcatechols and 3-alkencatechols, is the main component of above-mentioned<br />
species, however, next chemically relative compounds have been found in different<br />
species of Anacardiaceae family (Moyo et al., . Chemical formulas of these compounds are<br />
summarized in Tab. 1.<br />
- 17 -
XI. Workshop oof<br />
Physical Cheemists<br />
and Electrochemists´11<br />
(1)<br />
COOH H<br />
( (2)<br />
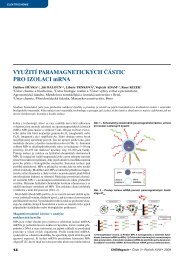
Fig. 1: Cheemical<br />
formmulas<br />
of ph henolic lipiddes<br />
in Anac cardiaceae. 1 – anacarrdic<br />
acids, 2 – 3-<br />
alkyylphenols<br />
(cardanol, anacardol) ), 3 – 5-al lkylresorcin nols (cardools)<br />
and 4 – 3-<br />
alkyylcatecholss<br />
(urushiols s). R = C13, C15 or C17 7, usually alkan a or alkken.<br />
Somee<br />
memberrs<br />
of fam mily Anacaardiaceae<br />
are a used in n folk meedicines<br />
du ue to<br />
antimicrobbial,<br />
antivirral<br />
(anti-ret troviral), annti-parasiti<br />
ical and ant ti-inflammaatory<br />
prope erties<br />
(Amphipte terygium ad adstringens – (Mexicoo),<br />
Astroni ium urund deuvea – BBolivia,<br />
Co otinus<br />
coggygria – Bulgariaa,<br />
Harpephy hyllum caffr frum – Africa,<br />
Heeria insignis - Africa, La annea<br />
corromanddelica<br />
– Inddia,<br />
Ozoroa a insignis (AAfrica),<br />
Rhu hus spp. (Afr rica), Schinnus<br />
molle (S South<br />
America), Spondyis sspp.<br />
(South America, AAfrica),<br />
and d others).<br />
Rhus us hirta (L.) Sudw. (syn.<br />
Rhus typ yphina L.) is i a small tr ree native to Southea astern<br />
Canada. Itt<br />
grows to 3 – 10 m tall,<br />
pinnatelly<br />
compoun nds leaves are a 25 – 55 cm long. Plants P<br />
are dioecioous,<br />
flowerrs<br />
form characteristic<br />
clusters of male/female<br />
flowers ( (see Fig. 2) . The<br />
fruits of RR.<br />
hirta are in some co ountries coollected<br />
and d used for making of pink lemonade.<br />
Native Ammerican<br />
tribbes<br />
mix lea aves of this species with<br />
leaves of o tobacco ffor<br />
smoking g. All<br />
parts of plants<br />
exceptt<br />
of roots ar re used as a natural dy ye and as a mordant du due to conte ent of<br />
tannins (ggallotanninns).<br />
Other secondary metabolit tes (except of gallotaannins)<br />
include<br />
flavonoidss,<br />
and terpeenes<br />
- espec cially monooterpenes,<br />
sesquiterpen<br />
nes and tritterpenes.<br />
Fig. 2. Femmale<br />
(A) andd<br />
male (B) plant of Rhhus<br />
hirta Rhus Rh hirta (L L.) Sudw.<br />
- 18 -<br />
(3)<br />
(4)<br />
Brno
XI. Workshop of Physical Chemists and Electrochemists´11 Brno<br />
2. EXPERIMENT<br />
Plant material (roots, stems, leaves) was collected in the botanical garden of<br />
University of Veterinary and Pharmaceutical University Brno. For the anatomical study,<br />
transversal, radial and tangential hand-made sections were used. For the visualization of<br />
lignified plant tissues, ethanolic (50 %, v/v) mixture of acid fuchsine and malachite green<br />
(both 1%, w/w; Sigma-Aldrich, USA) was used. Sections were stained for four minutes<br />
and after it washed with acidic ethanol (60 %, v/v, with 37% hydrochloric acid 0.1 %, v/v,<br />
Sigma-Aldrich, USA). At once, sections, which were not stained, were used for<br />
microscopic analysis using fluorescence microscope (Carl Zeiss Axioscop 40, Zeiss,<br />
Germany). In addition, sections were stained by aqueous solution of acridine orange (1 %,<br />
w/w, Sigma-Aldrich, USA) for detection of non-lignified and lignified structures.<br />
3. RESULTS AND DISCUSSION<br />
The object of this study was focused on vegetative organs of Rhus hirta (L.) Sudw.<br />
Roots were observed only in the secondary state because of very early formation of<br />
vascular cambium, which produces elements of secondary xylem and secondary phloem.<br />
Secondary xylem of roots is typical due to presence of high number of vessels of large<br />
diameter. Amount of libriform is low; in addition, secondary cell walls if libriform are<br />
very thin and almost without lignification. Secondary phloem consists of sieve tubemembers,<br />
which are arranged in tangential groups, radial parenchyma forms well visible<br />
rays. Axial parenchyma of secondary phloem are associated with sieve tube-members. In<br />
the older parts of secondary phloem, there are large schizogenous intercellular cavities.<br />
Secondary dermal tissue periderm consists of layers of phellem cells with suberinised cell<br />
walls and 1-2-layered cork cambium (phellogene). Phelloderm is reduced to only several<br />
cells, which undergo sclerification under formation of sclereids (see Fig. 3).<br />
Stems as well as roots very early undergo process of secondary thickening due to<br />
activity of vascular cambium and cork cambium. However, epidermis persists after<br />
formation of vascular cambium. Some epidermal cells are modified into trichomes.<br />
Glandular trichomes, which are associated with production of some secondary<br />
metabolites, are typically multicellular. Cortex consists of collenchymatous hypodermis,<br />
parenchymatous mesodermis and indistinct endodermis- starch sheath. Vascular bundles<br />
are arranged in one ring (eustele) and are typically collateral. Elements of protophloem<br />
undergo sclerification under formation of sclerenchyma on the periphery of vascular<br />
bundles. Metaphloem is connected with formation of large schizogenous secretory<br />
cavities, each vascular bundle contains one cavity. In comparison with roots, secondary<br />
xylem of stem contains less vessels and higher amount of libriform with distinct secondary<br />
cell walls. Axial parenchyma is associated with vessels, ray parenchyma forms<br />
heterocellular rays. Pith is parenchymatous, some cells undergo sclerification and form<br />
individual sclereids. In addition, pith contains schizogenous intercellular cavities with<br />
distinct epithelial cells (see Fig. 4).<br />
- 19 -
XI. Workshop oof<br />
Physical Cheemists<br />
and Electrochemists´11<br />
Anattomy<br />
of peetiole<br />
is sim milar to struucture<br />
of stem s includ ding format ation of vas scular<br />
cambium. Leaves aree<br />
bifacial wi ith leaf meesophyll<br />
dif fferentiated d into palisaade<br />
parench hyma<br />
and sponggy<br />
parenchhyma.<br />
Vasc cular bunddles<br />
(collat teral) contain<br />
distincct<br />
schizom matous<br />
secretory ccavities<br />
in mmetaphloem<br />
m (Fig. 5).<br />
Fig. 3: Traansversal<br />
aand<br />
tangent tial sectionns<br />
of roots: general an natomy (A) ), magnific cation<br />
x40, and ddetailed<br />
strructure<br />
of secondary s pphloem<br />
(B) ), magnifica ation x200, , and secon ndary<br />
xylem, mmagnificationn<br />
x200 (C C) and x4000<br />
(D). Un nstained se ection (A) ), acid fuc chsin-<br />
malachite green stainning<br />
(B, D) and acridinne<br />
orange under u DAP PI filter (C) . Descriptio on A:<br />
1 – periderrm,<br />
2 – corrk<br />
cambium m, 3 – seconndary<br />
phloe em, 4 – schi izogenous ssecretory<br />
ca avity,<br />
5 – vascullar<br />
cambiuum,<br />
6 – sec condary xyylem,<br />
7 – ray parenc chyma; B: 1 – sieve tube-<br />
members, 2 – axial parenchym ma, 3 – raddial<br />
parench hyma - ray y; C: 1 – vvessel,<br />
2 – axial<br />
parenchymma,<br />
3 – libriiform;<br />
D: detail<br />
of pittted<br />
and scal lariform ve essels of seccondary<br />
xyl lem.<br />
- 20 -<br />
Brno
XI. Woorkshop<br />
of Physsical<br />
Chemists and a Electrochemmists´11<br />
Fig. 4: Transveersal<br />
sectio on of stem in primar ry state (A A), magnificcation<br />
x100,<br />
detailedd<br />
struccture<br />
of trichomes<br />
(B),<br />
magnificcation<br />
x400 0, structure e of the steem<br />
in secon ndary statee<br />
(C), magnificattion<br />
x40, an nd radial section<br />
of stem s in sec condary staate<br />
of thick kening (D), ,<br />
magnnification<br />
xx40.<br />
Acridi ine orange staining using u FITC (A) and TTexas<br />
Red (D) filters, ,<br />
unstaained<br />
section,<br />
autoflu uorescence – DAPI (B B) and FITC<br />
(C) filterr.<br />
Descript tion A: 1 –<br />
epideermis<br />
withh<br />
cuticle, 2 – colllenchymat<br />
tous hypodermis,<br />
3 – paren nchymatouss<br />
mesoodermis,<br />
4 – collatera al vascular bbundle<br />
- metaphloem<br />
m m, 5 – schizzogenous<br />
in ntercellularr<br />
cavitty<br />
with disstinct<br />
epith helial cells, 6 – vessel ls of metax xylem; B: 1 – base of f glandularr<br />
trichhome,<br />
2 – mmulticellula<br />
ar head; C: 1 – phellem m, 2 – cork k cambium with phell loderm, 3 –<br />
corteex,<br />
4 – secoondary<br />
phlo oem, 5 – scchizogenou<br />
us intercellu ular space, 6 – sclerifie ed primaryy<br />
phloem,<br />
7 – seccondary<br />
xyl lem, 8 – vaascular<br />
cam mbium; D. 1 – secondarry<br />
phloem, 2 – vessel, ,<br />
3 – rray<br />
parenchhyma<br />
– hete erocellular ray, 4 – libriform,<br />
5 –p primary xyylem,<br />
6 - pit th.<br />
- 21 -<br />
Brnoo
XI. Workshop oof<br />
Physical Cheemists<br />
and Electrochemists´11<br />
Fig. 5: Trransversal<br />
sections of f petiole (AA,<br />
B, C) and a leaf (D D): generaal<br />
anatomy y (A),<br />
magnificattion<br />
x40, detailed structure of vascula ar tissue with largee<br />
schizoge enous<br />
intercellullar<br />
cavity ( B), magnifi ication x2000,<br />
detail of f schizogen nous interceellular<br />
cavi ity in<br />
pith (C), magnificattion<br />
x400 and a transvversal<br />
section<br />
of leaf (D), magnnification<br />
x200.<br />
Autofluoreescence<br />
unnder<br />
DAPI I filter (A) ), unstaine ed section (B) and aacridine<br />
or range<br />
staining uunder<br />
FITCC<br />
filter (C C, D). Desccription<br />
A: A 1 – epid dermis witth<br />
cuticle, 2 –<br />
hypodermmis,<br />
3 – messodermis,<br />
4 – sclerifiedd<br />
primary phloem p wit th sclerifiedd<br />
interfasci icular<br />
parenchymma,<br />
5 – mettaphloem<br />
with w schizoogenous<br />
int tercellular cavity, c 6 – metaxylem m, 7 –<br />
pith, 8 – sschizogenoous<br />
intercel llular cavityy;<br />
B: 1 – schizogenou<br />
us intercelllular<br />
cavity y, 2 –<br />
epithelial cells, 3 – metaphloem,<br />
4 – rayy<br />
parenchy yma, 5 – sc clerified paarenchyma<br />
a, 6 –<br />
secondary phloem, 7 – vascula ar cambiumm,<br />
8 – sec condary xy ylem; C: 1 - schizoge enous<br />
intercellullar<br />
cavity, 2 – epithel lial cells; DD:<br />
1 – epid dermis, 2 – palisade pparenchyma<br />
a, 3 –<br />
spongy paarenchymaa,<br />
4 – epi idermis, 5 – primar ry xylem of vasculaar<br />
bundle, 6 -<br />
schizogenoous<br />
intercellular<br />
cavity,<br />
7 – primmary<br />
phloem m.<br />
4. CONNCLUSIONN<br />
Worrk<br />
demonstrated<br />
anato omy roots, stems and leaves of widely w cultiivated<br />
tree Rhus<br />
hirta (L.) Sudw. (synn.<br />
Rhus typ phina L.) byy<br />
the use of o methods s of light an and fluoresc cence<br />
microscoppy.<br />
Work shhows<br />
not on nly to the aanatomical<br />
structures of individuual<br />
plant or rgans,<br />
but also too<br />
the possibbility<br />
of usag ge of fluoreescence<br />
mic croscopy in n these typees<br />
of studies s.<br />
- 22 -<br />
Brno
XI. Workshop of Physical Chemists and Electrochemists´11 Brno<br />
5. ACKNOWLEDGEMENT<br />
The work has been supported by REMEDTECH GA ČR 522/10/P618 a FRVŠ<br />
2506/F4/2011/VFU.<br />
6. REFERENCES<br />
[1] Tingshuang, Y., et al., (2004): Phylogenetic and biogeographic diversification of Rhus<br />
(Anacardiaceae) in the Northern Hemisphere, Molecular Phylogenetics and Evolution, 33: 861-879<br />
[2] Lampe, K. F. (1986): Dermatitis-producing Anacardiaceae,of the Caribbean area, Clinics in<br />
Dermatology, 4: 171-182<br />
[3] Beaman, J. H. (1986): Allergenic Asian Anacardiaceae, Clinics in Dermatology, 4: 191-203<br />
[4] Hurtado, I. (1986): Poisonous Anacardiaceae,of South America, Clinics in Dermatology, 4: 183-190<br />
[5] Moyo, M., et al: Phenolic composition, antioxidant and acetylcholinesterase inhibitory activities of<br />
Sclerocarya birrea and Harpephyllum cafrum (Anacardiaceae), Food Chemistry, 123: 69-76<br />
- 23 -
XI. Workshop of Physical Chemists and Electrochemists´11 Brno<br />
ANATOMICAL STUDY OF VEGETATIVE<br />
ORGANS OF PHARMACEUTICALLY AND<br />
TOXICOLOGICALLY IMPORTANT PLANT<br />
ACONITUM NAPELLUS L. EM. SKALICKY<br />
(RANUNCULACEAE)<br />
Petr BABULA 1 , Simona KVAŠŇÁKOVÁ 1 , Vojtěch ADAM 2 , René KIZEK 2<br />
1 Department of Natural Drugs, Faculty of Pharmacy, University of Veterinary and Pharmaceutical Sciences<br />
Brno, Palackeho 1/3, CZ-61242 Brno, Czech Republic.<br />
2 Department of Chemistry and Biochemistry, Faculty of Agronomy, Mendel University, Zemedelska 1, CZ-<br />
61300 Brno, Czech Republic<br />
Abstract<br />
Aconitum napellus L. em. Skalicky (Ranunculaceae) is one of the most poisonous plant in<br />
Europe. In the Aconitum genus there are toxicologically important diterpene (C20) and<br />
nor-diterpene (C19) alkaloids represented mainly by aconitine presented in primarily in<br />
roots. However, species contains other chemical constituents, such as flavonol glycosides,<br />
which are in the focus of interest. Despite the well known toxicological aspects of this<br />
plant, anatomical study of individual vegetative organs is still missing. This study is<br />
focused on the demonstration of anatomy of vegetative organs – roots, stems and leaves –<br />
of Aconitum napellus L. em. Skalický using both methods of light and fluorescence<br />
microscopy.<br />
1. INTRODUCTION<br />
Aconitum napellus L. em. Skalický, “Monk´s hood” is a perennial herb 0.5 – 1.5 m in<br />
height with tuberous fleshy roots and erect stout stems with leaves dissected into 5-7<br />
segments, violet-blue flowers with helmet-shaped hood arranged in dense racemes and<br />
multiple fruit of follicles containing black triangular seeds. Plants are distributed mainly<br />
in Alps and other mountainous regions in Europe. Monk’s hood is considered to be one of<br />
the most poisonous plants in Europe, which toxicity is exceeded only by Indian Aconitum<br />
ferox Wall. used by as an arrow poison [1-3]. However, classification of members of<br />
Aconitum genus is very difficult due to genetic instability [4, 5]. Numerous studies have<br />
dealt with the diterpene (C20) and nor-diterpene (C19) alkaloids [6-8]. The main alkaloids<br />
of Aconitum napellus aggregate are aconitine, picroaconitine, isoaconitine, benzaconitine,<br />
aconine, neopelline, eoline, napelline, mesaconitine, and hypaconitinine (see Fig. 1).<br />
Symptoms of poisoning include burning and tingling in the mouth and also in the fingers<br />
and toes. After it, paraesthesia extends over the whole body, accompanied by bouts of<br />
sweating and shivering; this gradually changes to feelings of roughness, insensibility and<br />
ice coldness. This stage is followed by the vomiting, colicky diarrhea, paralysis of the<br />
- 24 -
XI. Woorkshop<br />
of Physsical<br />
Chemists and a Electrochemmists´11<br />
skeleetal<br />
muscullature<br />
and intense paiin.<br />
Death occurs o after r one hourrs<br />
through respiratoryy<br />
parallysis<br />
or heaart<br />
failure [3 3, 9-11].<br />
However, , some studies<br />
have demonstra ated also phenolic<br />
coonstituents,<br />
especiallyy<br />
flavoonol<br />
and hyydroxyphen<br />
netyl glycoosides<br />
with antioxidan nt propertiees<br />
[12-14]. Flavonoidss<br />
havee<br />
been fouund<br />
in some<br />
subspeecies<br />
of Aconitum A napellus n – A. napel llus subsp. .<br />
neommontanum<br />
(Wulfen) ) Bayer (flowers - querceti in 7-O-(66-trans-caff<br />
feoyl)-beta-<br />
glucoopyranosyll-(1,3)-alpha-rhamnoppyranoside-3-O-beta-g<br />
glucopyrannoside,<br />
kaem mpferol7- O-(66-trans-cafffeoyl)-beta-glucopyrannosyl-(1,3)-<br />
-alpha-rham mnopyranooside-3-O-b<br />
beta<br />
glucoopyranosidde<br />
and kae empferol 77-O-(6-tran<br />
ns-p-coumaroyl)-beta-glucopyran<br />
nosyl-(1,3)-<br />
alphaa-rhamnoppyranoside<br />
3-O-beta-gglucopyrano<br />
oside together t<br />
with beta-3,4-<br />
dihyydroxyphennethyl<br />
beta a-glucopyraanoside)<br />
an nd A. nape ellus subspp.<br />
tauricum m (Wulfen) )<br />
Bayeer,<br />
species distributed<br />
in Easteern<br />
Alps and a southe ern Carpatthians<br />
(3-O O-(6-trans-<br />
caffeeoyl)-beta-gglucopyranosyl-(1,2)-bbeta-glucop<br />
pyranoside-7-O-alphaa-rhamnopy<br />
yranoside,<br />
kaemmpferol<br />
3-O-(6-trans<br />
s-caffeoyl)-bbeta-glucop<br />
pyranosyl-( (1,2)-beta-gglucopyran<br />
noside-7-O-<br />
alphaa<br />
-rhamnoopyranosid<br />
de, quercettin<br />
3-O-(6 6-trans-p-co oumaroyl)-beta-gluco<br />
opyranosyl-<br />
(1,2) -beta-glucoopyranoside<br />
e-7-O-alphha-rhamnop<br />
pyranoside aand<br />
beta-3,4-<br />
dihyydroxyphennethyl<br />
beta-glucopyrannoside)<br />
[15 5, 16]. Flav vonoids havve<br />
been fou und also inn<br />
other<br />
members of Aconitu um genus [117].<br />
Fig.<br />
1: The most<br />
import tant diterppene<br />
alkalo oids of Aco onitum nap apellus aggr regate. 1 -<br />
napellinne,<br />
Fig. 2: aconitinne<br />
- (R<br />
hypacon<br />
1 = -<br />
nitine (R1 -CH2CH3, R<br />
= CH3, R2 R<br />
= H<br />
2 = -OH), mesakonit tine (R<br />
H)<br />
1 = --CH3,<br />
R2 = -OH) andd<br />
Plants of Aconitum genus are uused<br />
in tra aditional Ch hinese meddicine<br />
after processingg<br />
to ddecompose<br />
toxic alka aloids to the less toxic t deriv vatives andd<br />
for prep paration off<br />
hommeopathic<br />
prreparations<br />
s [18-20].<br />
2. EXPERIMMENT<br />
Plant maaterial<br />
(roo ots, stems, leaves) was w collecte ed in the botanical garden off<br />
Univversity<br />
of VVeterinary<br />
and a Pharmmaceutical<br />
University U Brno. For tthe<br />
anatom mical study, ,<br />
transsversal,<br />
raddial<br />
and tan ngential hannd-made<br />
se ections wer re used. Foor<br />
the visua alization off<br />
ligniified<br />
plant ttissues,<br />
ethanolic<br />
(50 % %, v/v) mix xture of acid<br />
fuchsinee<br />
and malac chite greenn<br />
(bothh<br />
1%, w/ww;<br />
Sigma-Al ldrich, USAA)<br />
was use ed. Sections s were stainned<br />
for fou ur minutess<br />
and aafter<br />
it wasshed<br />
with acidic a ethannol<br />
(60 %, v/v, v with 37 7% hydrochhloric<br />
acid 0.1 %, v/v, ,<br />
- 25 -<br />
Brnoo
XI. Workshop oof<br />
Physical Cheemists<br />
and Electrochemists´11<br />
Sigma-Alddrich,<br />
USAA).<br />
At once e, sections, , which were w not st tained, werre<br />
prepared<br />
for<br />
fluorescennce<br />
microsccopic<br />
analysis<br />
(Carl Zeeiss<br />
Axiosc cop 40, Zeiss,<br />
Germanny).<br />
In addition,<br />
sections wwere<br />
stainedd<br />
by aqueo ous solutionn<br />
of acridin ne orange (1 ( %, w/w, Sigma-Ald drich,<br />
USA).<br />
3. RESSULTS<br />
ANND<br />
DISCU USSION<br />
Usinng<br />
acid fuchsine<br />
– malachite m grreen<br />
stainin ng, individ dual anatommical<br />
struc ctures<br />
were welll<br />
distinguisshable.<br />
Wh hereas stemms<br />
were ob bserved onl ly in the pprimary<br />
sta ate of<br />
growth duue<br />
to absennce<br />
of vascu ular cambiuum,<br />
roots were w observ ved only inn<br />
the secon ndary<br />
state. Basicc<br />
stem struucture<br />
is ba ased on the eustele. In n compariso on with thee<br />
youngest stem<br />
parts anatoomy,<br />
anatoomy<br />
of olde er stem partts<br />
is based on o the scler rification oof<br />
interfasci icular<br />
parenchymma<br />
and pericycle<br />
under<br />
formattion<br />
of ver ry mechan nically hardd<br />
structure es. In<br />
addition, aanatomy<br />
of<br />
tuber wa as describedd.<br />
Its anato omical stru ucture is abbnormal<br />
du ue to<br />
absence off<br />
formationn<br />
of cork cam mbium, whhich<br />
produc ces seconda ary dermal ttissue<br />
perid derm.<br />
Rhizodermmis<br />
is replaaced<br />
by the e outer parrt<br />
of cortex x. Secondar ry thickeniing<br />
of roots s and<br />
tubers is bbased<br />
on thhe<br />
activity of o vascular cambium, which produces<br />
especcially<br />
secon ndary<br />
phloem wwith<br />
predoominant<br />
ph hloem pareenchyma<br />
with w stora age functioon.<br />
Sieve tube-<br />
members ooccur<br />
in smmall<br />
groups interdisperrsed<br />
in phlo oem parenc chyma. Leavves<br />
are typi ically<br />
bifacial wwith<br />
leaf mmesophyll<br />
differentiaated<br />
into palisade and a sponggy<br />
parench hyma.<br />
Anatomicaal<br />
structurre<br />
of petio ole is simiilar<br />
to ana atomy of stem; s howwever,<br />
extensive<br />
intercellullar<br />
space att<br />
the cente er is well oobservable.<br />
Individual l details arre<br />
introduced<br />
in<br />
Fig. 2 (anaatomy<br />
of root),<br />
Fig. 3 (anatomyy<br />
of tuber), Fig. 4 (anatomy<br />
of sstem)<br />
and Fig. F 5<br />
(anatomy of leaf).<br />
A<br />
C<br />
- 26 -<br />
B<br />
D<br />
Brno
XI. Woorkshop<br />
of Physsical<br />
Chemists and a Electrochemmists´11<br />
Fig. 2: Transveersal<br />
sections<br />
of rootss:<br />
general anatomy ( A, B), maggnification<br />
x100, andd<br />
detaiiled<br />
structuure<br />
of end dodermis aand<br />
vascul lar cylinde er (C, D), magnifica ation x200. .<br />
Unsttained<br />
sectiion<br />
(A), acr ridine orannge<br />
staining g using FIT TC filter (B) ) and Texas s Red filterr<br />
(D) aand<br />
autofluuorescence<br />
of unstainned<br />
section under FIT TC filter (CC).<br />
Descript tion A: a –<br />
rhizoodermis,<br />
b – exoderm mis, c – meesodermis,<br />
d – endode ermis with Casparian strips, e –<br />
periccycle,<br />
f – vvascular<br />
ca ambium, g – secondary<br />
phloem,<br />
h – seconndary<br />
xyle em, i – rayy<br />
parennchyma;<br />
j – primary xylem; x B: a – mesoder rmis, b – en ndodermis wwith<br />
Caspa arian strips, ,<br />
c – ppericycle,<br />
d – secondar ry phloem - groups of f sieve-tube e-members in axial pa arenchyma, ,<br />
e – pprimary<br />
xyllem,<br />
f – secondary<br />
xyllem,<br />
g – ray y parenchym ma containning<br />
starch grains; g C: a<br />
– enddodermis<br />
wwith<br />
Caspar rian strips, b – pericyc cle, c – pass sage cell, d – secondary<br />
phloem, ,<br />
e – vvascular<br />
cambium,<br />
f – secondaryy<br />
xylem, g – primary xylem; D. . a – mesod dermis, b –<br />
endoodermis,<br />
c – pericycle e, d – seconndary<br />
phlo oem, e – va ascular cammbium,<br />
f – secondaryy<br />
xylemm<br />
(vessel), g – primary y xylem, h – ray paren nchyma.<br />
A<br />
C<br />
Fig. 3: Transveersal<br />
sectio ons of tubeers:<br />
genera al anatomy y (A), maggnification<br />
x100, andd<br />
detaiiled<br />
structuure<br />
of corte ex and outter<br />
part of vascular cy ylinder (B) , magnifica ation x200, ,<br />
sievee-tube-memmbers<br />
(C), magnificaation<br />
x400 0, and secondary<br />
vvascular<br />
ti issues (D), ,<br />
magnnification<br />
xx400.<br />
Acrid dine orangee<br />
staining using u FITC (A, B) andd<br />
DAPI filte ers (D) andd<br />
acid fuchsin – mmalachite<br />
green g stainiing.<br />
Descrip ption A: a – groups off<br />
sieve tube e-members, ,<br />
b – aaxiall<br />
parennchyma<br />
con ntaining staarch<br />
grains, c – primar ry xylem, d – secondar ry xylem, e<br />
– vasscular<br />
cambbium,<br />
f – pith p containning<br />
starch grains; B: a – mesodeermis,<br />
b – endodermis e s<br />
withh<br />
Caspariann<br />
strips, c – pericycle, , d – secon ndary phloe em; C: a – groups of sieve s tube-<br />
- 27 -<br />
B<br />
D<br />
Brnoo
XI. Workshop oof<br />
Physical Cheemists<br />
and Electrochemists´11<br />
members, b – axiall<br />
parenchy yma; D. a – groups of sieve tube-membbers,<br />
b – axial<br />
parenchymma,<br />
c – initiials<br />
of vascu ular cambiuum,<br />
d – ray y parenchym ma, e –seconndary<br />
xylem.<br />
A<br />
Fig. 4: Traansversal<br />
sections<br />
of st tem: generaal<br />
anatomy (A), magni ification x100,<br />
and det tailed<br />
structure oof<br />
epidermmis<br />
and out ter part of cortex (B) , magnifica ation x200. . In compa arison<br />
with abovve-mentioned<br />
staining g, combinedd<br />
staining (safranine, gentian vi violet, orang ge G,<br />
brilliant green<br />
and cchrysoidine)<br />
(A) and cchrysoidine<br />
e staining (B) ( were ussed.<br />
Description<br />
A: a – epiidermis<br />
witth<br />
cuticle, b – hypodermis,<br />
c – mesodermis,<br />
d – enddodermis<br />
(s starch<br />
sheath), e – pericyccle,<br />
f – vascular<br />
bunndle<br />
– collateral,<br />
g – pith, h – interfasci icular<br />
parenchymma;<br />
B: a – cuuticle,<br />
b – epidermis, e c – hypode ermis - colle enchyma, d –sclerench hyma<br />
cells with plasmodessmata,<br />
e – mesodermiis<br />
– parenc chyma, f – pericycle, g – endode ermis<br />
(starch sheeath);<br />
- 28 -<br />
B<br />
Brno
XI. Woorkshop<br />
of Physsical<br />
Chemists and a Electrochemmists´11<br />
A<br />
C<br />
Fig. 3: Transveersal<br />
sectio ons of petiole<br />
(A) an nd lamina (B – D): ggeneral<br />
ana atomy (A), ,<br />
magnnification<br />
xx100<br />
and x2 200 (B, C), aand<br />
detailed<br />
structure lamina (D) ), magnification<br />
x200. .<br />
Acriddine<br />
orangge<br />
staining using FITCC<br />
(A, C) an nd DAPI fi ilters (B, DD).<br />
Descript tion A: a –<br />
epideermis,<br />
b – cuticle, c – hypoderrmis,<br />
d – ground g tissu ue - parencchyma,<br />
e – sclerifiedd<br />
interrfascicular<br />
pparenchym<br />
ma, f – scleri rified protop phloem, g – metaphlooem,<br />
h – me etaxylem, i<br />
– prootoxylem,<br />
j – central cavity – iintercellula<br />
ar space; B: a – cuticlle,<br />
b – epid dermis, c –<br />
palissade<br />
parencchyma,<br />
d – epidermiss,<br />
e – inter rcellular spa aces of spoongy<br />
parenchyma,<br />
f –<br />
sponngy<br />
parenchhyma<br />
cells; C: a – guarrd<br />
cells, b – spongy pa arenchyma cells, c – ep pidermis, d<br />
– coollateral<br />
vaascular<br />
bun ndle, e – pparenchym<br />
ma cells sur rrounding vascular bundle, b f –<br />
epideermis<br />
withh<br />
cuticle, g – palisadde<br />
parench hyma; D. a – palisadde<br />
parench hyma, b –<br />
epideermis,<br />
c – collateral vascular bbundle,<br />
d – parenchy yma cells surroundin ng vascularr<br />
bunddle,<br />
e – sppongy<br />
pare enchyma, f – epider rmis, g – intercellullar<br />
spaces of spongyy<br />
parennchyma,<br />
h – mechanical<br />
tissue – collenchym ma, I - epid dermis.<br />
4. CONCLUUSION<br />
Work deemonstrated<br />
d anatomyy<br />
roots, ste ems and le eaves of ppharmaceut<br />
tically andd<br />
toxiccologically<br />
important plant Aconnitum<br />
nape ellus L. em. Skalický (RRanunculac<br />
aceae) usingg<br />
methhods<br />
of lighht<br />
and fluo orescence mmicroscopy<br />
y. Work sho ows not onnly<br />
to the anatomicall<br />
strucctures<br />
of inndividual<br />
plant<br />
organss,<br />
but also to the possibility<br />
of uusage<br />
of flu uorescencee<br />
micrroscopy<br />
in tthese<br />
types of studies.<br />
5. ACKNOWWLEDGEM<br />
MENT<br />
The workk<br />
has been n supporteed<br />
by REM MEDTECH GA ČR 5522/10/P61<br />
18 a FRVŠŠ<br />
25066/F4/2011/VVFU<br />
- 29 -<br />
B<br />
D<br />
Brnoo
XI. Workshop of Physical Chemists and Electrochemists´11 Brno<br />
6. REFERENCES<br />
1. Feldkamp, A.; Koster, B.; Weber, H. P., Fatal Poisoning by Monks-Hood (Aconitum-Napellus).<br />
Mon.schr. Kinderheilkd. 1991, 139, (6), 366-367.<br />
2. Haas, C., Monk's hood, Aconitum napellus, poison and medecine. Ann. Med. Interne 1999, 150, (5),<br />
446-447.<br />
3. Pullela, R.; Young, L.; Gallagher, B.; Avis, S. P.; Randell, E. W., A case of fatal aconitine poisoning by<br />
monkshood ingestion. J. Forensic Sci. 2008, 53, (2), 491-494.<br />
4. Mitka, J., Phenetic and geographic pattern of Aconitum sect. napellus (Ranunculaceae) in the Eastern<br />
Carpathians - A numerical approach. Acta Soc. Bot. Pol. 2002, 71, (1), 35-48.<br />
5. Le Cadre, S.; Boisselier-Dubayle, M. C.; Lambourdiere, J.; Machon, N.; Moret, J.; Samadi, S.,<br />
Polymorphic microsatellites for the study of Aconitum napellus L. (Ranunculaceae), a rare species in<br />
France. Mol. Ecol. Notes 2005, 5, (2), 358-360.<br />
6. Chen, Y.; Koelliker, S.; Oehme, M.; Katz, A., Isolation of diterpenoid alkaloids from herb and flowers<br />
of Aconitum napellus ssp vulgare and electrospray ion trap multiple MS study of these alkaloids. J.<br />
Nat. Prod. 1999, 62, (5), 701-704.<br />
7. Csupor, D.; Forgo, P.; Csedo, K.; Hohmann, J., C-19 and C-20 diterpene alkaloids from Aconitum<br />
toxicum RCHB. Helv. Chim. Acta 2006, 89, (12), 2981-2986.<br />
8. Forgo, P.; Borcsa, B.; Csupor, D.; Fodor, L.; Robert, B.; Molnar, A. V.; Hohmann, J., Diterpene<br />
Alkaloids from Aconitum anthora and Assessment of the hERG-Inhibiting Ability of Aconitum<br />
Alkaloids. Planta Med. 2011, 77, (4), 368-373.<br />
9. Weijters, B. J.; Verbunt, R.; Hoogsteen, J.; Visser, R. F., Salade malade: malignant ventricular<br />
arrhythmias due to an accidental intoxication with Aconitum napellus. Neth. Heart J. 2008, 16, (3),<br />
96-+.<br />
10. Chan, T. Y. K., Aconite poisoning. Clin. Toxicol. 2009, 47, (4), 279-285.<br />
11. Strzelecki, A.; Pichon, N.; Gaulier, J. M.; Amiel, J. B.; Champy, P.; Clavel, M., Acute Toxic Herbal<br />
Intake in a Suicide Attempt and Fatal Refractory Ventricular Arrhythmia. Basic Clin. Pharmacol.<br />
Toxicol. 2010, 107, (2), 698-699.<br />
12. Braca, A.; Fico, G.; Morelli, I.; De Simone, F.; Tome, F.; De Tommasi, N., Antioxidant and free radical<br />
scavenging activity of flavonol glycosides from different Aconitum species. J. Ethnopharmacol. 2003,<br />
86, (1), 63-67.<br />
13. Diaz, J. G.; Ruiz, J. G.; Dias, B. R.; Sazatornil, J. A. G.; Herz, W., Flavonol 3,7-glycosides and<br />
dihydroxyphenethyl glycosides from Aconitum napellus subsp lusitanicum. Biochem. Syst. Ecol.<br />
2005, 33, (2), 201-205.<br />
14. Luis, J. C.; Valdes, F.; Martin, R.; Carmona, A. J.; Diaz, J. G., DPPH radical scavenging activity of two<br />
flavonol glycosides from Aconitum napellus sp lusitanicum. Fitoterapia 2006, 77, (6), 469-471.<br />
15. Fico, G.; Braca, A.; De Tommasi, N.; Tome, F.; Morelli, I., Flavonoids from Aconitum napellus subsp<br />
neomontanum. Phytochemistry 2001, 57, (4), 543-546.<br />
16. Fico, G.; Braca, A.; Bilia, A. R.; Tome, F.; Morelli, I., New flavonol glycosides from the flowers of<br />
Aconitum napellus ssp tauricum. Planta Med. 2001, 67, (3), 287-290.<br />
17. Vitalini, S.; Braca, A.; Passarella, D.; Fico, G., New flavonol glycosides from Aconitum burnatii Gayer<br />
and Aconitum variegatum L. Fitoterapia 2010, 81, (7), 940-947.<br />
18. Singhuber, J.; Zhu, M.; Prinz, S.; Kopp, B., Aconitum in Traditional Chinese Medicine-A valuable<br />
drug or an unpredictable risk? J. Ethnopharmacol. 2009, 126, (1), 18-30.<br />
19. Piltan, D.; Rist, L.; Simoes-Wust, A. P.; Saller, R., Test of a Homeopathic Dilution of Aconitum<br />
napellus A Clinical, Randomized, Double-Blind, Controlled Crossover Study in Healthy Volunteers.<br />
Forsch. Komplement.med. 2009, 16, (3), 168-173.<br />
20. Thurneysen, A., On: Piltan D, Rist L, Simoes-Wust A, Saller R: Test of a homeopathic dilution of<br />
Aconitum napellus. A clinical, randomized, double-blind, controlled crossover study in healthy<br />
volunteers. Forsch Komplementmed 2009;16:168-173. Forsch. Komplement.med. 2009, 16, (5), 349-<br />
349.<br />
- 30 -
XI. Workshop of Physical Chemists and Electrochemists´11 Brno<br />
ANATOMICAL STUDY OF<br />
PHARMACEUTICALLY IMPORTANT PLANT<br />
MACLURA POMIFERA (RAF.) C.K. SCHNEID.<br />
(MORACEAE)<br />
Petr BABULA 1 , Jana TKADLEČKOVÁ 1 , Vojtěch ADAM 2 , René KIZEK 2<br />
1 Department of Natural Drugs, Faculty of Pharmacy, University of Veterinary and Pharmaceutical Sciences<br />
Brno, Palackeho 1/3, CZ-61242 Brno, Czech Republic.<br />
2 Department of Chemistry and Biochemistry, Faculty of Agronomy, Mendel University, Zemedelska 1, CZ-<br />
61300 Brno, Czech Republic<br />
Abstract<br />
Maclura pomifera (Raf.) C.K.Schneid. (Moraceae), “Osage orange”, is the tree native to the<br />
mid-western and south-eastern United States. Plant contains many different secondary<br />
metabolites with interesting pharmaceutical properties, such as flavonoids, isoflavonoids,<br />
triterpenes, xanthones and stilbenes. Despite the fact that plant is in the focus of interest<br />
due to above-mentioned compounds, anatomical study of this plant is still missing. This<br />
study is focused on the demonstration of anatomy of vegetative organs – roots, stems and<br />
leaves – of Maclura pomifera.<br />
1. INTRODUCTION<br />
Maclura pomifera (Raf.) C.K.Schneid. (Moraceae), “Osage orange”, is a very common<br />
tree native to the mid-western and south-eastern United States, however, species has been<br />
introduced into many countries including Czech Republic. The types of secondary<br />
metabolites isolated from different parts of Osage orange belong to the different classes,<br />
such as flavonoids and isoflavonoids (especially prenylated), xanthones, stilbenes and<br />
triterpenes. Many phytochemical studies are focused on the multiple fruits due to<br />
presence of pharmacologically interesting isoflavonoids osajin and pomiferin [1].<br />
Pomiferin is studied as a potent histone deacetylase inhibitor [2]. However,<br />
pharmacologically active secondary metabolites have been detected also in other plant<br />
parts. Xanthones (osajaxanthone, alvaxanthone, macluraxanthone, 8prenyltoxyloxanthone)<br />
and flavanones (euchrestaflavanone B and euchrestaflavanone C)<br />
have been found in bark of Osage orange [3]. Stilbenes (such as oxyresveratrol) have been<br />
found in heartwood [4].<br />
Type of compound Plant part Pharmacological properties Citation<br />
Prenylated isoflavones –<br />
pomiferin, osajin<br />
Multiple<br />
fruits<br />
Histone deacetylase inhibitor<br />
(pomiferin)<br />
Antioxidant properties<br />
Cytotoxic properties<br />
Prenylated isoflavones – Multiple Anti-inflammatory and [8]<br />
- 31 -<br />
[2]<br />
[1]<br />
[5]<br />
[6]<br />
[7]
XI. Workshop of Physical Chemists and Electrochemists´11 Brno<br />
scandenone, auriculasin fruits antinociceptive activity<br />
Prenylated flavones Leaves,<br />
stems<br />
Antioxidant properties [9]<br />
Xanthones - Root bark Antimicrobial, anti- [3]<br />
osajaxanthone,<br />
alvaxant-hone,<br />
inflammatory, antidepressive [10]<br />
macluraxanthone, 8prenyltoxyloxanthone<br />
Flavanones - Root bark Antioxidant properties [3]<br />
euchrestaflavanone B<br />
and euchrestaflavanone<br />
C<br />
Stilbenes<br />
oxyresveratrol<br />
- Heartwood Antioxidant properties [4]<br />
Aliphatic compouds, Multiple - [11]<br />
especially alcohols fruits<br />
Phenylpropane Multiple - [11]<br />
derivates<br />
fruits<br />
Monoterpenes and Multiple - [11]<br />
sesquiterpenes<br />
different types<br />
– fruits<br />
Triterpenes/Phytosterols seeds Antioxidant together with [12]<br />
– beta-sitosterol,<br />
tocopherols detected in seeds [13]<br />
campesterol,<br />
stigmasterol, lupeol,<br />
Proteins –<br />
seeds Protease inhibitor [14]<br />
MPI<br />
Serine proteinase<br />
[15]<br />
Tab. 1: The most important chemical constituents isolated from different parts of Maclura<br />
pomifera<br />
Both flavonoids and xanthones demonstrate interesting properties – antioxidant,<br />
antimicrobial, antifungal, antitumoral and antidepressive properties have been<br />
determined. The most important compounds isolated from Maclura pomifera are<br />
summarized in Tab. 1 chemical formulas are introduced in Fig. 1.<br />
- 32 -
XI. Workshop of Physical Chemists and Electrochemists´11 Brno<br />
A B C<br />
O O<br />
O O<br />
OH<br />
O<br />
OH<br />
D E F<br />
O<br />
OH<br />
O<br />
O<br />
OH<br />
OH<br />
O<br />
OH<br />
OH<br />
Fig. 1: The most important chemical constituents of Maclura pomifera. Osajin (A),<br />
pomiferin (B), scandenone (C), auriculasin (D), alvaxanthone (E) and 8prenyltoxiloxanthon<br />
(F)<br />
Family Moraceae consists of shrubs, trees and woody wines with lactifers containing<br />
milky latex. Some species are important for “fruits”, respectively multiple fruits – figs<br />
(Ficus carica), mulberry (Morus spp.), and bread-fruit (Artocarpus faltitis). Members of<br />
genus Ficus are studied because potential pharmacological usage [16, 17]. Some plants are<br />
important as ornamental, widely cultivated plants (Ficus benjamina). Some plants are<br />
poisonous. Antiaris toxicaria, plant native to Australia, Asian countries and some African<br />
countries, such as Uganda or Sudan, is used for hunting. The latex contains cardiac<br />
glycosides, such as antiarin, antiarosides and antiarotoxin [18, 19]. Latex is used as an<br />
arrow poison called upas. Despite above-mentioned facts, knowledge about anatomy of<br />
these plants is still missing. Submitted work is focused on the anatomical study of<br />
vegetative organs Maclura pomifera (Raf.) C.K.Schneid.<br />
2. EXPERIMENT<br />
Plant material (roots, stems, leaves) was collected in the botanical garden of<br />
University of Veterinary and Pharmaceutical University Brno. For the anatomical study,<br />
transversal, radial and tangential hand-made sections were used. For the visualization of<br />
lignified plant tissues, ethanolic (50 %, v/v) mixture of acid fuchsine and malachite green<br />
(both 1%, w/w; Sigma-Aldrich, USA) was used. Sections were stained for four minutes<br />
and after it washed with acidic ethanol (60 %, v/v, with 37% hydrochloric acid 0.1 %, v/v,<br />
Sigma-Aldrich, USA). At once, sections, which were not stained, were prepared for<br />
fluorescence microscopic analysis (Carl Zeiss Axioscop 40, Zeiss, Germany). In addition,<br />
sections were stained by aqueous solution of acridine orange (1 %, w/w, Sigma-Aldrich,<br />
USA).<br />
O<br />
O<br />
O<br />
- 33 -<br />
OH<br />
OH<br />
OH<br />
OH<br />
O<br />
O<br />
OH<br />
O<br />
O<br />
O<br />
O<br />
OH<br />
OH<br />
OH
XI. Workshop oof<br />
Physical Cheemists<br />
and Electrochemists´11<br />
3. RESSULTS<br />
ANND<br />
DISCU USSION<br />
Usinng<br />
acid fuchsine<br />
– malachite m grreen<br />
stainin ng, individ dual anatommical<br />
struc ctures<br />
were welll<br />
distinguisshable.<br />
Stem ms and rooots<br />
were observed<br />
on nly in the secondary state<br />
because off<br />
the very rapid form mation of vvascular<br />
cam mbium and d productioon<br />
of secon ndary<br />
vascular tissues – secondary y phloem and sec condary xy ylem. Diffferentiation<br />
n of<br />
sclerenchyyma<br />
fibers in seconda ary phloemm<br />
was obser rved in bot th stems annd<br />
roots. In n the<br />
comparisoon<br />
of the sttructure<br />
of secondary y xylem of roots and stems, s secoondary<br />
xyle em of<br />
stems conntains<br />
highher<br />
rate of o libriformm,<br />
which is respons sible for tthe<br />
mecha anical<br />
properties.<br />
Lactifers wwere<br />
obser rved especiaally<br />
in the cortex of the t stem. GGeneral<br />
ana atomy<br />
is describeed<br />
in under-mentione<br />
ed figures ( (Fig. 2 – an natomy of root, Fig. 3 – anatom my of<br />
stem, Fig. 4 – anatommy<br />
of petiole e and laminna).<br />
A<br />
C<br />
Fig. 2: Trransversal<br />
ssections<br />
of f roots: genneral<br />
anato omy (A, B),<br />
magnificcation<br />
x40,<br />
and<br />
detailed sttructure<br />
of secondary phloem (CC)<br />
and secon ndary xylem m (D), maggnification<br />
x200.<br />
Acid fuchssine<br />
– malaachite<br />
gree en staining (A, C, D), acridine orange o stainning<br />
using FITC<br />
filter (B). DDescriptionn<br />
A, B: 1 – secondary s ddermal<br />
tissu ue periderm m, 2 – seconndary<br />
phloe em, 3<br />
– secondarry<br />
xylem, 4 – cork cam mbium, 5 – vascular cambium, c 6 – ray pareenchyma<br />
(ra ay), 7<br />
– vessel, 8 – sclerencchyma<br />
fiber rs of seconddary<br />
phloem m, 9 – grou ups of sievee-tube<br />
mem mbers;<br />
C: 1 – rayy<br />
parenchymma,<br />
2 – sie eve-tube mmembers,<br />
3 – groups of o sclerenchhyma<br />
fibers s, 4 –<br />
axial pareenchyma;<br />
DD:<br />
1 – ra ay parenchhyma<br />
(hete erocellular) ), 2 – axiial<br />
parench hyma<br />
associated with vesseel,<br />
3 – vessel,<br />
4 – groupps<br />
of librifo orm fibers.<br />
- 34 -<br />
B<br />
D<br />
Brno
XI. Woorkshop<br />
of Physsical<br />
Chemists and a Electrochemmists´11<br />
A<br />
C<br />
Fig. 3: Transverrsal<br />
(A, B) and radial (C, D) sect tions of stem ms. Magniffication<br />
x40 0 (A), x1000<br />
(B, DD)<br />
and x2000<br />
(C). Aci id fuchsinee<br />
– malachite<br />
green staining s (AA,<br />
C), acridine<br />
orangee<br />
stainning<br />
using FFITC<br />
filter (B, ( D). Desccription<br />
A: 1 – epiderm mis with cuuticle,<br />
2 – periderm, p 3<br />
– corrtex,<br />
4 – coortex<br />
with lactifers inncluding<br />
pr rimary phlo oem, 5 – seecondary<br />
phloem,<br />
6 –<br />
vascuular<br />
cambiium,<br />
7 – secondary xylem, 8 – primar ry xylem, 9 – pith, 10 – rayy<br />
parennchyma,<br />
111<br />
– vessel, 12 1 – sclerifi fied primary y phloem; B: B 1 - epideermis<br />
with cuticle, 2 –<br />
phelllem,<br />
3 – cork camb bium, 4 – hypoderm mis, 5 – mesodermis m s with lactifers,<br />
6 –<br />
protoophloem,<br />
7 – sclerif fied metapphloem/the<br />
e oldest pa art of secoondary<br />
phloem,<br />
8 –<br />
seconndary<br />
phlooem,<br />
9 – va ascular cammbium,<br />
10 – secondar ry xylem; C: detail of o cortex, 1<br />
indiccates<br />
drusees<br />
of calciu um oxalate in hypode ermis; D: 1 – epidermmis<br />
with cuticle, c 2 –<br />
phelllem,<br />
3 – ccork<br />
cambiu um, 4 – phhelloderm,<br />
5 – cortex x, 6 –innerr<br />
part of cortex<br />
withh<br />
lactiffers,<br />
7 – scllerified<br />
prim mary phloeem,<br />
8 – seco ondary phlo oem, 9 – vaascular<br />
cam mbium, 10 –<br />
seconndary<br />
xylemm,<br />
11 – ray y parenchymma,<br />
12 – scl lerenchyma a fibers of pprotophloem<br />
m.<br />
- 35 -<br />
B<br />
D<br />
Brnoo
XI. Workshop oof<br />
Physical Cheemists<br />
and Electrochemists´11<br />
A<br />
C<br />
Fig. 4: Traansversal<br />
seections<br />
of petiole (A, , B) and la amina (C, D). D Magnifi fication x40 0 (A),<br />
x100 (B, CC)<br />
and x2000<br />
(D). Acrid dine orangee<br />
staining using u FITC filter (B), TTexas<br />
Red filter<br />
(A, D) andd<br />
DAPI filtter<br />
(C). Des scription AA:<br />
1 – epide ermis with cuticle, 2 – hypoderm mis as<br />
mechanicaal<br />
tissue, 3 – ground tissue/paren t nchyma, 4 – protophloem,<br />
5 – mmetaphloem<br />
m, 6 –<br />
metaxylemm,<br />
7 – prottoxylem;<br />
B: B 1 – detaail<br />
of tricho ome; C: 1 – epidermmis,<br />
2 – pal lisade<br />
parenchymma,<br />
3 – spoongy<br />
parenc chyma withh<br />
intercellu ular spaces, , 4 –epidermmis;<br />
D: det tail of<br />
stomata – 1 – guard ccells.<br />
4. CONNCLUSIONN<br />
Worrk<br />
demonstrated<br />
anato omy roots, stems and leaves of pharmaceutiically<br />
impo ortant<br />
plant Macclura<br />
pomi mifera (Raf.) ) C.K.Schnneid.<br />
(Mor raceae) usin ng methodds<br />
of light t and<br />
fluorescennce<br />
microsccopy.<br />
Work k shows nott<br />
only to th he anatomic cal structurres<br />
of indiv vidual<br />
plant orgaans,<br />
but alsoo<br />
to the pos ssibility of usage of flu uorescence microscoppy<br />
in these types<br />
of studies.<br />
5. ACKKNOWLEDDGEMENT<br />
T<br />
The work has been sup pported by REMEDT TECH GA ČR 522/100/P618<br />
a FRVŠ F<br />
2506/F4/20011/VFU<br />
6. REFFERENCESS<br />
1. Diopaan,<br />
V.; Babulaa,<br />
P.; Shestivs ska, V.; Adamm,<br />
V.; Zemlick ka, M.; Dvorska,<br />
M.; Hubaalek,<br />
J.; Trnko ova, L.;<br />
Havell,<br />
L.; Kizek, R., Electroch hemical and sspectrometric<br />
c study of an ntioxidant acttivity<br />
of pom miferin,<br />
isopommiferin,<br />
osajiin<br />
and catalpo oside. J. Pharmm.<br />
Biomed. Anal. A 2008, 48 8, (1), 127-1333.<br />
2. Son, II.<br />
H.; Chung, I. M.; Lee, S.<br />
I.; Yang, H. D.; Moon, H. H I., Pomiferi in, histone deeacetylase<br />
inh hibitor<br />
isolateed<br />
from the ffruits<br />
of Maclu ura pomifera. . Bioorg. Med d. Chem. Lett t. 2007, 17, (177),<br />
4753-4755 5.<br />
- 36 -<br />
B<br />
D<br />
Brno
XI. Workshop of Physical Chemists and Electrochemists´11 Brno<br />
3. Teixeira, D. M.; da Costa, C. T., Novel methods to extract flavanones and xanthones from the root<br />
bark of Maclura pomifera. J. Chromatogr. A 2005, 1062, (2), 175-181.<br />
4. Djapic, N.; Djarmati, Z.; Filip, S.; Jankov, R. M., A stilbene from the heartwood of Maclura pomifera.<br />
J. Serb. Chem. Soc. 2003, 68, (3), 235-237.<br />
5. Hamed, S. F.; Hussein, A. A., Effect of Maclura pomifera total acetonic extract, pomiferin and osajin<br />
on the autooxidation of purified sunflower triacylglycerols. Grasas Aceites 2005, 56, (1), 21-24.<br />
6. Tsao, R.; Yang, R.; Young, J. C., Antioxidant isoflavones in Osage orange, Maclura pomifera (Raf.)<br />
Schneid. J. Agric. Food Chem. 2003, 51, (22), 6445-6451.<br />
7. Huang, T. T.; Liu, F. G.; Wei, C. F.; Lu, C. C.; Chen, C. C.; Lin, H. C.; Ojcius, D. M.; Lai, H. C.,<br />
Activation of Multiple Apoptotic Pathways in Human Nasopharyngeal Carcinoma Cells by the<br />
Prenylated Isoflavone, Osajin. PLoS One 2011, 6, (4).<br />
8. Kupeli, E.; Orhan, I.; Toker, G.; Yesilada, E., Anti-inflammatory and antinociceptive potential of<br />
Maclura pomifera (Rafin.) Schneider fruit extracts and its major isoflavonoids, scandenone and<br />
auriculasin. J. Ethnopharmacol. 2006, 107, (2), 169-174.<br />
9. Lee, S. J.; Wood, A. R.; Maier, C. G. A.; Dixon, R. A.; Mabry, T. J., Prenylated flavonoids from<br />
Maclura pomifera. Phytochemistry 1998, 49, (8), 2573-2577.<br />
10. da Costa, C. T.; Dalluge, J. J.; Margolis, S. A.; Horton, D., Liquid chromatography atmosphericpressure<br />
chemical-ionization mass spectrometry (LC-APCI-MS) of C-glycosylxanthones from the root<br />
bark of the Osage orange (Maclura pomifera) tree. Abstr. Pap. Am. Chem. Soc. 1999, 217, 015-CARB.<br />
11. Jerkovic, I.; Mastelic, J.; Marijanovic, Z., Bound volatile compounds and essential oil from the fruit of<br />
Maclura pomifera (Raf.) Schneid. (osage orange). Flavour Frag. J. 2007, 22, (1), 84-88.<br />
12. Lee, S. J.; Ahmed, A. A.; Wood, A.; Mabry, T. J., New lupane triterpene fatty acid ester from leaves of<br />
Maclura pomifera. Nat. Prod. Lett. 1997, 10, (4), 313-317.<br />
13. Saloua, F.; Eddine, N. I.; Hedi, Z., Chemical composition and profile characteristics of Osage orange<br />
Maclura pomifera (Rafin.) Schneider seed and seed oil. Ind. Crop. Prod. 2009, 29, (1), 1-8.<br />
14. Lazza, C. M.; Trejo, S. A.; Obregon, W. D.; Pistaccio, L. G.; Caffini, N. O.; Lopez, L. M. I., A Novel<br />
Trypsin and alpha-Chymotrypsin Inhibitor from Maclura pomifera Seeds. Lett. Drug Des. Discov.<br />
2010, 7, (4), 244-249.<br />
15. Rudenskaya, G. N.; Bogdanova, E. A.; Revina, L. P.; Golovkin, B. N.; Stepanov, V. M., Macluralisin - a<br />
Serine Proteinase from Fruits of Maclura-Pomifera (Raf) Schneid. Planta 1995, 196, (1), 174-179.<br />
16. Aghel, N.; Kalantari, H.; Rezazadeh, S., Hepatoprotective Effect of Ficus carica Leaf Extract on Mice<br />
Intoxicated with Carbon Tetrachloride. Iran. J. Pharm. Res. 2011, 10, (1), 63-67.<br />
17. Mostafaie, A.; Mansouri, K.; Norooznezhad, A. H.; Mohammadi-Motlagh, H. R., Anti-Angiogenic<br />
Activity of Ficus carica Latex Extract on Human Umbilical Vein Endothelial Cells. Yakhteh 2011, 12,<br />
(4), 525-528.<br />
18. Dai, H. F.; Gan, Y. J.; Que, D. M.; Wu, J.; Wen, Z. C.; Mei, W. L., A New Cytotoxic 19-Norcardenolide<br />
from the Latex of Antiaris toxicaria. Molecules 2009, 14, (9), 3694-3699.<br />
19. Shi, L. S.; Liao, Y. R.; Su, M. J.; Lee, A. S.; Kuo, P. C.; Damu, A. G.; Kuo, S. C.; Sun, H. D.; Lee, K. H.;<br />
Wu, T. S., Cardiac Glycosides from Antiaris toxicaria with Potent Cardiotonic Activity. J. Nat. Prod.<br />
2010, 73, (7), 1214-1222.<br />
- 37 -
XI. Workshop oof<br />
Physical Cheemists<br />
and Electrochemists´11<br />
VOLTTAMMMETRIC<br />
C MOONITO<br />
ORING OF<br />
RIBOOFLAVVIN<br />
RE EDUCTTION<br />
ON MERCU M URY<br />
MENISCUSS<br />
MOD DIFIED<br />
SILV VER SOLID S D<br />
AMAALGAMM<br />
ELECTROODE<br />
Lenka BANNDŽUCHOOVÁ1<br />
, Rená áta ŠELEŠO<br />
OVSKÁ 1<br />
1Institute off<br />
Environmenntal<br />
and Chem mical Engineeering,<br />
Univer rsity of Pardub ubice, Students tská 573, Pard dubice,<br />
532210,<br />
Czech Re epublic<br />
Abstractt<br />
Voltammeetric<br />
reducttion<br />
of rib boflavin (RRF)<br />
on mer rcury meni iscus modif<br />
amalgam eelectrode<br />
( m-AgSAE) has been studied in this paper r. It was ob<br />
provides 1 reduction peak (Ep = -150 mV) suitable for r its determ mination. D<br />
voltammettry<br />
(DPV) proved to o be a suittable<br />
volta ammetric method m for<br />
riboflavin reduction. The limit of detection<br />
was foun nd as 4.89×1 10<br />
method inn<br />
conjuncttion<br />
with m-AgSAEE<br />
was also o successfu<br />
determinaation<br />
in twwo<br />
types of pharmaceuuticals.<br />
All l results we<br />
obtained oon<br />
hanging mercury drop<br />
electroode<br />
(HMDE E).<br />
-9 fied silver solid<br />
bserved tha at RF<br />
Differential pulse<br />
r monitorin ng of<br />
M (tacc = 5 s). The DPV<br />
lly aplliedd<br />
for ribof flavin<br />
ere comparred<br />
with re esults<br />
7. INTRRODUCTIION<br />
Ribooflavin<br />
(6,77-dimethyl-9-(1-D-ribbityl)isoallo<br />
oxazin, Fig. . 1) is an essential water w<br />
soluble vittamin,<br />
whoose<br />
aqueou us solutionss<br />
are very sensitive of<br />
light. RFF<br />
has two active a<br />
forms: flavvin<br />
mononnukleotide<br />
(FMN) andd<br />
flavin ade enine mononukleotidde<br />
(FAD). These T<br />
two coenzzymes<br />
playy<br />
importan nt role in the organ nism. They y participat ate many redox r<br />
processes llike<br />
oxidative<br />
phosph horylation oor<br />
synthesi is and degradation<br />
of fatty acids.<br />
The<br />
recommennded<br />
daily iintake<br />
of RF R is for addults<br />
1.3 – 1.7 1 mg. The e food richh<br />
in RF are eggs,<br />
livers, meeet,<br />
milk andd<br />
milk prod ducts 0,0.<br />
Fig g. 1 The struucture<br />
of ri iboflavin<br />
Due to its bioloogical<br />
impo ortance andd<br />
light insta<br />
of the lighht<br />
of RF annd<br />
other fl lavins has bbeen<br />
invest<br />
Birss et al. . studied thhe<br />
photolysis<br />
of adsorbbed<br />
flavins<br />
studies, whhich<br />
describe<br />
the electrochemicaal<br />
behavior<br />
electrodes,<br />
have beenn<br />
provided 0-7]. Mechhanism<br />
of el<br />
described by Linquisst<br />
and Farro oha 0 as a 2e- /2H + ability the photolysis p aand<br />
the stability<br />
tigated for example inn<br />
literature e 0,0.<br />
on mercury<br />
electrodees<br />
0. Some other<br />
and determ mination off<br />
RF on mer rcury<br />
lectrochem mical behaviior<br />
on DME E was<br />
rev versible red dox processs.<br />
RF provi ides 1<br />
- 38 -<br />
Brno
XI. Workshop of Physical Chemists and Electrochemists´11 Brno<br />
reduction and 1 oxidation peak on mercury electrodes 0. Nowadays, due to the toxicity of<br />
liquid mercury, new non toxic electrode materials are still looked for. RF has been<br />
successfully determined using glassy carbon electrode 0, modified gold electrode 0 or<br />
diamond electrode 0.<br />
The m-AgSAE is one of the modifications of silver solid amalgam electrodes, which<br />
were introduced by Novotný and Yosypchuk in 2000 0. These electrodes are made from<br />
non toxic silver amalgam and have been successfully used for voltammetric determination<br />
of various compounds. This paper has been focused on application of mercury meniscus<br />
modified silver solid amalgam electrode for voltammetric monitoring of riboflavin<br />
reduction and its determination in pharmaceuticals.<br />
8. EXPERIMENT<br />
The stock solution of RF had to be stored in the dark and all analysis had to be<br />
provided in a covered polarographic cell due to the light instability of RF. All<br />
measurements were provided by computer controlled Eco-Tribo Polarograph PC-ETP in<br />
3-electrodes set up (m-AgSAE or HMDE as a working electrode, saturated argentchloride<br />
as a reference and platinum wire as an auxiliary electrode). DPV with optimized<br />
parameters (Ein = 100 mV, Efin = -800mV, v = 20 mV.s -1 Eacc= 100 mV, tacc depends on<br />
concentration of RF, height of pulse -50 mV, width of pulse 80ms) was found as a suitable<br />
method for RF determination. The optimal conditions for the m-AgSAE`s surface<br />
regeneration was found as 30 potential jumps between 0 and -1500 mV.<br />
9. RESULTS AND DISCUSSION<br />
It was found that RF provides 1 reduction and 1 oxidation peak on m-AgSAE as well<br />
as on HMDE in wide range of pH (3-12), which consists with literature 0,0. The highest<br />
reduction response on both used working electrodes was observed in medium of pH 5 that<br />
is why the 0.05M acetate buffer of pH 5 was used for all subsequent analysis. It was also<br />
found, using direct current voltammetry, that heigh of the reduction peak increased<br />
linearly with the scan rate, which shows that the reduction is realized in adsorbed state.<br />
Some statistical parameters were determined for the reduction of RF. The relative<br />
standard deviation of 11 repeated measurements was calculated as RSDM(11) = 2.73 % (m-<br />
AgSAE) resp. 1.36 %(HMDE). The relative standard deviations of 5 repeated<br />
determinations were calculated for various concentrations levels using ADSTAT 0 (Tab.<br />
1). The limit of detection is equal to 4.89×10 -9 (tacc = 5 s) for m-AgSAE and 5.16×10 -10<br />
(tacc = 120 s) for HMDE. The linear dynamic range was found as 1×10 -8 to 1×10 -6 for m-<br />
AgSAE and 2×10 -9 to 1×10 -6 for HMDE. The example of concentration dependence<br />
obtained on m-AgSAE is shown in Fig. 2.<br />
Tab. 1: Comparison of relative deviations and relative standard deviations of repeated<br />
determinations obtained on m-AgSAE and HMDE<br />
Added<br />
[M]<br />
5×10 -8<br />
m-AgSAE HMDE<br />
Found RD RSDD(5) Added Found RD RSDD(5)<br />
[M] [%] [%] [M] [M] [%] [%]<br />
4.95×10 -8 -1 0.65 1×10 -8 1.04×10 -8 +4 3.65<br />
- 39 -
XI. Workshop of Physical Chemists and Electrochemists´11 Brno<br />
2×10 -8 2.06×10 -8 +2.9 0.84 5×10 -9 5.01×10 -9 +0.2 0.78<br />
1×10 -8 1.00×10 -8 0 1.11 2×10 -9 2.05×10 -9 +2.4 1.17<br />
I [nA]<br />
-8,5<br />
-8<br />
-7,5<br />
-7<br />
-6,5<br />
-6<br />
-5,5<br />
-5<br />
-4,5<br />
-4<br />
0<br />
-50<br />
-100<br />
-150<br />
Fig. 2 The concentration dependence of RBF on m-AgSAE, sup. electrolyte: acetate buffer<br />
(pH 5), method: DPV with optimized parameters, c(RF) = 2×10 -8 - 16×10 -8 M<br />
The content of RF was also determined in two pharmaceuticals using standard<br />
addition method. Both pharmacetuticals content 10 mg RF in 1 tablet. The determined<br />
average content (9,8 resp. 9,6 mg/tbl.) is consistent with content from the producer and<br />
differs of 2 resp. 4 %. Almost the same results were obtained using HMDE.<br />
10. CONCLUSION<br />
It can be concluded, that the m-AgSAE can replace mercury electrodes in<br />
voltammetric determination of RF due to its sufficient sensitivity and good reproducibility<br />
of measurement. DPV in combination with m-AgSAE was successfully applied for<br />
determination RF in two types of pharmaceuticals.<br />
11. ACKNOWLEDGEMENT<br />
The work has been supported by Ministry of Education, Youth and Sports of the<br />
Czech Republic by the Research Centre LC06035 and by the project MSM 0021627502.<br />
12. REFERENCES<br />
[1] Vávrová, J.: Vitaminy a stopové prvky 2007,1 st edition, Racek, J., Dastych, M., 2007, Pardubice, 16,<br />
27.<br />
[2] Ahmad, I., Fasihullah, Q., Noor, A., Ansari, I.A., Manzar Ali, Q.N.: Int. J. Pharm., 280 (2004), 1-2,<br />
199.<br />
[3] Sikorska, E., Khmelinskii, I., Komas, A., Koput, J., Ferreira, L.F.V., Herance, J.R., Bourdelance, J.L.,<br />
Williams, S.L., Worrall, D.R., Insinska-Rak, M., Sikorski, M.: Chem. Phys., 314 (2005), 1-3, 239.<br />
[4] Birss, V.I., Guha-Thakurta, S., McGarvey, C.E., Quach, S., Vanysek, P.: J. Electroanal. Chem., 423<br />
(1997), 1-2, 13.<br />
[5] Villamil, M.J.F, Ordieres, A.J.M, Garcia, A.C., Blanco, P.T.: Anal. Chim. Acta, 273 (1993), 1-2, 377.<br />
[6] Lindquist, J., Farroha, S.M.: Analyst, 100 (1975), 1191, 377.<br />
[7] Wang, J., Luo, D.-B., Farias, P.A.M., Mahmoud J.S.: Anal. Chem, 57 (1985), 1, 158.<br />
- 40 -<br />
I p [nA]<br />
-3<br />
-2<br />
-1<br />
0<br />
I p [nA] = -0,018 c [nM] + 0,021<br />
R = 0,997<br />
0 100 200<br />
c [nM]<br />
-200 -250<br />
E [mV]
XI. Workshop of Physical Chemists and Electrochemists´11 Brno<br />
[8] Marian, I.O., Bonciocat, N., Sandulescu, R., Filip, C.: J. Pharmaceut. Biomed., 24 (2001), 5-6, 1175.<br />
[9] Qijin, W., Nanjung, Y., Haili, Z., Xinpin, Z., Bin, X.: Talanta, 55 (2001), 3, 459.<br />
[10] Chatterjee, A., Foord, J.S.: Diam. Relat. Mater., 18 (2009), 5-8, 899.<br />
[11] Yosypchuk, B., Barek, J.: Crit. Rev. Anal. Chem., 39 (2009), 3, 189.<br />
[12] Trilobyte statistical software, TriloByte s.r.o., Pardubice (1995).<br />
- 41 -
XI. Workshop of Physical Chemists and Electrochemists´11 Brno<br />
PHOTOINDUCED OXYGEN ACTIVATION IN<br />
THE PRESENCE OF 4-<br />
ANILINOQUINAZOLINES<br />
Zuzana BARBIERIKOVÁ 1 , Jana BALÁŽIKOVÁ 2 , Soňa JANTOVÁ 2 , Vlasta BREZOVÁ 1<br />
1 Institute of Physical Chemistry and Chemical Physics,<br />
2 Institute of Biochemistry, Nutrition and Health Protection, Faculty of Chemical and Food Technology<br />
Slovak University of Technology in Bratislava, Radlinského 9, SK-812 37 Bratislava, Slovak Republic<br />
Abstract<br />
To evidence photoinduced molecular oxygen activation in dimethylsulfoxide or<br />
acetonitrile solutions of 4-anilinoquinazoline derivatives, in situ photochemical EPR<br />
experiments were performed. The ability of investigated compounds to generate<br />
paramagnetic intermediates and superoxide radical anion upon photoexcitation was<br />
studied applying the EPR spin trapping technique. The generation of singlet oxygen was<br />
evidenced via the oxidation of 4-hydroxy-2,2,6,6-piperidine to paramagnetic 4-hydroxy-<br />
2,2,6,6-tetramethylpiperidine N-oxyl (TEMPOL). Photobiological studies evaluated<br />
antiproliferative/ cytotoxic effect in the dark and in the presence of UVA light using<br />
cancer cell lines Hela, HT-29 and L1210.<br />
1. INTRODUCTION<br />
4-Anilinoquinazolines represent a class of epidermal growth factor receptor tyrosine<br />
kinase inhibitors widely used to treat cell lung cancer and other tumours [1]. Majority of<br />
recent studies related to anilinoquinazolines deals with the development of novel<br />
synthesized derivatives and further investigations of their anticancer activity. However<br />
possible phototoxic response of these compounds is not sufficiently examined.<br />
Consequently also their potential photosensitizer properties remain open. Hence this<br />
study focuses on the photochemical investigations of three 4-anilinoquinazoline<br />
derivatives (Tab. 1), in order to find out whether these compounds may activate molecular<br />
oxygen upon specific, mostly UVA, irradiation. In biological specimens, dissolved oxygen<br />
represents a very effective quenching agent for a molecule in the excited triplet state. The<br />
ground state oxygen molecule ( 3 O2) can be excited to the reactive singlet states, leading to<br />
reactions that exhibit a phototoxic effect on living cells. We recognise two mechanisms of<br />
the photosensitizer triplet excited state quenching by molecular oxygen, either by energy<br />
transfer from the excited sensitizer molecule to 3 O2, resulting in the formation of singlet<br />
oxygen ( 1 O2), or by electron transfer, forming superoxide radical anion (O2 − ) and other<br />
radical intermediates.<br />
- 42 -
XI. Workshop of Physical Chemists and Electrochemists´11 Brno<br />
Tab. 1: Overview of investigated 4-anilinoquinazolines.<br />
A B C D<br />
-Br<br />
-Br<br />
-Cl<br />
2. EXPERIMENT<br />
EPR in situ photochemical experiments were performed upon UVA irradiation of 4anilinoquinazolines<br />
in dimethylsulfoxide (DMSO) applying an EPR spin trapping<br />
technique to observe short living radical intermediates. 5,5-Dimethyl-1-pyrroline N-oxide<br />
(DMPO) and 5-ethoxy carbonyl-5-methyl-1-pyrroline N-oxide (EMPO) were used as<br />
spin trapping agents. The photoinduced production of singlet oxygen during the<br />
excitation of 4-anilinoquinazolines was followed in acetonitrile (ACN) solutions in the<br />
presence of 4-hydroxy-2,2,6,6-piperidine (TMP). The solutions of 4-anilinoquinazolines<br />
containing spin traps or TMP were mixed directly before the EPR measurements, then<br />
carefully saturated with air and immediately transferred to a small quartz flat cell<br />
optimized for the TE102 cavity of the EPR spectrometer EMX (Bruker, Germany). The<br />
samples were irradiated at 295 K directly in the EPR resonator, and the EPR spectra<br />
recorded in situ during continuous photoexcitation.<br />
3. RESULTS AND DISCUSSION<br />
The generation of paramagnetic species upon photoexcitation of studied<br />
anilinoquinazoline derivatives (Tab. 1) was investigated in DMSO solutions by in situ EPR<br />
spin trapping technique. Applying DMPO as a spin trapping agent dominating<br />
photoinduced twelve line EPR signal was observed. This signal was attributed to the<br />
superoxide radical anion spin adduct ( DMPO-O2 – ), considering good agreement of spin<br />
Hamiltonian parameters, obtained from simulation analysis, with the hyperfine coupling<br />
constants of DMPO-O2 – in DMSO. In addition to the major spin adduct, DMPO-OCH3<br />
- 43 -<br />
-H -H<br />
-<br />
NO<br />
2<br />
-H<br />
-H<br />
-<br />
CH<br />
3<br />
N-phenyl-6bromo-2morpholinoquinazoline-4amine<br />
(QA1)<br />
N-(2nitrophenyl)-6bromo-2morpholinoquinazoline-4amine<br />
(QA2)<br />
N-(4methylphenyl)-6chloro-2-phenylquinazoline-4amine<br />
(QA3)
XI. Workshop oof<br />
Physical Cheemists<br />
and Electrochemists´11<br />
was also ppresent.<br />
In<br />
DMPO, EMMPO<br />
spin t<br />
spectra obbtained<br />
in D<br />
DMPO annd<br />
EMPO. T<br />
correspondding<br />
to ind<br />
attributed to<br />
simulation<br />
<br />
EMPO-CR<br />
order to v<br />
trap was us<br />
DMSO solu<br />
The simula<br />
dividual spin<br />
EMPOO-O2<br />
n analysis,<br />
R’’.<br />
– and erify the aassignment<br />
of the spin n adducts mmonitored<br />
using<br />
sed. Fig. 1 suummarizes<br />
s the experi imental andd<br />
simulated d EPR<br />
ution of QAA2<br />
upon continuous<br />
ex xposure in the presen nce of<br />
ated spectraa<br />
represent t a linear co ombinationn<br />
of EPR si ignals<br />
n adducts. TThe<br />
major spin adducts<br />
found wwith<br />
EMPO were<br />
EMPO-OC E CH3 [2]. The e other spin n adducts, assigned du uring<br />
<br />
present in relatively low concen ntrations, account a to EMPO-O OR’ or<br />
(a)<br />
Fig. 1: Expperimental<br />
(black) an nd simulated<br />
(red) electron<br />
param magnetic sp spectra obse erved<br />
upoon<br />
continuuous<br />
photo oexcitation of aerate ed 1.3 mM M QA2 dimmethylsulfo<br />
foxide<br />
soluutions<br />
in thhe<br />
presence e of two diiferent<br />
spin n trapping agents (a) 55,5-dimeth<br />
hyl-1-<br />
pyrrroline<br />
N-ooxide<br />
(DM MPO) and ( (b) 5-ethox xycarbonyl l-5-methyl-1-pyrrolin<br />
neN- oxide<br />
(EMPOO).<br />
Simulati ions repressent<br />
linear combinati ions of thee<br />
correspon nding<br />
spinn<br />
adducts.<br />
Phottoinduced<br />
generation n of singleet<br />
oxygen upon continuous<br />
irr rradiation of o 4-<br />
anilinoquiinazolines<br />
in ACN so olutions wwas<br />
monitor red via the<br />
oxidationn<br />
of TMP to a<br />
semistablee<br />
nitroxide radical TE EMPOL whhich<br />
is char racterized by b a three-line<br />
EPR signal s<br />
[3]. Continnuous<br />
photoexcitation<br />
n of the derrivatives<br />
in the presenc ce of TMP under the given g<br />
experimenntal<br />
conditiions<br />
caused d an increease<br />
in the relative in ntensity off<br />
EPR sign nal of<br />
TEMPOL.<br />
The photobiollogical<br />
inv vestigationss<br />
were oriented<br />
mainly m on the stud dy of<br />
biological/ /photobioloogical<br />
effect ts of the deerivatives<br />
on o cancer cell<br />
lines. Thhe<br />
sensitivity<br />
of<br />
Hela, HT-229<br />
and L12210<br />
cells to UVA irradiiation<br />
was evaluated.<br />
4. CONNCLUSION<br />
The EPR exper<br />
anilinoquiinazolines<br />
paramagneetic<br />
specie<br />
generatingg<br />
O2<br />
the format<br />
N<br />
riments con nfirmed thhat<br />
UVA (λ λmax = 365 nm) n photooexcitation<br />
of 4-<br />
in the pre esence of mmolecular<br />
oxygen results<br />
in thhe<br />
formatio on of<br />
s coupled with electtron<br />
or en nergy trans sfer to moolecular<br />
ox xygen<br />
– and 1O2. The ap pplication oof<br />
different t spin trapp ping agentss<br />
also evide enced<br />
tion of otheer<br />
oxygen- and carbonn-centered<br />
radical spin n adducts. RResults<br />
obta ained<br />
- 44 -<br />
(b)<br />
Brno
XI. Workshop of Physical Chemists and Electrochemists´11 Brno<br />
in photobiological experiments evidenced the increase in the sensitivity of all tested cell<br />
models on investigated derivatives. Leukemia L1210 cells were the most sensitive to the<br />
effect of non-photoactivated and photoactivated 4-anilinoquinazolines. In conclusion our<br />
investigations show that 4-anilinoquinazolines behave as photosensitive compounds, with<br />
potential application as photosensitizers.<br />
5. ACKNOWLEDGEMENT<br />
This study was financially supported by Scientific Grant Agency (VEGA Project<br />
1/0018/09) and Research and Development Agency (contract No. APVV-0339-10).<br />
6. REFERENCES<br />
[1] Sun H.-Y., Guan S., Bi H.-C., Su Q.-B., Huang W.-L., Chowbay B., Huang M., Chen X., Li C.-G., Zhou S.-<br />
F.: Journal of Chromatography B, 854 (2007), 320-327<br />
[2] Stolze K., Udilova N., Nohl H.: Biological Chemistry, 383 (2002), 813-820<br />
[3] Zang L., van Kuijk F., Misra B., Misra H.: Biochemistry and Molecular Biology International, 37 (1995),<br />
283-293<br />
- 45 -
XI. Workshop of Physical Chemists and Electrochemists´11 Brno<br />
ELECTROCHEMICAL DETECTION OF RNA<br />
USING A COMPLEX OF SIX-VALENT<br />
OSMIUM<br />
Martin BARTOŠÍK 1 , Mojmír TREFULKA 1 , Emil PALEČEK 1<br />
1 Institute of Biophysics, Academy of Sciences of the Czech Republic, v.v.i., Královopolská 135, 612 65 Brno,<br />
Czech Republic<br />
Abstract<br />
Currently, nucleic acid electrochemistry is mainly focused on development of DNA<br />
hybridization biosensors. After a discovery that short, gene-regulating RNA molecules -<br />
microRNAs (miRNAs) - might play a role in biomedicine, particularly in cancer<br />
development, new assays for the miRNA detection have been sought. We have previously<br />
demonstrated that electroactive complexes of six-valent osmium with nitrogenous ligands<br />
(Os(VI)L) preferentially bind to polysaccharides. Recently, Os(VI)L was shown to bind<br />
also to ribose-containing oligonucleotides (ONs), if the ribose was located at the 3’-end,<br />
but not to deoxyribose. Such Os(VI)L-ON adducts were analyzed at carbon and mercury<br />
electrodes (HgE), including solid amalgam electrodes, and were easily discriminated from<br />
oligodeoxynucleotides. Moreover, application of HgE enabled picomolar determination of<br />
ribose-containing ONs due to an electrocatalytic nature of the signal provided by the<br />
adduct. This finding might lead to a new, sensitive method for miRNA detection.<br />
1. INTRODUCTION<br />
Nucleic acids (NAs) are electroactive species undergoing oxidation and reduction<br />
processes at carbon and mercury electrodes, producing analytically useful electrochemical<br />
(EC) signals [1]. Moreover, NAs can be labeled to render them electroactive at electrodes,<br />
if (a) they do not produce any oxidation or reduction signals or (b) to discriminate<br />
between different NAs, e.g. unlabeled probe and target DNA. The fifty years history of<br />
NA electrochemistry was recently reviewed [2]. In the first three decades, only small<br />
number of laboratories studied NAs from EC point of view. However, fast progress in<br />
genomics strongly influenced the NA electrochemistry and particularly the research and<br />
development of the EC DNA sensors, making it a booming field with > 700 papers in 2010.<br />
Although EC determination of nucleotide sequences or DNA point mutations (single-base<br />
mismatches) after PCR amplification is well-established, detection of a specific (nonrepetitive),<br />
amplification-free sequence in eukaryotic genomes, as well as EC sensing of<br />
DNA-protein interactions still represent important challenges. Recently it was shown that<br />
short microRNAs (miRNA) play significant roles in molecular biology processes. For<br />
instance, miRNA was shown to be potential cancer biomarker, but its role is being<br />
investigated also in other diseases. Literature dealing with an EC analysis of RNA, as<br />
compared to DNA hybridization sensors, is still rather scarce [3, 4].<br />
- 46 -
XI. Woorkshop<br />
of Physsical<br />
Chemists and a Electrochemmists´11<br />
2. EXPERIMMENT<br />
All voltammmetric<br />
me easurementts<br />
were per rformed wi ith an AUTTOLAB<br />
(Ec co Chemie, ,<br />
Nethherlands)<br />
inn<br />
connectio on with VAA-Stand<br />
663<br />
(Metrohm m, Switzerlland),<br />
using g standard, ,<br />
threee-electrodee<br />
system co omprising wworking<br />
el lectrode (h hanging meercury<br />
drop p electrodee<br />
(HMMDE),<br />
solid amalgam electrode e (SSAE)<br />
or pyr rolytic grap phite electroode<br />
(PGE)) ), referencee<br />
electtrode<br />
(Ag/AAgCl/3<br />
M KCl) K and aauxiliary<br />
el lectrode (pl latinum wiire).<br />
Oligon nucleotidess<br />
(ONss)<br />
having eeither<br />
all deoxyribose<br />
d e residues (ODN), or deoxyriboose<br />
residues s with onee<br />
ribosse<br />
residue at the 3’-e end of the ON (ODR RN), were used. ONs were mod dified withh<br />
Os(VVI)L<br />
compllexes,<br />
whe ere L was nitrogenou us ligand, usually biipyridine<br />
(bipy). ( Forr<br />
modification<br />
deetails,<br />
see [5 5].<br />
3. RESULTS<br />
AND DISCUSSIO<br />
D ON<br />
In differeence<br />
to Os s(VIII)L coomplexes,<br />
modifying m DNA and RNA base es, Os(VI)LL<br />
compplexes<br />
speccifically<br />
modify m sugaar<br />
residues s in ribosi ides [6]. WWe<br />
used Os(VI)bipy O y<br />
compplexes<br />
for mmodificatio<br />
on of ONs, aas<br />
shown in n Fig. 1. Os(VI)bipy<br />
mmodified<br />
on nly ODRN, ,<br />
containing<br />
riboose<br />
at the 3‘-end, andd<br />
not ODN Ns without any ribosee,<br />
in agreement<br />
withh<br />
propposed<br />
specifficity<br />
of Os(VI)L O to rribose<br />
resid dues. At HMDE, H welll-develope<br />
ed catalyticc<br />
peakk<br />
(peak Cat at) was pro oduced by Os(VI)bipy y-ODRN ( Fig. 2A,B), , allowing picomolarr<br />
deterrmination<br />
oof<br />
the ODR RN [7]. Simmilar<br />
results were obtai ined also wwith<br />
SAE (Fi ig 2C). Thee<br />
meassurement<br />
ccan<br />
be don ne not onlyy<br />
in situ, but b also ex x situ, afterr<br />
transfer of ODRN-<br />
modified<br />
electtrode<br />
to the t blank backgroun nd electrolyte.<br />
In eex<br />
situ ex xperiments, ,<br />
Os(VVI)bipy-ODDRN<br />
was adsorbed a frrom<br />
L vo olumes of solution, s mmaking<br />
it possible p too<br />
deterrmine<br />
femmto-<br />
and su ubfemtomoole<br />
amount ts of ODR RNs. At PGGE<br />
(not sh hown), noo<br />
catallytic<br />
peak wwas<br />
produce ed. Instead, , well-deve eloped anod dic peaks and were e observed, ,<br />
againn<br />
highly specific<br />
to rib bose-contaiining<br />
ONs. Due to a no on-catalytiic<br />
nature of f the signal, ,<br />
highher<br />
concenttrations<br />
we ere necessarry<br />
to deter rmine ODR RN (~ 250 nM). End-labeling<br />
off<br />
ODRRN<br />
is not sequence<br />
sp pecific - almmost<br />
identi ical responses<br />
were oobtained<br />
wi ith ODRNss<br />
havinng<br />
different<br />
nucleot tide sequeences<br />
(not t shown). Moreoverr,<br />
ODRNs could bee<br />
sensiitively<br />
deteected<br />
in an excess of OODNs.<br />
Fig.<br />
1. Modificcation<br />
of a ribose at the 3’-end d of an olig gonucleotidde<br />
with electroactivee<br />
Os(VI)L.<br />
Oligodeox xynucleotidde<br />
without ribose resid due is not mmodified.<br />
- 47 -<br />
Brnoo
XI. Workshop oof<br />
Physical Cheemists<br />
and Electrochemists´11<br />
Fig. 2. Diifferential<br />
pulse volt tammogramms<br />
of Os(V VI)bipy-modified<br />
oliggonucleotid<br />
des at<br />
HMMDE<br />
and SAAE.<br />
(A) Pea ak Cat of 220<br />
nM ODR RN (green) and ODN ( (without ri ibose,<br />
redd)<br />
at HMDDE.<br />
(B) OD DRN peak CCat<br />
(green)<br />
at the co oncentratioon<br />
of 50 pM p at<br />
HMMDE.<br />
(C) 4400<br />
nM ODRN O (greeen)<br />
measur red at SAE E. Backgroound<br />
electr rolyte<br />
(blaack<br />
dashed) ).<br />
4. CONNCLUSIONN<br />
It wwas<br />
shown that ribose e residue aat<br />
the 3’-en nd of the ON O can bee<br />
modified with<br />
electroactiive<br />
Os(VI) )L comple exes, produucing<br />
sign nals at both<br />
mercurry<br />
and ca arbon<br />
electrodes.<br />
Advantagge<br />
of mercury<br />
electroodes<br />
lies in n a catalyti ic nature oof<br />
the resp ponse,<br />
allowing hhighly<br />
sensitive<br />
determ mination oof<br />
ONs at picomolar<br />
le evel. It is encouraging<br />
g that<br />
the catalyytic<br />
peak wwas<br />
obtain ned also att<br />
SAE, wh hich is mo ore convennient<br />
for se ensor<br />
applicationns.<br />
We beliieve<br />
that ou ur new appproach<br />
could<br />
be utiliz zed in EC aanalysis<br />
of RNA, R<br />
especially miRNA.<br />
5. ACKKNOWLEDDGEMENT<br />
T<br />
This work wass<br />
supported d by MEYSS<br />
CR ME09 9038 and GACR G P3001/11/2055<br />
(EP),<br />
GACR 3001/10/P5488<br />
(MT), Research R<br />
AV0Z500440507<br />
and AAV0Z50040<br />
0702.<br />
Centre LC C06036 an nd IBP RResearch<br />
Plans<br />
6. REFFERENCESS<br />
[1] Paleček,<br />
E., Jelen, F.: Electrochemistry<br />
of nuucleic<br />
acids an nd proteins. Towards T electtrochemical<br />
sensors s<br />
for geenomics<br />
and pproteomics,<br />
Paleček, P E., Sccheller,<br />
F. W., W Wang, J. (e eds), 2005, Ammsterdam:<br />
Elsevier,<br />
73.<br />
[2] Paleček,<br />
E.: Electrooanalysis,<br />
21 (2009), 239.<br />
[3] Lusi, E. A., Passammano,<br />
M., Gua arascio, P., Scaarpa,<br />
A., Schi iavo, L.: Anal.<br />
Chem., 81 (22009),<br />
2819.<br />
[4] Poehllmann,<br />
C., Spprinzl,<br />
M.: An nal. Chem., 822<br />
(2010), 4434 4.<br />
[5] Trefuulka,<br />
M., Palečček,<br />
E.: Electr roanalysis, 211<br />
(2009), 1763 3.<br />
[6] Trefuulka,<br />
M., Ostatná,<br />
V., Havran,<br />
L., Fojta MM.,<br />
Paleček, E.: E Electroana alysis, 19 (20007),<br />
1281.<br />
[7] Trefuulka,<br />
M., Bartoošík,<br />
M., Pale eček, E.: Electtrochem.<br />
Com mmun., 12 (20 010), 1760.<br />
- 48 -<br />
Brno
XI. Workshop of Physical Chemists and Electrochemists´11 Brno<br />
THE SPECTROSCOPIC STUDY OF<br />
PHOTOINDUCED REACTIONS OF N-<br />
HETEROCYCLIC COMPOUNDS<br />
Miroslava BOBENIČOVÁ 1 , Jana TABAČIAROVÁ 1 , Kristína PLEVOVÁ 2 , Dana<br />
DVORANOVÁ 1<br />
1 Institute of Physical Chemistry and Chemical Physics, Faculty of Chemical and Food Technology, Slovak<br />
University of Technology in Bratislava, Radlinského 9, SK-812 37 Bratislava, Slovak Republic<br />
2 Institute of Organic Chemistry, Catalysis and Petrochemistry, Faculty of Chemical and Food Technology,<br />
Slovak University of Technology in Bratislava, Radlinského 9, SK-812 37 Bratislava, Slovak Republic<br />
Abstract<br />
The work is focused on the photochemical transformation of novel fluoroquinolones in<br />
aprotic media by means of UV-Vis spectroscopy and EPR spin trapping technique.<br />
Investigated molecules behave as photosensitizers and UVA irradiation in the presence of<br />
air led to the formation of reactive oxygen species.<br />
1. INTRODUCTION<br />
N-Heterocyclic compounds, mainly quinoline derivatives, are known for their<br />
importance in therapeutical treatment. Although these substances contain basic quinoline<br />
skeleton, their biological activity depends on their substitution character and position.<br />
The 4-oxoquinoline derivatives represent one of the largest classes of antimicrobial agents<br />
and they are known for their inhibition of Topoisomerase II. From them, the 4oxoquinoline<br />
derivatives possessing a fluorine atom at position 6 as a substituent have<br />
been classified as most efficient in biological activity [1,2]. The molecules contain<br />
extended π-electron system which could be activated by UVA irradiation and molecules<br />
could behave as photosensitizers. The photoactivation in the presence of oxygen leads to<br />
the formation of reactive oxygen species (ROS) as superoxide radical anion, singlet oxygen<br />
or hydroxyl radical [3,4], which could activated the undesirable side reactions, frequently<br />
coupled with drop of biological activity of drug. Our study was focused on novel<br />
fluoroquinolnoes (Table 1) with main attention on their photochemical transformation<br />
using EPR and UV-Vis spectroscopy.<br />
Tab. 1: Structures of investigated fluoroquinolones<br />
F<br />
O<br />
N<br />
R2<br />
R1<br />
- 49 -<br />
R1 R2<br />
F7Q2 COOC2H5 H<br />
F7Q3 COOCH3 H<br />
F7Q4 COOH H<br />
F7EQ2 COOC2H5 C2H5
XI. Workshop of Physical Chemists and Electrochemists´11 Brno<br />
2. EXPERIMENT<br />
Four fluoroquinolones (Table 1) were synthesized in our laboratory and applied in<br />
photochemical experiments. 5,5-Dimethyl-1-pyrroline N-oxide (DMPO) was used as spin<br />
trapping agent and 2,2,6,6-tetramethyl-4-piperidin-N-oxyl (TEMPOL) was applied as spin<br />
label. The oxidation of 4-hydroxy-2,2,6,6-tetramethylpiperidine (TMP) via singlet oxygen<br />
to the paramagnetic nitroxyl radical (TEMPOL) was utilized for 1 O2 detection by EPR<br />
spectroscopy. The stock solutions of fluoroquinolones were prepared in dimethylsulfoxide<br />
(DMSO) and acetonitrile (ACN) and directly mixed with solution of spin trap/spin label<br />
prior to irradiation. The prepared solutions were saturated by argon or air, filled in the<br />
quartz flat cell and the X-band EPR spectra were recorded at EPR Bruker EMX<br />
spectrometer. Samples were irradiated at 295 K in situ using HPA 400/30S lamp (400 W,<br />
max = 365 nm, Philips, UVA irradiance 5 mW cm –2 ). A Pyrex glass filter was applied to<br />
eliminate the radiation wavelengths below 300 nm. The EPR spectra obtained were<br />
processed, analyzed and simulated using the Bruker software WinEPR and SimFonia and<br />
the Winsim2002 software. The UV-Vis spectra of the investigated compounds were<br />
recorded using a UV-3600 UV-Vis spectrometer (Shimadzu, Japan) with a 1 cm square<br />
quartz cell.<br />
3. RESULTS AND DISCUSSION<br />
The UV-Vis spectra of F7Q2, F7Q3, F7Q4 and F7EQ2 in DMSO confirmed their<br />
absorption of the UVA region. The flouroquinolones have two absorption maxima in the<br />
region 310-330 nm. Therefore, by the photoactivation with UVA irradiation the<br />
molecules may behave as photosenzitizer producing reactive oxygen species. The EPR<br />
spin trapping technique is suitable tool for the evidence the reactive short-lived free<br />
radicals adding them to spin trapping agent under the formation of more stable<br />
paramagnetic products (spin adducts). The EPR spectrum of adducts brings information on<br />
type of reactive radical trapped [3-5]. Figure 1 represents the experimental and simulated<br />
EPR spectra of irradiated aerated DMSO solution of F7Q2 in the presence of DMPO spin<br />
trap.<br />
- 50 -
XI. Workshop of Physical Chemists and Electrochemists´11 Brno<br />
Fig.1 Experimental (solid line) and simulated (dotted line) EPR spectra (magnetic field<br />
sweep 8 mT) obtained after 25 minutes of continuous UVA irradiation of system<br />
F7Q2/DMPO/DMSO/air. Initial concentration: c0(F7Q2) = 0.80 mmol dm –3 and<br />
c0(DMPO) = 42 mmol dm –3 .<br />
The continuous UVA irradiation led to the formation of reactive radical species<br />
DMPO-O2 – (rel. conc. 60 %); DMPO-OCH3 (23 %); DMPO-OR (12 %) and DMPO-CR<br />
(5 %). The formation of superoxide radical anion upon photoexcitation of F7Q2 in DMSO<br />
solvent was confirmed by the addition of superoxide dismutase (SOD) into the solution,<br />
which caused a significant decrease of DMPO-O2 – EPR intensity by the competitive<br />
reaction of SOD with O2 – . The generation of DMPO-OCH3 has been observed in systems<br />
containing DMSO and DMPO as product of the reaction of ROS with solvent producing<br />
CH3 radicals, trapped under air as methoxy radical to DMPO spin trap. The UVA<br />
irradiation of other fluoroquinolones (F7Q3, F7Q4 and F7EQ2) in the DMPO/DMSO/air<br />
reaction system confirmed formation of identical type of spin trap adducts with different<br />
concentration. Replacing air by inert atmosphere led to the generation mainly carboncentered<br />
radicals originated probably from the molecule decomposition.<br />
Alternative technique to detect the reactive free radical formation is based on<br />
monitoring the decrease EPR intensity of nitroxide radical, e. g. TEMPOL, resulting from<br />
the interaction of its >N-O group with the generated reactive radical species, as well as<br />
singlet oxygen. The application TEMPOL in inert atmosphere and under air led to the<br />
changes of three-line EPR signal intensity upon irradiation reaction systems of<br />
fluoroquinolones, which sensitively reflects the influence of experimental conditions<br />
(solvent, atmosphere). The photoinduced generation of singlet oxygen upon continuous<br />
irradiation of quinolones in aerated ACN solutions was monitored via the oxidation of<br />
diamagnetic TMP.<br />
4. CONCLUSION<br />
The results of our study confirmed evidence that investigated molecules behave as<br />
photosensitizers possessing the ability to photoactivate molecular oxygen via an<br />
electron/energy transfer mechanism generating reactive oxygen species.<br />
- 51 -
XI. Workshop of Physical Chemists and Electrochemists´11 Brno<br />
5. ACKNOWLEDGEMENT<br />
This study was financially supported by Scientific Grant Agency of the Ministry of<br />
Education of the Slovak Republic (Projects VEGA 1/0018/09) and Research and<br />
Development Agency of the Slovak Republic (contracts No. APVV 0339-10 and SK-AT-<br />
0016-08).<br />
6. REFERENCES<br />
Drlica, K., Hiasa, H., Kerns R., Malik, M., Mustaev, A., Zhao X.: Curr. Top. Med. Chem. 9 (2009) 981.<br />
Boteva, A., Krasnykh, O.: Chem. Heterocycl. Compd. 45 (2009) 757.<br />
Brezová, V., Valko, M., Breza, M., Morris, H., Telser, J., Dvoranová, D., Kaiserová, K., Varečka, Ľ., Mazúr,<br />
M., Leibfritz, D.: J. Phys. Chem. B 107 (2003) 2415.<br />
Brezová, V., Gabčová, S., Dvoranová, D., Staško A.: Photochem. Photobiol. B Biol. 79 (2005) 121.<br />
Rimarčík, J., Lukeš, V., Klein, E., Kelterer, A.M., Milata, V., Vrecková, Z., Brezová, V.: J. Photochem.<br />
Photobiol. A Chem. 211 (2010) 47.<br />
- 52 -
XI. Workshop of Physical Chemists and Electrochemists´11 Brno<br />
TECHNICAL SOLUTION OF PLANET<br />
EXPLORATION<br />
Jaromír HUBÁLEK 1<br />
1 Brno University of Technology, Technická 10, CZ-616 00 Brno, CZ<br />
Abstract<br />
The exploration of Mars has been an important part of the space exploration programs of<br />
many countries in the world. Dozens of robotic spacecraft, including orbiters, landers, and<br />
rovers, have been launched toward Mars since the 1960s. These missions were aimed at<br />
gathering data about current conditions and answering questions about the history of<br />
Mars as well as a preparation for a possible human mission to Mars. These missions<br />
performed huge technology level and human craft in area of space research. Environment<br />
condition of Mars are extremely harder than on the Earth which front the scientist to<br />
many technical challenges to be solved in order to enable work of explorers in extreme<br />
conditions.<br />
1. INTRODUCTION<br />
In 2008, researchers from Brno University of Technology, Mendel University in<br />
Brno and Masaryk Universtiy succeeded in the program Nanotechnology for Society<br />
supported by the government of the Czech Republic and the ongoing project is<br />
successfully solving the priority tasks. This project is focused on development of new<br />
nanosystems applicable in medicine as biosensors for online monitoring particular<br />
physiological characteristics and treatment progression in general. To further reinforce<br />
the collaboration of Brno Universities (Masaryk University, Brno University of<br />
Technology, and Mendel University in Brno) the centre of excellence called CEITEC<br />
(Central European Institute of Technology) and Regional research centre SIX: Sensors,<br />
information and communication systems have been established to create an effective<br />
platform for research in nanotechnnology and nanoscience comprising materials and<br />
functional structures suitable for nanoelectronics and nanophotonics in general,<br />
addressing both the preparation and the characterization of nanostructures applicable in<br />
bio-medical areas, energetic and information and communication technologies.<br />
2. TODAYS KNOWLEDGE ABOUT RED PLANET<br />
The Mars is fourth planet of solar system, second the smallest planet after the<br />
Mercury. The Mars has ten times lighter then Earth. One day is 24 our, 39 minutes which<br />
is very similar to Earth but one year is 1,88 of Earth year. The surface is covered by iron<br />
oxides creating red colour of the planet. Gravitation is 0,376 G, it means aprox. 3 times<br />
less. The temperature on the surface can be extremely different from -143°C to 27°C with<br />
average value below 0°C. Athosphere is containing mainly CO2 with low pressure 600 Pa.<br />
The water has been found on the Mars. In these conditions the water is still frozen. Also<br />
CO2 is frozen on the poles of the planet together with water.<br />
- 53 -
XI. Workshop oof<br />
Physical Cheemists<br />
and Electrochemists´11<br />
The bigggest<br />
crater HHellas<br />
Planiti ia is 7 km deeep.<br />
On the bottom the atmosphericc<br />
pressure can c be<br />
1155 Pa and<br />
scientist eexpect<br />
that te emperature ccan<br />
rise abov ve 0°C and liquid l water ccan<br />
be found d. It is<br />
very importaant<br />
for humaan<br />
mission. [1 1]<br />
Fig. 1 Frozen<br />
poles of f the Mars<br />
3. NOWWADAYS<br />
TECHNO OLOGIES<br />
Phoeenix<br />
was a robotic spa acecraft on a space ex xploration mission m on Mars unde er the<br />
Mars Scouut<br />
Program.<br />
The Phoe enix landerr<br />
descended d on Mars on May 255,<br />
2008. Mi ission<br />
scientists used instruuments<br />
abo oard the laander<br />
to search<br />
for environme e ents suitabl le for<br />
microbial life on MMars,<br />
and to o research the histor ry of wate er there. TThe<br />
robotic c arm<br />
scooped uup<br />
more soil<br />
and deli ivered it too<br />
3 differen nt on-boar rd analyzerrs:<br />
an oven n that<br />
baked it annd<br />
tested thhe<br />
emitted gases, a miicroscopic<br />
imager, i and d a wet cheemistry<br />
lab b. The<br />
lander's RRobotic<br />
Armm<br />
scoop wa as positioneed<br />
over the e Wet Chem mistry Lab delivery fu unnel<br />
on Sol 29 (the 29th MMartian<br />
day y after landding,<br />
i.e. Jun ne 24, 2008 8). The soil was transf ferred<br />
to the insstrument<br />
oon<br />
Sol 30 (June 25, 2008), and<br />
Phoenix performedd<br />
the first t wet<br />
chemistry tests. On SSol<br />
31 (June e 26, 2008) Phoenix re eturned the e wet chemmistry<br />
test re esults<br />
with inforrmation<br />
on the salts in n the soil, annd<br />
its acidi ity. The wet<br />
chemistryy<br />
lab was part<br />
of<br />
the suite of tools caalled<br />
the Microscopy M , Electroch hemistry an nd Conducctivity<br />
Ana alyzer<br />
(MECA) [22].<br />
Marss<br />
Science Laboratory<br />
as a Mars Expploration<br />
Rover R (MER R)is intendeed<br />
to be the e first<br />
planetary mission (pllaned<br />
arriva al 2012) to use precisi ion landing g techniquees,<br />
steering itself<br />
toward thee<br />
Martian ssurface<br />
similar<br />
to the wway<br />
the sp pace shuttle controls itts<br />
entry thr rough<br />
the Earth's<br />
upper atmmosphere.<br />
In this waay,<br />
the spacecraft<br />
wil ll fly to a ddesired<br />
loc cation<br />
above the surface of f Mars befo ore deployinng<br />
its para achute for the t final laanding.<br />
Lik ke the<br />
twin roverrs<br />
now on tthe<br />
surface of Mars, MMars<br />
Science e Laborator ry will havee<br />
six wheel ls and<br />
cameras mmounted<br />
onn<br />
a mast. Un nlike the twwin<br />
rovers,<br />
it will car rry a laser ffor<br />
vaporiz zing a<br />
thin layerr<br />
from the surface of f a rock annd<br />
analyzin ng the elem mental commposition<br />
of o the<br />
underlyingg<br />
materials.<br />
It will be able to colllect<br />
rock an nd soil samp ples and disstribute<br />
the em to<br />
on-board test chambbers<br />
for ch hemical annalysis.<br />
Its design includes<br />
a suuite<br />
of scientific<br />
- 54 -<br />
Fig. F 2 Crate er Hellas Pllanitia<br />
Brno
XI. Workshop of Physical Chemists and Electrochemists´11 Brno<br />
instruments for identifying organic compounds such as proteins, amino acids, and other<br />
acids and bases that attach themselves to carbon backbones and are essential to life as we<br />
know it. It can also identify features such as atmospheric gases that may be associated with<br />
biological activity. Using these tools, Mars Science Laboratory will examine Martian rocks<br />
and soils in greater detail than ever before to determine the geologic processes that formed<br />
them; study the martian atmosphere; and determine the distribution and circulation of<br />
water and carbon dioxide, whether frozen, liquid, or gaseous.<br />
NASA plans to select a landing site on the basis of highly detailed images sent to<br />
Earth by the Mars Reconnaissance Orbiter, in addition to data from earlier missions. The<br />
rover will carry a radioisotope power system that generates electricity from the heat of<br />
plutonium's radioactive decay. This power source gives the mission an operating lifespan<br />
on Mars' surface of a full martian year (687 Earth days) or more while also providing<br />
significantly greater mobility and operational flexibility, enhanced science payload<br />
capability, and exploration of a much larger range of latitudes and altitudes than was<br />
possible on previous missions to Mars. [3]<br />
4. ACKNOWLEDGEMENT<br />
The work was by NanoBioTECell GA ČR P102/11/1068.<br />
5. REFERENCES<br />
[1] CARR, Michael H. The surface of Mars. New York : Cambridge University Press, 2006<br />
[2] H.U. Keller, W. Goetz, H. Hartwig, S.F. Hviid, R. Kramm, W.J. Markiewicz, R. Reynolds, C.<br />
Shinohara, P. Smith, R. Tanner, P. Woida, R. Woida, B.J. Bos, M.T. Lemmon, Journal of Geophysical<br />
Research-Planets 113 (2008) 15.<br />
[3] Mars Science Laboratory: Program and Missions source [http://mars.jpl.nasa.gov/programmissions/<br />
missions/present/msl/]<br />
- 55 -
XI. Workshop of Physical Chemists and Electrochemists´11 Brno<br />
ELECTROCHEMICAL DATA FROM SPACE<br />
René KIZEK 1 , Vojtěch ADAM 1 , Jaromír HUBÁLEK 2<br />
1 Mendel University in Brno, Zemedelska 1, CZ-613 00 Brno, CZ<br />
2 Brno University of Technology, Technicka 10, CZ-616 00 Brno, CZ<br />
Abstract<br />
There have been developing numerous analytical methods for the most sensitive detection<br />
of target molecules under the lowest demands on dimension, consumables and operation<br />
The one analytical technique that has many of the requisite characteristics to meet such a<br />
challenge is electroanalysis. Several electrochemical instruments have been constructed,<br />
tested and successfully used in space research. This short contribution will give you short<br />
overview of the most important ones.<br />
1. THE MARS ENVIRONMENTAL COMPATIBILITY ASSESSMENT (MECA)<br />
The MECA instrument was originally designed, built, and flight qualified for the<br />
2001 Mars Lander mission. The mission was subsequently cancelled due to the loss of the<br />
Mars Polar Lander in 1999. The MECA, and a newer version, the Robotic Chemical<br />
Analysis Laboratory (RCAL), have been proposed for the 2007 launch opportunity. MECA<br />
was designed to evaluate potential geochemical and environmental hazards to which<br />
future Mars explorers might be exposed and to return data that would help in<br />
understanding the geology, geochemistry, paleoclimate, and exobiology of Mars. The<br />
MECA instrument package contained wet chemistry laboratory, an optical and atomic<br />
force microscope, an electrometer to characterize the electrostatics of the soil and its<br />
environment, and an array of material patches to study the abrasive and adhesive<br />
properties of soil grains. Because of payload limitations, the entire MECA package was<br />
limited to amass of 10 kg, a peak power of 15 W, and a volume of 35 × 25 × 15 cm 3 . The<br />
development of MECA for analyzing the surface material in a remote hostile environment<br />
posed a unique set of challenges, especially for remote chemical analysis and more<br />
specifically for electrochemical analysis [1,2].<br />
2. THE CRYOSCOUT MARS INORGANIC CHEMICAL ANALYZER (MICA)<br />
CryoScout has been defined as a deep subsurface mission to the north polar cap of<br />
Mars, which will explore the stratigraphic record of recent climate change in the<br />
underlying layered terrain. A “cryobot” thermally driven probe will penetrate the ice to<br />
examine the borehole wall's stratigraphy and the chemistry of the melt water and<br />
entrained dust. Together with surface-station observations, these data will provide for a<br />
new understanding of the Martian polar meteorology; present climate and polar water<br />
exchange; recent polar volatile deposition and erosion; the scale, texture, structure, dust,<br />
and volatile content of subsurface layers; their accumulation rates; the origin of the<br />
entrained dust; the evolution of the polar cap; and the role of orbital variations in this<br />
evolution. These high scientific priority goals, and this type of probe and landing site,<br />
represent important contribution to the Mars and planetary exploration program [2].<br />
- 56 -
XI. Workshop of Physical Chemists and Electrochemists´11 Brno<br />
The “bubble“ of melt water that surrounds the cryobot while it descends will<br />
contain dissolved gases, dust, and soluble species extracted from the dust. The dust is<br />
derived from many sources, including ancient hydrothermal mineralization, chemical<br />
precipitation in lake beds, floodwaters episodically disgorged from the upper crust, or<br />
from moisture-driven mineral differentiation in the pedogenic surface. The MICA system<br />
is an electrochemically based flow-through variant of the MECA WCL. Similar to the<br />
MECA, the MICA will contain a similar array of sensors that will analyze the soluble<br />
components of the Martian dust by measuring a variety of ionic species and properties,<br />
including conductivity, pH, cations (sodium, potassium, magnesium, calcium, and<br />
ammonium using ISEs), anions (chloride, nitric and hydrochloric), metals (copper,<br />
cadmium, mercury and lead), reversible and irreversible oxidants in the melt water (using<br />
cyclic voltammetry), dissolved CO2, dissolved O2, oxidation reduction potential, and<br />
temperature [2].<br />
3. AN ELECTROCHEMICAL MICROBIAL GROWTH DETECTION SYSTEM<br />
(LIDA)<br />
Bacterial growth in culture media has typically been monitored optically, by<br />
measuring turbidity, or electrochemically, by conductivity, pH, or capacitance [3,4].<br />
Although never flown, several of these methods have been proposed for detection of<br />
extraterrestrial microbial life [5,6]. Optical turbidity does not appear to be a viable<br />
technique because of the problems associated with analyzing a particulate soil sample.<br />
Modifications have been proposed to resolve this dilemma [5], but very little is gained and<br />
the final results may still allow ambiguous interpretation. Even though more reliable, each<br />
of the electrochemical techniques by themselves may also be prone to interferences or<br />
ambiguous interpretation. However, we propose that integrating the conductivity, pH,<br />
and several ion selective electrodes as a sensor array and incorporating them into a<br />
multisample micro-laboratory will provide a reliable, robust, low-mass, and low-power<br />
device for monitoring microbial growth – the Life Detection Array (LIDA). LIDA is based<br />
on several crucial components, which ensure a definitive conclusion that changes in the<br />
growth chambers were biologically induced. These components include two chambers<br />
containing a differentially monitored pair of sensor arrays with one chamber for control<br />
and the other for the inoculation, a special sterilization and inoculation procedure, use of<br />
the local soil as a growth medium, and multiple replications. The chambers are identical<br />
and each contains sensors for conductivity, oxidation ± reduction potential (ORP), pH,<br />
sodium cations, potassium cations, calcium cations, magnesium cations, chloride anions<br />
and nitric anions. More sensors can be added but, as will be seen from our preliminary<br />
experiments, they may not be needed. Any global changes due to temperature, pressure,<br />
or soil chemistry should affect both chambers identically and thus the differential<br />
measurements will remain “zeroed” [1,2].<br />
4. ACKNOWLEDGEMENT<br />
The work was by NanoBioTECell GA ČR P102/11/1068.<br />
- 57 -
XI. Workshop of Physical Chemists and Electrochemists´11 Brno<br />
5. REFERENCES<br />
[1] S.R. Lukow, S.R. Kounaves, Electroanalysis 17 (2005) 1441.<br />
[2] S.P. Kounaves, Chemphyschem 4 (2003) 162.<br />
[3] M. Lanzanova, G. Mucchetti, E. Neviani, Journal of Dairy Science 76 (1993) 20.<br />
[4] R.E. Madrid, C.J. Felice, M.E. Valentinuzzi, Medical & Biological Engineering & Computing 37 (1999)<br />
789.<br />
[5] E.L. Merek, V.I. Oyama, Applied Microbiology 16 (1968) 724.<br />
[6] M.P. Silverman, E.F. Munoz, Applied Microbiology 28 (1974) 960.<br />
- 58 -
XI. Workshop of Physical Chemists and Electrochemists´11 Brno<br />
SPECTROPHOTOMETRIC ACID-BASE<br />
CHARACTERIZATION OF ADENINE<br />
ANALOGUES<br />
Pavel BUČEK 1 , Přemysl LUBAL 1 , Petra NETROUFALOVÁ 1 , Libuše TRNKOVÁ 1<br />
1 Department of Chemistry, Faculty of Science, Masaryk University, Brno.<br />
Abstract<br />
Purine based DNA/RNA bases adenine (6-aminopurine) and guanine (2-aminopurin-6one),<br />
serve in live bodies as building blocks of high physiological importance. For in vitro<br />
research applications they are replaced by 2-aminopurine and 2,6-diaminopurine. These<br />
aminopurines are used either “free” as replacements for adenine/guanine in nucleic acid<br />
strands or are subject to further derivatization and use (e.g. enzyme function research [1]).<br />
Despite their frequent use, very few is known about the substances’ physico-chemical<br />
properties. We studied acid-base properties of 2-aminopurine and 2,6-diaminopurine with<br />
use of advanced chemometric tools applied to UV/Vis spectroscopy data and since the 2aminopurine<br />
is highly fluorescent, fluorescence spectroscopy data, too.<br />
1. INTRODUCTION<br />
Beside the use as (fluorescent) replacements of original bases in DNA strands. 2aminopurine<br />
(2-AP) and 2,6-diaminopurine (2,6-DAP) are used for research purposes<br />
such as enzyme blockersChyba! Záložka není definována., enhanced bioavailability drugs<br />
[2] after further derivatization or agents against both severe and common viral diseases<br />
[3]. Despite various fields and quite numerous application of 2-AP and 2,6-DAP, data<br />
describing their acid-base properties are not almost available (Adenine about 40, 2,6-DAP<br />
about 4, 2-AP no papers – NIST database v. 7). Continuously increasing computing<br />
capacity of computers allows us to use advanced chemometric process high amounts of<br />
data (in this case spectra) almost real-time. We used the programs Equispec [4], a hardmodel-based<br />
routine for Matlab, and Opium.<br />
2. EXPERIMENT<br />
For experiment, acidic and basic solutions of aminopurines were used for acidobasic<br />
titration where concentration of both aminopurines was 0.1 mM. The measurements were<br />
carried out at temperature 25°C and ionic strength adjusted to 0,1M. The UV/Vis<br />
absorption and luminescence spectra were recorded after pH solution equilibration (Orion<br />
SA 720 pH meter with combined glass electrode) in 10mm path-length quartz cuvette on<br />
Agilent HP8452 A and Aminco Bowman series2 (excitation wavelength 295nm)<br />
spectrophotometers.<br />
Spectra were processed using standard MatLab routines and analyzed with Equispec<br />
program. Spectral data in form 3D matrix D (1D=wavelength,2D=absorbance,3D=pH)<br />
were decomposed according to equation (1) [5]: D=CS T +E (1) where C and S T are the data<br />
- 59 -
XI. Workshop of Physical Chemists and Electrochemists´11 Brno<br />
matrices of the distribution diagram and the pure spectra for each of the spectroscopic<br />
active conformations (species) present in the experiment. E represents the data matrix of<br />
residuals not associated with the proposed conformations in C and S T . Target of the<br />
analysis is to describe the system by the best possible way with C and S T while keeping the<br />
value of residuals‘ matrix E as low as possible. The hard-model approach to such data<br />
analysis is by defined chemical model of reaction which is kept by the program during<br />
calculation. The program then iteratively calculates the best results possible under given<br />
conditions, e.g. for acidobasic properties of 2-AP and 2,6-DAP we used only two types of<br />
constraints: estimates of the equilibrium constants and number of present species.<br />
3. RESULTS AND DISCUSSION<br />
For comparison of results, the UV/Vis and luminiscence spectral data were analyzed<br />
separately and also simultaneously. The values of protonation constants obtained by both<br />
techniques are almost the same. It means that ligand protonation does not have influence<br />
on excite state of ligand and it is taking place in ground state. The first pKa of 2-AP is<br />
lower while this value is higher for 2,6-DAP than parent Adenine. This fact is probably<br />
consequence of different polarity as was shown by HPLC of studied ligands on reverse<br />
stationary phase [6].<br />
Absorbance (A.U.)<br />
Absorbance (A.U.)<br />
0.8<br />
0.6<br />
0.4<br />
0.2<br />
2-AP UV/Vis spectra<br />
0<br />
250 300 350 400<br />
Wavelength (nm)<br />
1.5<br />
1<br />
0.5<br />
2,6-DAP UV/Vis spectra<br />
0<br />
250 300 350 400<br />
Wavelength (nm)<br />
Fig. 1: The experimental data for 2-AP (upper) and 2,6-DAP (lower) obtained<br />
by molecular absorption (left) and emission (right) spectroscopy.<br />
- 60 -<br />
Intensity (A.U.)<br />
Intensity (A.U.)<br />
3<br />
2<br />
1<br />
0<br />
2-AP emission spectra<br />
-1<br />
300 350 400<br />
Wavelength (nm)<br />
450 500<br />
0.2<br />
0.15<br />
0.1<br />
0.05<br />
0<br />
2,6-DAP emission spectra<br />
-0.05<br />
300 350 400 450 500<br />
Wavelength (nm)
XI. Workshop of Physical Chemists and Electrochemists´11 Brno<br />
4. CONCLUSION<br />
Acidobasic properties of widely used adenine analogues/derivatives were studied by<br />
means of UV/VIS and fluorescence spectroscopy combined with advanced chemometric<br />
data analysis. Both methods are useful for determination of protonation constants.<br />
5. ACKNOWLEDGEMENT<br />
The work has been supported by Ministry of Education of the Czech Republic<br />
(projects LC06035, ME09065, MUNI/A/0992/2009).<br />
6. REFERENCES<br />
[1] Sasaki, M., Ikeda, H., Sato, Y., Nakanuma, Y.: Free Radical Research, 42 (2008), 625<br />
[2] Arimili et al. - US patent no. 5922695<br />
[3] Tracerco Instruments - European Patent EP0343133<br />
[4] Dyson, R., Kaderli, S., Lawrence, G.A., Maeder, M., Zuberbühler, A.D.: Anal. Chim. Acta, 353<br />
(1997), 381<br />
[5] del Toro, M., Bucek, P., Avino, A., Jaumot, J., Gonzalez, C., Eritja, R., Gargallo, R.: Biochemie, 91<br />
(2009), 894<br />
[6] Kristova, P., Diploma Thesis, Masaryk University, Brno 2010.<br />
- 61 -
XI. Workshop of Physical Chemists and Electrochemists´11 Brno<br />
ROBOTIC MODULE EURYDICE<br />
Vojtěch ADAM 1 , Jaromír HUBÁLEK 2 , René KIZEK 1<br />
1 Mendel University in Brno, Zemedelska 1, CZ-613 00 Brno, CZ<br />
2 Brno University of Technology, Technicka 10, CZ-616 00 Brno, CZ<br />
Abstract<br />
The development of robotic module eurydice is focused on the development of a unique<br />
multi-purpose detector for detection and identification of dangerous pathogens. The<br />
multipurpose detector Eurydica uses the latest lab-on-a-chip nanobiotechnologies mainly<br />
based on the nanoparticles. The proposed detector will be controlled by our developed<br />
software, to which neural networks and artificial intelligence will be implemented with<br />
regard to do the most sensitive evaluation and processing of signals. Eurydica detector will<br />
be also implemented in the rescue robot Orpheus for use in situations threatening national<br />
security.<br />
1. NANOPARTICLES<br />
Generally, 200 nm is considered as an upper limit for the size of nanoparticles, while<br />
the minimal diameter should be about 10 nm. Certainly, nanoparticle properties<br />
requirements also depend on tumour characteristics including cancer type, stage of the<br />
disease, location in the body, tumour vascularisation and properties of the interstitial<br />
matrix or host species. These requirements are summarized in a review of Adiseshaiah et<br />
al. [1]. Nanoparticles designed for tumour targeted therapies consist of various<br />
components, in most cases from nanocarrier (in some literature called nanovector) and an<br />
active agent (drug) [2]. Drug-carrier nanoparticles are considered as submicroscopic<br />
colloidal systems that may act as a drug vehicles, either as nanospheres (matrix system in<br />
which the drug is dispersed) or nanocapsules (reservoirs in which the drug is confined in a<br />
hydrophobic or hydrophilic core surrounded by a single polymeric membrane) [3].<br />
Nanoparticle carriers are mostly composed of iron oxides, gold, biodegradable polymers,<br />
dendrimers, lipid based carriers such as liposomes and micelles, viruses (viral<br />
nanoparticles) and even organometallic compounds [4-6]. A detailed review about<br />
nanocarriers was recently published by Peer et al [7]. Several such engineered drugs are<br />
already in clinical practice, over 20 nanoparticle therapeutics have been approved by the<br />
FDA for clinical use including liposomal doxorubicin and albumin conjugate paclitaxel<br />
[8,9]. There was described that doxorubicin or paclitaxel nanoparticules drug delivery<br />
systems overcome chemoresistance with decreased side effects not only in experiment but<br />
also in clinical studies[10,11]. Micelles composed of pluronic polymers has been studied<br />
for its effect on multidrug reversion[12] and lipid-based nanoparticles offer a promising<br />
approach to the delivery of cytostatics that pass though blood brain barrier for brain<br />
tumours and brain metastases therapy [13]. However, the potential success of these<br />
particles in the clinical application relies on the consideration of above mentioned<br />
important parameters, most importantly, minimum toxicity of the carrier itself [14].<br />
Concerning the nanoparticle shape, following nanostructures are frequently cited in<br />
- 62 -
XI. Workshop of Physical Chemists and Electrochemists´11 Brno<br />
literature: nanoshells, nanorods, nanocages, nanocubes or nanotubes. Nanoparticles have<br />
the ability to treat as well as to diagnose the disease therefore a new term “theranostic<br />
nanoparticles” (therapeutic and diagnostic) is currently commonly used in the<br />
literature.[15-18] Magnetic nanoparticles are well-established elements that offer<br />
controlled size, ability to be manipulated externally, and enhancement of contrast in<br />
magnetic resonance imaging (MRI). Therefore, these nanoparticles could have many<br />
applications in biology and medicine, including drug delivery [16,19-22], and medical<br />
imaging [23-29]. Particularly iron-based nanoparticles have been used as therapeutic<br />
agents with specific application as contrasting agents for MRI and magnetically targeted<br />
drug delivery to the tumour cell. Imunomagnetic nanoparticules can be used for positive<br />
or negative selection of cells used for cell therapy and their presence on transplanted cells<br />
can be used as a magnetic cell label for in vivo cell visualization by MRI[30]. Iron oxides<br />
have several crystalline polymorphs known as hematite, maghemite and magnetite<br />
(Fe3O4) and some others. However, only maghemite and magnetite found the interest in<br />
bioapplications. Numerous procedures of the MNPs synthesis have widely been studied<br />
and different synthetic mechanisms have been established over past decades. The most<br />
popular methods, such as co-precipitation, microemulsion, flame-assisted thermal<br />
decomposition, etc. are based on chemical principles. Co-precipitation of Fe 3+ and Fe 2+<br />
salts is a classical method used to prepare iron oxide NPs. Reaction temperature, pH and<br />
precursor type; have to be precisely optimized to control NP morphology, size, and<br />
quantity. Other methods based on physical principles including mechanical grinding,<br />
biopolymerization processes, gel templating and solvent-free methods such as chemical<br />
vapour deposition (CVD), electrical explosion and mechanical milling have been reported.<br />
CVD, mechanical milling and other solvent-free methods are especially useful for the<br />
synthesis of other interesting materials such as NdFeB and carbon nanotubes for which<br />
there are no established “wet” synthesis routes. To date, NPs prepared by CVD have been<br />
used almost exclusively for heterogeneous catalysis, magnetic data storage and<br />
nanoelectronic devices rather than biomedicine.[31] In comparison with physical<br />
methods and biopolymerization processes, the chemical methods especially the solution<br />
based synthetic routes are generally more suitable for superparamagnetic MNPs for MRI<br />
due to the controlled parameters such as particle size, size distribution and purity. To<br />
meet the requirements of biocompatibility and desired functionality the surface<br />
modification is a key step for MNP applications. It is provided by coating of MNP surface<br />
by biocompatible layer enabling further interaction with functional coating.<br />
Functionalization of the nanoparticle surface with DNA fragments is used for gene<br />
therapy as more safe alternative to commonly used viral vectors.[32,33] Genetic material<br />
such as DNA plasmids, RNA and/or siRNA can be encapsulated inside or conjugated to the<br />
surface of the nanoparticle. In bionanotechnology, specific functions of proteins such as<br />
antibody-antigen detection and receptor-substrate recognition such as the biotin-avidin<br />
interaction are very valuable. Proteins can be incorporated into NPs during the<br />
coprecipitation step. More sophisticated bioconjugation techniques are desirable to assure<br />
that the biomolecule is bound to the NP surface in correct orientation and biological<br />
activity is preserved [34-43]. Both natural as well as synthetic peptide ligands have<br />
- 63 -
XI. Workshop of Physical Chemists and Electrochemists´11 Brno<br />
potential for the NP stabilization and biofunctionalisation. Besides targeted drug delivery,<br />
imaging of all kinds is an extremely important field of nanoparticle application.<br />
2. BIOSENSORS BASED ON THE PARTICLES<br />
Detection. Human population is globally threatened by expansive pandemics caused<br />
by viruses particularly HIV, HBA, HBV, HBC and influenza viruses. All these viral<br />
diseases are distinguished by the rapid spreading in population, considerable morbidity<br />
and also mortality. Approximately 5% of the world population is infected by the hepatitis<br />
B virus (HBV) and more than 10% by the hepatitis A virus that cause a<br />
necroinflammatory liver disease of variable duration and severity. Chronically infected<br />
patients with active liver disease carry a high risk of developing cirrhosis and<br />
hepatocellular carcinoma. Diagnostic possibilities are relatively limited till now and they<br />
are focused in the direct cultural proof of identity or they result from the detection of<br />
viral antigen by the use of antibodies or of antiviral antibodies. All above mentioned<br />
methods are expensive and time consuming - cultivation, detection of viral antigens or are<br />
not so specific - antiviral antibodies. Detection of viral nucleic acid presence in biological<br />
sample represents another approach in the therapeutic strategy. Isolation of nucleic acid<br />
by magnetic beads is widely used method of extraction for complex biological sample.<br />
Magnetic particles responding to an external magnet field are providing an elegant<br />
method of separation of targeted molecule from the solution. Taking advantage of their<br />
magnetic characteristic and low cost of synthesis, magnetic particles (MPs) have been<br />
widely used as a universal separation tool for biologically active compounds such as<br />
nucleic acids (i.e., DNA and RNA), proteins and peptides, as well as intact cells [44].<br />
Magnetic particles have been explored in many other biomedical and bioengineering<br />
applications including magnetic resonance imaging (MRI), tissue repairing, detoxification<br />
of biological fluids, drug delivery, magnetic hyperthermia and chemotherapeutic agents’<br />
delivery. Miniaturization has become an important factor in all areas of modern society,<br />
reflected strongly in scientific research. Particularly in chemistry, new direction was<br />
given a in the 1990s when lab-on-a-chip and micro-total analysis approach was<br />
introduced. Nowadays, microfluidics is a thriving multidisciplinary area. Integration of<br />
the sample preparation procedure straight to the analytical process is increasing the<br />
analytical throughput and therefore decreasing the analysis time as well as its costs. In line<br />
with the general trend in miniaturization utilizing microfluidic chips has been gaining<br />
popularity especially due to their advantages including extremely low consumption of<br />
samples as well as other chemical compounds, ultrafast separations and/or in many cases<br />
cost effective mass fabrication of disposable chips.<br />
3. ACKNOWLEDGEMENT<br />
The work was by NanoBioTECell GA ČR P102/11/1068.<br />
4. REFERENCES<br />
[1] P.P. Adiseshaiah, J.B. Hall, S.E. McNeil, Wiley Interdiscip. Rev.-Nanomed. Nanobiotechnol. 2 (2010)<br />
99.<br />
[2] M. Ferrari, Nat. Rev. Cancer 5 (2005) 161.<br />
[3] L. Juillerat-Jeanneret, Drug Discov. Today 13 (2008) 1099.<br />
- 64 -
XI. Workshop of Physical Chemists and Electrochemists´11 Brno<br />
[4] F.X. Gu, R. Karnik, A.Z. Wang, F. Alexis, E. Levy-Nissenbaum, S. Hong, R.S. Langer, O.C. Farokhzad,<br />
Nano Today 2 (2007) 14.<br />
[5] K.J. Cho, X. Wang, S.M. Nie, Z. Chen, D.M. Shin, Clin. Cancer Res. 14 (2008) 1310.<br />
[6] B. Mishra, B.B. Patel, S. Tiwari, Nanomed.-Nanotechnol. Biol. Med. 6 (2010) 9.<br />
[7] D. Peer, J.M. Karp, S. Hong, O.C. FaroKhzad, R. Margalit, R. Langer, Nat. Nanotechnol. 2 (2007) 751.<br />
[8] B. Haley, E. Frenkel, Urol. Oncol.-Semin. Orig. Investig. 26 (2008) 57.<br />
[9] R.K. Jain, T. Stylianopoulos, Nature Reviews Clinical Oncology 7 (2010) 653.<br />
[10] Y.Z. Wang, L. Yu, L.M. Han, X.Y. Sha, X.L. Fang, International Journal of Pharmaceutics 337 (2007)<br />
63.<br />
[11] M.E.R. O'Brien, N. Wigler, M. Inbar, R. Rosso, E. Grischke, A. Santoro, R. Catane, D.G. Kieback, P.<br />
Tomczak, S.P. Ackland, F. Orlandi, L. Mellars, L. Alland, C. Tendler, C.B.C.S. Grp, Annals of<br />
Oncology 15 (2004) 440.<br />
[12] T. Minko, E.V. Batrakova, S. Li, Y.L. Li, R.I. Pakunlu, V.Y. Alakhov, A.V. Kabanov, Journal of<br />
Controlled Release 105 (2005) 269.<br />
[13] J.L. Arias, B. Clares, M.E. Morales, V. Gallardo, M.A. Ruiz, Curr. Drug Targets in press (2011).<br />
[14] A. Puri, K. Loomis, B. Smith, J.H. Lee, A. Yavlovich, E. Heldman, R. Blumenthal, Crit. Rev. Ther.<br />
Drug Carr. Syst. 26 (2009) 523.<br />
[15] M.Z. Ahmad, S. Akhter, G.K. Jain, M. Rahman, S.A. Pathan, F.J. Ahmad, R.K. Khar, Expert Opinion<br />
on Drug Delivery 7 (2010) 927.<br />
[16] M.S. Bhojani, M. Van Dort, A. Rehemtulla, B.D. Ross, Molecular Pharmaceutics 7 (2010) 1921.<br />
[17] S.M. Janib, A.S. Moses, J.A. MacKay, Advanced Drug Delivery Reviews 62 (2010) 1052.<br />
[18] J. Xie, S. Lee, X.Y. Chen, Advanced Drug Delivery Reviews 62 (2010) 1064.<br />
[19] J. Chomoucka, J. Drbohlavova, D. Huska, V. Adam, R. Kizek, J. Hubalek, Pharmacological Research<br />
62 (2010) 144.<br />
[20] D.K. Kim, J. Dobson, Journal of Materials Chemistry 19 (2009) 6294.<br />
[21] B.P. Timko, T. Dvir, D.S. Kohane, Advanced Materials 22 (2010) 4925.<br />
[22] O. Veiseh, J.W. Gunn, M.Q. Zhang, Advanced Drug Delivery Reviews 62 (2010) 284.<br />
[23] C. Fang, M.Q. Zhang, Journal of Materials Chemistry 19 (2009) 6258.<br />
[24] U.A. Gunasekera, Q.A. Pankhurst, M. Douek, Targeted Oncology 4 (2009) 169.<br />
[25] M.A. Hahn, A.K. Singh, P. Sharma, S.C. Brown, B.M. Moudgil, Analytical and Bioanalytical<br />
Chemistry 399 (2011) 3.<br />
[26] S. Laurent, S. Boutry, I. Mahieu, L. Vander Elst, R.N. Muller, Current Medicinal Chemistry 16 (2009)<br />
4712.<br />
[27] S. Lee, J. Xie, X.Y. Chen, Biochemistry 49 (2010) 1364.<br />
[28] S.K. Nune, P. Gunda, P.K. Thallapally, Y.Y. Lin, M.L. Forrest, C.J. Berkland, Expert Opinion on Drug<br />
Delivery 6 (2009) 1175.<br />
[29] R.R. Qiao, C.H. Yang, M.Y. Gao, Journal of Materials Chemistry 19 (2009) 6274.<br />
[30] P. Jendelova, V. Herynek, L. Urdzikova, K. Glogarova, S. Rahmatova, I. Fales, B. Andersson, P.<br />
Prochazka, J. Zamecnik, T. Eckschlager, P. Kobylka, M. Hajek, E. Sykova, Cell Transplantation 14<br />
(2005) 173.<br />
[31] N.T.K. Thanh, L.A.W. Green, Nano Today 5 (2010) 213.<br />
[32] J. Dobson, Gene Therapy 13 (2006) 283.<br />
[33] Z.G. Xue, D.S. Liang, Y.M. Li, Z.G. Long, D.A. Pan, X.H. Liu, L.Q. Wu, S.H. Zhu, F. Cai, H.P. Dai,<br />
B.S. Tang, K. Xia, J.H. Xia, Chinese Science Bulletin 50 (2005) 2323.<br />
[34] Y.Q. Ji, Y.T. Hu, Q. Tian, X.Z. Shao, J.Y. Li, M. Safarikova, I. Safarik, Separation Science and<br />
Technology 45 (2010) 1499.<br />
[35] K. Kluchova, R. Zboril, J. Tucek, M. Pecova, L. Zajoncova, I. Safarik, M. Mashlan, I. Markova, D.<br />
Jancik, M. Sebela, H. Bartonkova, V. Bellesi, P. Novak, D. Petridis, Biomaterials 30 (2009) 2855.<br />
[36] E. Mosiniewicz-Szablewska, M. Safarikova, I. Safarik, Journal of Nanoscience and Nanotechnology 10<br />
(2010) 2531.<br />
[37] I. Safarik, M. Safarikova, Journal of Chromatography B 722 (1999) 33.<br />
[38] I. Safarik, M. Safarikova, Chemical Papers 63 (2009) 497.<br />
- 65 -
XI. Workshop of Physical Chemists and Electrochemists´11 Brno<br />
[39] I. Safarik, M. Safarikova, in H. Yamaguchi (Editor), 12th International Conference on Magnetic<br />
Fluids Icmf12, 2010, p. 274.<br />
[40] M. Safarikova, L. Ptackova, I. Kibrikova, I. Safarik, Chemosphere 59 (2005) 831.<br />
[41] M. Safarikova, I. Roy, M.N. Gupta, I. Safarik, Journal of Biotechnology 105 (2003) 255.<br />
[42] M. Safarikova, I. Safarik, Letters in Applied Microbiology 33 (2001) 36.<br />
[43] H. Yavuz, A. Denizli, H. Gungunes, M. Safarikova, I. Safarik, Separation and Purification Technology<br />
52 (2006) 253.<br />
[44] E. Palecek, M. Fojta, Talanta 74 (2007) 276.<br />
- 66 -
XI. Workshop of Physical Chemists and Electrochemists´11 Brno<br />
CHEMORESITANCE OF CANCER CELLS-<br />
MODELS FOR STUDY IN VITRO AND IN VIVO<br />
Tomáš ECKSCHLAGER 1 , Jan HRABĚTA 1 , M.A.RAHMAN 1 , Jitka POLJAKOVÁ 2 , Marie<br />
STIBOROVÁ 2<br />
1 Department of Pediatric Hematology and Oncology, 2 nd Medical School, Charles University and University<br />
Hospital Motol, V Úvalu 84, 150 06 Prague 5, Czech Republic<br />
2 Department of Biochemistry, Faculty of Science, Charles University, Albertov 2030, 128 40 Prague 2, Czech<br />
Republic<br />
Abstract<br />
Cancer is one of the main causes of death in developed countries. Resistance to cytostatics<br />
is a major cancer therapy problem. The behaviour may be explained by a selection of<br />
subclones within tumor that have the ability to survive the cytotoxic effects of cytostatics.<br />
At the cellular level, a number of resistance mechanisms operate. They include drug efflux<br />
via membrane pumps, failure to activate a prodrug, alteration in the abundance of the<br />
target protein, mutation of the target protein and/or inactivation of apoptotic pathways.<br />
Other causes of chemoresitance are hypoxia or increased number of cancer stem cells<br />
(CSC). Hypoxia enhances resistance to chemotherapy. Some studies demonstrated that<br />
hypoxia-induced chemoresistance is through the HIF pathway. CD133+ cells (CSC) are<br />
more resistant to some chemotherapeutics compared to CD133- cells. We discuss our<br />
experience with resistant neuroblastoma cell lines, with chemoresistance induced by<br />
hypoxia and with CSC.<br />
Introduction<br />
The development of resistance to cytostatic agents is a major cancer therapy problem<br />
and has been the focus of many research efforts [1]. Tolerance to one agent is often<br />
accompanied by cross-resistance to a variety of others, often unrelated compounds. The<br />
behaviour may be explained by a selection of subclones of cells within the original tumor<br />
that have the ability to survive the cytotoxic effects of anticancer drugs [1]. The<br />
description of chromosomal aberrations in resistant tumors is an clue in the identification<br />
of genes participating in chemoresistance.<br />
At the cellular level, a number of resistance mechanisms can operate. These<br />
mechanisms include drug efflux via membrane pumps (ABC transportes such as Pglycoprotein),<br />
drug metabolism, including inactivation or failure to activate a prodrug,<br />
alteration in the abundance of the target protein, for example the topoisomerase II<br />
enzyme, mutation of the target protein and/or inactivation of pathways leading to cell<br />
death, such as apoptotic signaling [1, 2].<br />
Neuroblastoma /NBL/ is the third most common pediatric cancer and is responsible<br />
for approximately 15% of all childhood cancer deaths [1]. It is a malignant tumor<br />
consisting of neuronal crest derived undifferentiated neuroectodermal cells. The clinical<br />
hallmark of NBL is heterogeneity. Some of the tumors undergo spontaneous regression or<br />
- 67 -
XI. Workshop of Physical Chemists and Electrochemists´11 Brno<br />
differentiate into benign ganglioneuromas, some are curable with surgery and little or no<br />
adjuvant therapy and some progress despite intensive multimodal therapy. This clinical<br />
diversity is closely correlated with the molecular biological features of the tumor. Among<br />
the most prominent are MYCN amplification, gain of 17q, loss of 1p36.2-36.3, loss of<br />
11q23 and less frequently, gains at 2p, 3q 4q and 6p and losses at 14q, 3p, 4p, 5q, 9p and<br />
18q. Tumors with 1p loss often have MYCN amplification and highly malignant clinical<br />
behavior<br />
5. METHODS<br />
The NBL cell lines UKF-NB-2, UKF-NB-3 and UKF-NB-4 were established from<br />
bone marrow metastases of high risk neuroblastoma harvested at relapse in three patients.<br />
The Vincristin, Doxorubicin, Cisplatin and Ellipticine resistant cell sublines designated<br />
UKF-NB-2 VCR , UKF-NB-2 DOX , UKF-NB-2 CDDP , UKF-NB-3 VCR , UKF-NB-3 DOX , UKF-NB-3 CDDP ,<br />
UKF-NB-4 VCR , UKF-NB-4 DOX and UKF-NB-4 CDDP were established by incubation of<br />
parental cells with increasing concentrations of the respective drug. Examination by<br />
fluorescent in situ hybridization (FISH), comparative genomic hybridization (CGH), MTT<br />
tests in normoxic and hypoxic (1% O2) conditions<br />
6. RESULTS AND DISCUSSION<br />
Analysis of our results suggests that chemoresistance is a very complex phenomenon<br />
and those multiple gains and losses indicate that drug resistance is thought to be mediated<br />
through multiple complementary pathways. Drug resistance to Doxorubicin and<br />
Vincristin was mediated not only by over expression of the MDR1 gene, but also by<br />
amplification of the gene [3]. In the cell line UKF-NB-4 where amplification on<br />
chromosome 7 occurred in the parental cell line the drug resistant daughter cell line had<br />
even greater amplification in the region where the MDR1 gene is located. Cell lines<br />
resistant to CDDP did not show any amplification of the MDR1 gene, which corresponds<br />
with YASUNO et al findings [4]. We found in neuroblastoma cells resistant to CDDP but<br />
not in sensitive ones metallothionein overexpression which was induced by cisplatin or<br />
carboplatin. We described that UKF-NB-4 CDDP cells lost MYCN gene copies in comparison<br />
to UKF-NB-4 [4].<br />
MTT tests that compared effect of cytostatics (CDDP, Ellipticine) in normoxia and<br />
hypoxia resulted in a decrease in toxicity to NBL cells both sensitive and resistant to<br />
respective drug. It correlated with lower levels of DNA adducts in experiments with<br />
ellipticine [5].<br />
It has been demonstrated that CD133+ cells (cancer stem cells) are more resistant to<br />
hypoxia, irradiations and some chemotherapeutics compared to CD133- cells [6].<br />
7. CONCLUSIONS<br />
Taken together, we showed that the treatment of NBL cells with cytostatics resulted<br />
in development of drug resistance. We have seen that in addition to epigenetic<br />
mechanisms, the acquired karyotypic changes in NBL may lead to up and down<br />
modulation of genes related to drug resistance. The established cell sublines provide a<br />
- 68 -
XI. Workshop of Physical Chemists and Electrochemists´11 Brno<br />
useful model that can be used to examine and characterize signaling mechanisms that<br />
account for induced resistance to cytostatics. Moreover, new chemotherapeutic strategies<br />
for overcoming drug resistance in malignant cells may be tested using chemoresistant<br />
sublines.<br />
8. REFERENCES<br />
Supported by GACR P301/10/0356.<br />
9. ACKNOWLEDGEMENT<br />
1. GOLDIE JH, COLDMAN AJ. Drug resistance in cancer. Mechanisms and models. Cambridge: Cambridge<br />
University Press, 1998<br />
2. POLAND J, SCHADENDORF D, LAGE H et al. Study of therapy resistance in cancer cells with functional<br />
proteome analysis. Clin Chem Lab Med 2002; 40: 221–234.<br />
3. BEDRNICEK J, VICHA A, JAROSOVA M et al. Characterization of drug-resistant neuroblastoma cell<br />
lines by comparative genomic hybridization. Neoplasma. 2005;52:415-9<br />
4.YASUNO T, MATSUMURAT, SHIKATAT et al. Establishment and characterization of a cisplatin-resistant<br />
human neuroblastoma cell line. Anticancer Res 1999;19: 4049–4057<br />
4. PROCHAZKA P, HRABETA J, VÍCHA A, ECKSCHLAGER T. Expulsion of amplified MYCN from<br />
homogenously staining chromosomal regions in neuroblastoma cell lines after cultivation with<br />
cisplatin, doxorubicin, hydroxyurea, and vincristine. Cancer Genet Cytogenet. 2010;196:96-104<br />
5. POLJAKOVÁ J, ECKSCHLAGER T, HRABETA J et al.The mechanism of cytotoxicity and DNA adduct<br />
formation by the anticancer drug ellipticine in human neuroblastoma cells. Biochem Pharmacol.<br />
2009;77:1466-79<br />
6. VANGIPURAM SD, WANG ZJ, LYMAN WD. Resistance of stem-like cells from neuroblastoma cell lines<br />
to commonly used chemotherapeutic agents. Pediatr Blood Cancer. 2010;54:361-8<br />
- 69 -
XI. Workshop of Physical Chemists and Electrochemists´11 Brno<br />
PROCESSING OF ELECTROCHEMICAL<br />
SIGNALS FOR DETERMINATION OF<br />
METALLOTHIONEIN CONCENTRATION<br />
Vladimíra KUBICOVÁ 1 , Petr MAJZLÍK 2 , Ivo PROVAZNÍK 1 , Martin VALLA 1 , René<br />
KIZEK 2<br />
1 Department of Biomedical Engineering, Faculty of Electrical Engineering and Communication, Brno<br />
University of Technology, Kolejni 4,CZ 612 00 Brno, Czech Republic<br />
2 Department of Chemistry and Biochemistry, Faculty of Agronomy, Mendel University in Brno,<br />
Zemedelska 1, CZ 613 00 Brno, Czech Republic<br />
Abstract<br />
Metallothioneins are the low molecular weight proteins localized to the membrane of the<br />
Golgi apparatus. The function of metallothioneins is not clear, but experimental data<br />
suggests the connection of metallothioneins with many diseases. Automated<br />
electrochemical detection allows analyzing of metallothioneins in the very small volume<br />
with the excellent sensitivity, reliability and reproducibility. The main aim of this work is<br />
to process electrochemical catalytic signals and to calculate the height of a peak in the<br />
signal, which corresponds with the concentration of metallothioneins in the substance.<br />
1. INTRODUCTION<br />
Metallothioneins (MT) belong to the group of the intracellular proteins and they<br />
were discovered in 1957, when Margoshes and Valee isolated them from the horse kidney<br />
[1]. The main role of MTs is probably the homeostatic control and the detoxification of<br />
metal ions in an organism. MTs are divided into classes (isoforms) depending on their<br />
primary structure and organism, in which they were isolated [2]. The MT-I isoform<br />
includes the mammalian metallothioneins built from 61 aminoacids. The synthesis of<br />
human MT may be inducted by the increasing metals concentration. Relation between<br />
the concentration of MT and carcinogenesis, spontaneous mutagenesis and the<br />
participation in the mechanics of the action of anti-tumour drugs and pharmaceutical<br />
products was proved. Overexpression of MTs is under investigation as a new diagnostic<br />
and prognostic marker in many types of malignant tumors [3].<br />
There are several ways how to determinate the amount of MTs in a specimen<br />
described in literature: Cd-hem method, enzyme-linked immunosorbent assay, method<br />
based on the detection of mRNA, capillary zone electrophoresis, electrochemical<br />
determination and others [4]. The electrochemical determination is based on the catalytic<br />
processes which proceed at the negative potentials on mercury electrodes. These processes<br />
are accompanied by evolution of hydrogen from the supporting electrolyte components. It<br />
was found that –SH groups present in MTs are responsible for catalytic processes [5]. For<br />
the determination of the concentration of the substances which involve –SH groups is<br />
used Brdicka procedure. This method is very sensitive because of catalytic process and<br />
thus it allows determination of nanomolar concentration. The Brdicka solution contains<br />
- 70 -
XI. Workshop of Physical Chemists and Electrochemists´11 Brno<br />
Co(NH3)6Cl3 complex and ammonia buffer (NH4Cl + NH4OH) [6]. The determination of<br />
MT realizes at potentials from -1.9 V to 0 V. The proteins are represented polarographic<br />
peaks in the resulting voltammogram. Height of the first peak represents concentration of<br />
MT. The concentration of Co(NH3)6 has to be sufficient towards the concentration of MTs.<br />
If this condition is fulfilled, then the height of the peak will be linearly dependent on the<br />
concentration of MTs. The shape of the catalytic signal curve depends on the number of<br />
cysteines in the MT molecule, the size of this molecule and its concentration [5].<br />
2. EXPERIMENT<br />
The signals for the analysis were obtained by Brdicka procedure using the<br />
differential pulse voltammetry (DPV) and adsorptive transfer stripping technique (AdTS).<br />
The measurement of each specimen was making four or five times and the results of each<br />
analysis were exported to a pure text file (extension *.txt). The algorithm described in this<br />
paper was created and verified in the Matlab computing environment (MathWorks, Inc.,<br />
USA). The aim of the algorithm is to calculate the height of the peak which represents<br />
concentration of MT.<br />
3. RESULTS AND DISCUSSION<br />
Measured signals represent the dependence of the current on the voltage in the form<br />
of voltammograms. To calculate the height of the peak, positions of voltammogram<br />
minima must be identified. Height of the peak is defined as maximum vertical distance<br />
between the signal curve and the line which is created by connection of two detected<br />
surrounding minima (see Figure 1).<br />
Measured signals were interpolated using cubic splines for improved detection of the<br />
minima. It is based on the observation that if each pair of knots is connected by a cubic<br />
curve, the second derivative within each interval is a straight line. Samples of the signal in<br />
equal distances were obtained by interpolation and it allowed further processing. The<br />
interpolated signals were not smooth enough. It caused a number of false detections<br />
resulted in errors of peak height determination. To improve quality of detection, the<br />
interpolated signals were filtered by a digital FIR filter (low-pass filter). The output of this<br />
filter is a weighted sum of the current and a finite number of previous values of the input.<br />
The filter was experimentally designed with the most suitable filter order of 500. Cutoff<br />
frequency of the filter was 25 V -1 (the sampling frequency was calculated by interpolation<br />
step and it was equal to 1000 V -1 ).<br />
The minima were detected from the interpolated and filtered signal close to the<br />
voltage -1.65 V and -1.4 V. Every sample was measured five or more times. The height of<br />
the peak for every sample was calculated by two methods:<br />
1. An average signal was calculated and for this signal the height of the peak was<br />
found out,<br />
2. The height of the peak was found out for every measured signal and then the<br />
average height was calculated.<br />
For described algorithm, the user interface was created and it allowed changing the<br />
computation parameters e.g. order filter and cutoff frequency (see Figure 2). The results of<br />
- 71 -
XI. Workshop oof<br />
Physical Cheemists<br />
and Electrochemists´11<br />
the analyssis<br />
– calculaated<br />
heights s (voltage) and their locations<br />
(cu urrent) – wwere<br />
export ted to<br />
an Excel ffile.<br />
The pprogram<br />
wa as tested oon<br />
94 signa als and the e detectionn<br />
efficiency y was<br />
98.9 % in the case of the me ethod basedd<br />
on evalu uation of averaged a siignal.<br />
Dete ection<br />
efficiency was slightlly<br />
lower for r the secondd<br />
method ( less than 1 %).<br />
Fig. 1:<br />
The expla anation of tthe<br />
calculat tion of the peak p heightt<br />
Fig. 2: Thhe<br />
graphicaal<br />
user inte erface, the example of o the win ndow for ssetting<br />
filtr ration<br />
parameterrs<br />
- 72 -<br />
Brno
XI. Workshop of Physical Chemists and Electrochemists´11 Brno<br />
4. CONCLUSION<br />
The designed and realized program can detect and calculate the height of the peak in<br />
voltammogram. Detection efficiency was 98.9 %. The height was calculated by two<br />
methods and these results were similar (difference around 1 %). The graphical user<br />
interface allowed changing the calculation parameters for optimization of the method<br />
efficiency. Results of analysis can be exported into MS Excel file (extension *.xls) for<br />
further processing. The automated detection of the height of the peak and the calculation<br />
of the concentration of MT can be applied in diagnostics of diseases, in which MT may<br />
play role.<br />
5. ACKNOWLEDGEMENT<br />
This work was supported by GAČR 102/09/H083, GAČR P102/11/1068.<br />
6. REFERENCES<br />
[1] Margoshes M., Vallee B.: Chem. Soc. (1957), 4813, 79<br />
[2] Kojima Y.: Methods Enyzmol (1991), 205, 8-10<br />
[3] Krizkova S., Blahova P.: Comparison of metallothioneins detection by using Brdicka reaction and<br />
enzyme-linked immunosorbent assay employing chicken yolk antibodies, Electroanalysis, 21 (2009),<br />
2575-2583<br />
[4] Petrlová J., Svoboda M.: Přehled Analytických metod pro stanovení metalothioneinu v tkáních. XXX.<br />
Brněnské onkologické dny a XX. Konference pro sestry a laboranty, 2006, 187.<br />
[5] Vacek, J., Trnkova, L., Jelen, F. and Kizek, R.: Electrochemical determination of cysteine-containing<br />
biomolecules by means of catalytic reactions on a mercury electrode. In Kokkinidis, G. (ed.), ISE<br />
Annual meeting. International Society of Electrochemistry (2004), Vol. 55<br />
[6] Brdicka, R.: Coll.Czech. Chem. Commun., 5 (1933), 148-164<br />
- 73 -
XI. Workshop of Physical Chemists and Electrochemists´11 Brno<br />
STRUCTURE AND MAGNETISM OF CLEAN<br />
AND IMPURITY-DECORATED GRAIN<br />
BOUNDARIES IN NICKEL FROM FIRST<br />
PRINCIPLES<br />
Monika VŠIANSKÁ 1,2,3 , Mojmír ŠOB 1,2,3<br />
1 Department of Chemistry, Faculty of Science, Brno, Czech Republic<br />
2 Central European Institute of Technology, CEITEC MU, Masaryk University, Brno, Czech Republic<br />
3 Institute of Physics of Materials, Academy of Sciences of the Czech Republic, Brno, Czech Republic<br />
Abstract<br />
We present a detailed theoretical study of segregation and strengthening/embrittling<br />
energy of sp-elements from the 3rd, 4th and 5th period (Al, Si, P, S, Ga, Ge, As, Se, In, Sn,<br />
Sb and Te) at the Σ5(210) grain boundary (GB) in fcc ferromagnetic nickel. Whereas there<br />
is a slight enhancement of magnetization at the clean GB and FS with respect to bulk<br />
nickel (3–7% and 24%, respectively), the studied impurities entirely kill or strongly<br />
reduce ferromagnetism at the GB and in its immediate neighbourhood so that<br />
magnetically dead layers are formed. We determine the preferred segregation sites at the<br />
Σ5(210) GB for the sp-impurities studied, their segregation enthalpies and<br />
strengthening/embrittling energies with their decomposition into the chemical and<br />
mechanical components. We find interstitially segregated Si as a GB cohesion enhancer,<br />
substitutionally segregated Al and interstitially segregated P with none or minimum<br />
strengthening effect and interstitially segregated S, Ge, As, Se and substitutionally<br />
segregated Ga, In, Sn, Sb and Te as GB embrittlers in nickel. As there is very little<br />
experimental information on GB segregation in nickel most of the present results are<br />
theoretical predictions which may motivate future experimental work.<br />
1. INTRODUCTION<br />
Grain boundaries (GB) represent an important class of two-dimensional extended defects<br />
and macroscopic strength of polycrystalline materials depends strongly on GB cohesion. It<br />
was found that the impurities in ppm concentration can drastically change material<br />
properties. Intergranular embrittlement which is usually associated with segregation of<br />
impurities on the GB can result in a dramatic reduction of the ductility and strength. The<br />
purpose of the present research is to advance our fundamental understanding of structure,<br />
magnetism and embrittlement of impurity-segregated grain boundaries (GB) in<br />
ferromagnetic nickel.<br />
2. METHODS<br />
Spin-polarized electronic structure calculations were performed within the density<br />
functional theory using the Vienna ab-initio Simulation Package (VASP). The studied<br />
Σ5(210) GB was modelled by rotating two fcc grains around the [001] axis by 36.9°. It was<br />
- 74 -
XI. Workshop of Physical Chemists and Electrochemists´11 Brno<br />
represented by a supercell containing 60 nonequivalent atoms with two equivalent,<br />
reversely oriented GBs. Substitutional impurity atoms were considered to occupy the<br />
whole GB plane. Interstitial impurity atoms were placed in larger spaces at the GBs<br />
capable to accommodate them {1}.<br />
3. RESULTS AND DISCUSSION<br />
The effect of segregated impurities on GB magnetism in nickel is illustrated in Fig. 1<br />
[1]. It may be seen that except of case of sulphur, the magnetic moments of nickel atoms<br />
adjacent to the substitutionally segregated impurities are reduced to about 1/3–2/3 of the<br />
bulk value. In case of most substitutionally segregated impurities from the 3rd and 4th<br />
period, the nickel atoms in the 3rd layer have even a lower magnetic moment than those<br />
in the 2nd layer (in the immediate neighbourhood of the impurity layer). In more distant<br />
layers, the magnetic moments mostly increase and reach the bulk value from the 6th layer<br />
on. Much stronger reduction of nickel magnetic moments may be observed for<br />
interstitially segregated impurities (Fig. 1). Except of interstitially segregated Al, Ga and<br />
In, the magnetic moments of the nickel atoms lying in the GB layer are reduced nearly to<br />
zero (
XI. Workshop oof<br />
Physical Cheemists<br />
and Electrochemists´11<br />
Fig. 1. Local maagnetic<br />
moments<br />
for GGB<br />
and FS with segregated<br />
impuurities<br />
as well w as<br />
for isolatedd<br />
impuritiees<br />
(the righ ht column) in nickel. For comparison,<br />
the rresults<br />
for clean<br />
GB, FS and<br />
unperturrbed<br />
bulk are a also inccluded.<br />
Mag gnetic mom ments inducced<br />
on imp purity<br />
atoms are denoted byy<br />
the full symbols, s emmpty<br />
symbo ols correspo ond to nickkel<br />
atoms. For a<br />
better clarrity,<br />
the maagnetic<br />
mo oments of immpurities<br />
in i case of interstitial<br />
ssegregation<br />
n (the<br />
second collumn<br />
from the left) are<br />
put aside<br />
(as a laye er denoted by I), althoough<br />
they lie in<br />
the GB layyer.<br />
For FSS<br />
segregatio on (the seccond<br />
colum mn from th he right), wwe<br />
interpre et the<br />
results as iif<br />
we addedd<br />
an impuri ity layer onnto<br />
the FS layer; l this added a layerr<br />
is also den noted<br />
as I and thhe<br />
magneticc<br />
moments of atoms frrom<br />
the first<br />
nickel layer<br />
are commpared<br />
wit th the<br />
magnetic moments ffor<br />
clean FS F accordinngly.<br />
The straight<br />
line es betweenn<br />
the point ts are<br />
drawn as a guide forr<br />
eyes. In case of thee<br />
GB segregation,<br />
the ey also indiicate<br />
wher re the<br />
impurity pprefers<br />
to seegregate<br />
su ubstitutionaally<br />
or inter rstitially. In n the first ccolumn<br />
from m the<br />
left, whichh<br />
displays tthe<br />
results for substituutional<br />
seg gregation, st traight linees<br />
for impu urities<br />
which turrned<br />
out tto<br />
prefer substitution s nal positio ons are ful ll and for the impu urities<br />
preferring interstitiaal<br />
positions the conneecting<br />
lines s are dashe ed. In the second column<br />
from the lleft<br />
showing<br />
the result ts for intersstitial<br />
segre egation, the e lines are ddrawn<br />
the other<br />
way arounnd.<br />
In this way, dashe ed lines maark<br />
energet tically unfa avourable ccases<br />
which h will<br />
not take pllace<br />
in reallity.<br />
4. CONNCLUSIONN<br />
As iimpurity<br />
ssegregation<br />
in nickell<br />
was not studied so s much aas<br />
in iron,<br />
the<br />
experimenntal<br />
data arre<br />
scarce an nd most off<br />
our findin ngs have a character of a theoretical<br />
predictionn.<br />
Segregatiion<br />
phenom mena are iimportant<br />
for f technol logical appplications<br />
of o the<br />
- 76 -<br />
Brno
XI. Workshop of Physical Chemists and Electrochemists´11 Brno<br />
nickel-based materials. We hope that our results may motivate experimentalists to<br />
perform more measurements on impurity segregation in nickel.<br />
5. ACKNOWLEDGEMENT<br />
This research was supported by the Grant Agency of the Czech Republic (Projects<br />
No. 202/09/1786 and 106/09/H035), the Grant Agency of the Academy of Sciences of the<br />
Czech Republic (Project No. IAA100100920), by the Research Projects AV0Z20410507<br />
and MSM0021622410 and by the Project CEITEC–Central European Institute of<br />
Technology (CZ.1.05/1.1.00/02.0068) from the European Regional Development Fund.<br />
The access to the MetaCentrum computing facilities provided under the Research Project<br />
MSM6383917201 is greatly appreciated. We thank Prof. P. Lejček, Dr. V. Paidar, Prof. I.<br />
Turek and Prof. V. Vitek for fruitful discussions.<br />
6. REFERENCES<br />
[1] Všianská M, Šob M.: Prog Mater Sci, 56 (2011), doi:10.1016/j.pmatsci.2011.01.008.<br />
- 77 -
XI. Workshop of Physical Chemists and Electrochemists´11 Brno<br />
USE OF LIGAND STEP GRADIENT<br />
FOCUSING IN COMBINATION WITH<br />
ISOTACHOPHORESIS (LSGF-ITP) FOR THE<br />
EFFECTIVE PRE-CONCENTRATION AND<br />
ANALYSIS OF HEAVY METALS<br />
Eliska GLOVINOVA 1 , Jan POSPICHAL 1 , Eliska SISPEROVA 1<br />
1 Mendel University in Brno, Zemedelska 1, CZ-613 00 Brno, CZ<br />
Abstract<br />
The new method was developed for the concentration and separation of metal ions called<br />
ligand step gradient focusing- LSGF. The principle of the method is a stationary pH<br />
discontinuity –neutralization reaction boundary, inside an ITP capillary which creates<br />
distinctly different complexing regions when a ligand is placed throughout the capillary.<br />
By selecting conditions such that the metal is uncomplexed at low pH and complexed at<br />
high pH in such a way that it forms a negative complex, the metals can be focused around<br />
the pH change.<br />
1. ANALYTICAL PART<br />
The analytical procedure consisted of pre-concentration, mobilization and detection<br />
of analytes. The low-concentrated metal ions in the cationic form were electrokinetically<br />
continuously dosed into the column where they were selectively trapped on the<br />
stationary ligand step gradient in the form of unmoving zones of chelate complexes with<br />
effectively zero charge. After a detectable amount of analyte was accumulated, the<br />
accumulated zones were mobilized to the analytical column, where they were analyzed<br />
by the conventional ITP method using conductivity detection.<br />
- 78 -
XI. Woorkshop<br />
of Physsical<br />
Chemists and a Electrochemmists´11<br />
Fig. I. Graf deppicting<br />
frac ction of diff fferent ionic c species in n dependennce<br />
on elect trolyte pH. .<br />
Note, thhat<br />
around d pH 4,2 cadmium is present ted in thee<br />
form of unchargedd<br />
complexxes.<br />
Fig.II.<br />
Scheme of the flow ws on neuttralization<br />
boundary b with w ligandd<br />
step gradi ient duringg<br />
the focuusing.<br />
Note e, that metaal<br />
is presen nted in alka aline electroolyte<br />
/left side/ s in thee<br />
anionic form and in the aciddic<br />
electrol lyte /right side/ in thhe<br />
metal or r cathionicc<br />
complexx,<br />
both form ms are migrrating<br />
to the e centre of column.<br />
2.<br />
MATERIAL<br />
Usedd<br />
electrolyyte<br />
system m<br />
PE: 0,01M NHH4Ac,<br />
0,01M M NH4OH, 2.10-3M (N NH4)2C6H H6O7, pH=99,24<br />
/alcalin ne focusingg<br />
electtrolyte/<br />
LE: 0,02M NH4Ac,<br />
0,0 01CH3COOOH,<br />
2.10-3 3M (NH4) 2C6H6O7,<br />
/anallytical<br />
leasiing<br />
el./<br />
TE: 00,01M<br />
CH33COOH,<br />
pH H=3,44 /termminating<br />
el lectrolyte/<br />
- 79 -<br />
Brnoo<br />
1 PEG,<br />
pH=4,955
XI. Workshop oof<br />
Physical Cheemists<br />
and Electrochemists´11<br />
DE: 0,0011M<br />
CH3COOOH,<br />
0,00 001M NH44Ac,<br />
pH=5, ,05+ 2.10-5 5M metalss<br />
/acidic dosing d<br />
electrolytee/<br />
3. RESSULTS<br />
Deteermination<br />
of MT by electrochem<br />
e mical methods<br />
is based d on electrooactivity<br />
of f –SH<br />
moieties, wwhich<br />
tendd<br />
to be The trapping seelectivity<br />
was w set-up by b proper chhoice<br />
of pH H and<br />
complexinng<br />
agents. A mixture of o heavy mmetals<br />
- Pb and Cd we ere used as model analytes,<br />
citrate weere<br />
used ass<br />
complexing<br />
agents. Using a 2000 2 sec. dosing d timee,<br />
the prop posed<br />
method immproved<br />
thhe<br />
detection n limit by 1100-150<br />
tim mes in com mparison to analysis by y ITP<br />
with classiical<br />
injectioon.<br />
Fig.<br />
IV. Depenndence<br />
of zone z lengthh<br />
of the focused<br />
metal on the dossing<br />
time.<br />
Fig. V. AAnalysis<br />
of tthe<br />
model mixture m of Cdd,<br />
Pb (2x10⁻⁵ 5 Mol/l) by regular<br />
ITP aanalysis-C,<br />
by b ITP<br />
with 500secc<br />
of focusingg-B<br />
and with h 1200sec oof<br />
focusing-A A. Note, tha at with 1200ssec<br />
of focus sing is<br />
analyte 50times<br />
pre-conncentrated.<br />
4. ACKKNOWLEDDGEMENT<br />
T<br />
The work was bby<br />
GA ČR 206/10/1219<br />
2 9.<br />
- 80 -<br />
Brno
XI. Workshop of Physical Chemists and Electrochemists´11 Brno<br />
LIGNITE – A LOW QUALITY SOLID FUEL<br />
WITH ATTRACTIVE SORPTION ABILITIES<br />
Petra BUŠINOVÁ 1 , Miloslav PEKAŘ 2 , Jaromír HUBÁLEK 1<br />
1 Brno University of Technology, Faculty of Electrical Engineering and Communication, Department of<br />
Microelectronics, Technická 3058/10, 616 00 Brno, Czech Republic<br />
2 Brno University of Technology, Faculty of Chemistry, Institute of Physical and Applied Chemistry,<br />
Purkyňova 118, 612 00 Brno, Czech Republic<br />
Abstract<br />
Lignite was considered just as a low quality solid fuel for a long time. More recently,<br />
various non-fuel applications, especially based on sorption processes, have been<br />
investigated. This contribution reports on the ability of the South Moravian lignite to<br />
adsorb basic textile dyes from aqueous solutions.<br />
1. INTRODUCTION<br />
Lignite as the youngest brown coal with a low degree of coalification has unique<br />
chemical composition and specific properties. Therefore, it can be used as a versatile<br />
material in several non-energy applications especially in sorption technologies. Lignite,<br />
even in its natural state, is reported to have significant sorption affinity for metal ions [1]<br />
as well as for some organic molecules, e.g. dyes [2], phenol [3] or non-ionic surface active<br />
agent [4]. Dyes, especially the synthetic ones, are extensively used in various fields of<br />
everyday life including e.g. textile, paper or printing industries. Most of the solutions used<br />
in dyeing processes are discharged as effluents and may cause certain hazards and<br />
environmental problems. The removal of dyes from wastewaters is extremely important<br />
because most of these dyes can be toxic, mutagenic and carcinogenic [5].Our research is<br />
focused on the sorption abilities of lignite mined in the region of South Moravia (Czech<br />
Republic). The affinity of this material for heavy metal ions (e.g. Pb 2+ , Zn 2+ , Cu 2+ , Cd 2+ ) and<br />
fluoride ion has previously been published [6,7]. This paper introduces results on the<br />
sorption of seven textile dyes on the powdered South Moravian lignite.<br />
2. EXPERIMENT<br />
Sorption studies were performed using lignite mined in the South Moravia,<br />
Mikulčice locality. Its detailed characterization is published elsewhere [6]. Fraction of<br />
lignite particles smaller than 0.2 mm, dried at 105 °C for 24 hours with final moisture<br />
content about 6 % was used. Adsorption of seven basic dyes (see Tab. 1) from aqueous<br />
solutions was studied. UV-VIS spectroscopy was used to determine residual dye<br />
concentration in solutions. The wavelengths of the absorption maxima of all seven dyes<br />
are given in Tab. 1. A change in the intensity of these maxima was used in order to<br />
characterize the removal of dyes from solutions. In each experiment 0.1 g of powdered<br />
lignite was mixed with 25 mL of aqueous dye solution with initial dye concentration of<br />
1000 mg·L –1 in 50 mL screw capped plastic centrifuge tubes with the conical bottom.<br />
Mixtures were agitated at constant agitation speed (27 rpm) on rotary shaker for given<br />
- 81 -
XI. Workshop of Physical Chemists and Electrochemists´11 Brno<br />
time period. After the required time period, samples were centrifuged at 4000 rpm for 15<br />
min and residual dye concentration in supernatant was determined. Experiments were<br />
conducted at laboratory temperature (25±2 °C).<br />
3. RESULTS AND DISCUSSION<br />
In this study, sorption of seven basic textile dyes (see Tab. 1) from aqueous solutions<br />
using natural powdered lignite as a sorbent was investigated. The residual dye<br />
concentration (cR in mg.L –1 ), the percentage removal of dye (R in percent) and the amount<br />
of dye adsorbed per gram of lignite (qt in mg.g –1 ) after 24 hours were determined and<br />
results are given in Tab. 1. It can be seen that all studied dyes can be removed from<br />
aqueous solution by adsorption on the South Moravian lignite, although with different<br />
efficiency.<br />
Tab. 1: The wavelengths of the absorption maxima of used dyes and residual dye<br />
concentration (cR), percentage removal of dye (R) and amount of dye adsorbed per gram of<br />
lignite (qt) after 24 hours<br />
Dye max (nm) cR (mg.L –<br />
1<br />
)<br />
- 82 -<br />
gt (mg.g –<br />
1 )<br />
Methylene blue (MB) 664 511 122 49<br />
Astrazon blue 3GL (AB) 593 624 94 38<br />
Bezacryl blue FBS (BB) 598 511 122 49<br />
Maxilon red M-4GL (MR) 505 10 247 99<br />
Bezacryl red GRL 180 % (BR) 529 356 161 64<br />
Maxilon yellow M-3RL (MY) 422 10 247 99<br />
Bezacryl golden yellow GL 200 %<br />
199 80<br />
437<br />
(BY)<br />
204<br />
In addition, the kinetics of removal of MR and MY from solutions was studied for<br />
144 hours. Several kinetic models were investigated in order to choose the best model for<br />
the dye/lignite adsorption system. Variation of dye concentration in solutions with time<br />
during the 144 hours is shown in Fig. 1. This figure indicates that in the case of both dyes<br />
the removal of dyes is rapid in the initial stages of contact time and gradually decreases<br />
with time. The pseudo-second-order equation kinetic model was successfully used in<br />
determining the sorption rate and describing the reaction mechanism of MR and MY onto<br />
powdered lignite. Linear plots t/qt against time t for tested dyes can be seen in Fig. 2 and 3.<br />
Linear regressions of these functions provide the rate constant of the pseudo-second-order<br />
sorption (k2 in g.mg –1 .hour –1 ), the amount of dye adsorbed at equilibrium (qe in mg.g –1 ) and<br />
the initial sorption rate (h in mg.g –1 .hour0.5 ) for adsorption of MR and MY on powdered<br />
lignite. Results together with correlation coefficient R2 can be seen in Tab. 2. Good<br />
agreement between experimental data and pseudo-second-order model was observed as<br />
illustrated by values of R2 close to unity.<br />
R<br />
(%)
XI. Workshop of Physical Chemists and Electrochemists´11 Brno<br />
Fig.1 Variation of dye concentration in solutions MR and MY with time during adsorption<br />
on powdered lignite<br />
t/q t (h.g.mg -1 )<br />
c R (mg.dm -3 )<br />
0,6<br />
0,5<br />
0,4<br />
0,3<br />
0,2<br />
0,1<br />
0<br />
100<br />
80<br />
60<br />
40<br />
20<br />
0<br />
0 12 24 36 48 60 72 84 96 108 120 132 144<br />
Fig.2 Pseudo-second-order kinetics for<br />
sorption of MR on lignite<br />
- 83 -<br />
Fig.3 Pseudo-second-order kinetics for<br />
sorption of MY on lignite<br />
Tab. 2: Comparison of the pseudo-second-order sorption rate constants (k2), amounts of<br />
dye sorbed at equilibrium (qe), initial sorption rates (h) and correlation coefficients<br />
(R 2 ) of studied dyes MR and MY<br />
Dye R 2 k2 (g.mg -1 .hour -1 ) qe (mg.g -1 ) h (mg.g -1 .hour 0.5 )<br />
MR 1<br />
6.83×10 -2 248 4.21×10 3<br />
MY 1<br />
t (h)<br />
0 24 48 72 96 120 144<br />
t (h)<br />
5.99×10 -2 248 3.69×10 3<br />
4. CONCLUSION<br />
Sorption abilities of the South Moravian lignite for seven basic dyes were explored.<br />
Furthermore, the adsorption kinetics of two selected dyes was investigated. It was<br />
t/q t (h.g.mg -1 )<br />
0,6<br />
0,5<br />
0,4<br />
0,3<br />
0,2<br />
0,1<br />
0<br />
MR<br />
MY<br />
0 24 48 72 96 120 144<br />
t (h)
XI. Workshop of Physical Chemists and Electrochemists´11 Brno<br />
observed, that lignite is able to adsorb various basic dyes and the adsorption process<br />
followed a pseudo-second-order kinetic model.<br />
5. ACKNOWLEDGEMENT<br />
The financial support from the grant KAN 208130801 and the frame of Research<br />
Plan MSM 0021630503 is highly acknowledged.<br />
6. REFERENCES<br />
[1] Mizera, J.,et al.: Water Res., 41 (2007), 620.<br />
[2] Allen, S. J., Mckay, G., Khader, K.Y.H.: J. Chem. Tech. Biotechnol., 45 (1998), 291.<br />
[3] Polat, H., Molva, M., Polat, M.: Int. J. Miner. Process., 79 (2006), 236.<br />
[4] Aktaş, Z.: Turk J Chem., 25 (2001)<br />
[5] Pavan, F. A., et al.: Bioresource Technol., 99 (2008), 3162.<br />
[6] Havelcová, M., et al.: J. Hazard. Mater., 161 (2009), 559.<br />
[7] Pekař, M.: Petroleum and Coal, 48 (2007), 3, 1.<br />
- 84 -
XI. Workshop of Physical Chemists and Electrochemists´11 Brno<br />
APPLICATIONS OF IRON OXIDE<br />
NANOPARTICLES<br />
Petra BUŠINOVÁ 1 , Jana CHOMOUCKÁ 1 , Jaromír HUBÁLEK 1<br />
1 Brno University of Technology, Faculty of Electrical Engineering and Communication, Department of<br />
Microelectronics, Technicka 3058/10, 616 00 Brno, Czech Republic<br />
Abstract<br />
In this work, a short summary of various applications of magnetic iron oxide nanoparticles<br />
is presented. Today, magnetic nanoparticles can be used in important biomedical<br />
applications as well as as magnetic recording devices, magnetic data storage devices, gas<br />
sensors, catalysts or wastewater treatment adsorbents.<br />
1. INTRODUCTION<br />
In recent years, magnetic nanoparticles are of great interest for researchers from a<br />
broad range of disciplines. There are unique magnetic properties such as<br />
superparamagnetic, high coercivity, low Curie temperature, high magnetic susceptibility,<br />
etc., which allows magnetic nanoparticles for various nanotechnology applications.<br />
Magnetic ferrofluids and data storage led to the integration of magnetic nanoparticles in a<br />
numerous of commercial applications. Today, magnetic nanoparticles are also used in<br />
important biomedical applications. Therefore, it is crucial to choose the suitable materials<br />
for the preparation of nanoparticles with adjustable physical and chemical properties. For<br />
this purpose, magnetic iron oxide nanoparticles became the strong candidates due to its<br />
biocompatibility [1, 2].<br />
Magnetite (Fe3O4) and its oxidised form maghemite (-Fe2O3) are the most common<br />
forms of iron oxide, which can be used in various fields of nanotechnology, especially in<br />
biomedical applications. Both of them are ferrimagnetic and in addition Fe3O4 show<br />
superparamagnetic properties when particle size is less than 15 nm [1, 3]. Furthermore,<br />
their surface can be easily modified through the creation of few atomic layers of organic<br />
polymer or inorganic metallic (e.g. gold) or oxide surfaces (e.g. silica or alumina), suitable<br />
for further functionalization by the attachment of various bioactive molecules [4].<br />
This contribution briefly reports on possibilities of utilization of iron oxide magnetic<br />
nanoparticles in wide range of applications in many different fields.<br />
2. BIOMEDICAL APPLICATIONS<br />
Biomedical applications of iron-based magnetic nanoparticles are classified into two<br />
categories according to their application inside (in vivo) or outside (in vitro) the body. In<br />
vivo applications could be further divided in therapeutic (hyperthermia and drug<br />
targeting) and diagnostic applications (nuclear magnetic resonance (NMR) imaging). For<br />
in vitro applications, the main use is in diagnostic and separation/labeling of biomolecules,<br />
such as protein, cell, DNA/RNA and microorganism. [5, 6]<br />
- 85 -
XI. Workshop of Physical Chemists and Electrochemists´11 Brno<br />
Magnetic separation. The basic principle of magnetic separation is very simple.<br />
Magnetic particles with an immobilized affinity or hydrophobic ligand or ion-exchange<br />
groups are mixed with a sample containing the target compound. Following an incubation<br />
period, when the target compound binds to the magnetic particles, the magnetic complex<br />
is easily and rapidly separated from the sample using an appropriate magnetic separator.<br />
After washing out the contaminants, the target can be eluted and used for further work.<br />
This method has wide application in biotechnology and biomedicine, such as<br />
immunomagnetic cell separation and purification, immunoassays, isolation, purification<br />
and recognition of proteins. In molecular biology, it can be used for DNA/RNA<br />
purification. In addition, the isolation and detection of microorganisms is easily possible<br />
using magnetic separation [6].<br />
Magnetic target drug delivery. This system of drug delivery is considered the most<br />
popular and efficient. In this technique, the drug carrying magnetic materials like Fe3O4<br />
will be led to the cancer areas by outside magnetic field after taken orally or injected<br />
through vein. After absorption by human body, the remanent magnetic particles can be<br />
safely excreted through skin, bile, kidney, etc. [7, 8]<br />
Hyperthermia. It is one of the promising approaches in cancer therapy. This idea is<br />
based on the principle that a magnetic particle can generate heat by hysteresis loss under<br />
an alternating magnetic field (AMF). Magnetic particles embedded around a tumor site<br />
and placed within an oscillating magnetic field will heat up to a temperature dependent<br />
on the magnetic properties of the material, the strength of the magnetic field, the<br />
frequency of oscillation and the cooling capacity of the blood flow in the tumor site.<br />
Cancer cells are destroyed at temperatures higher than 43 °C, whereas the normal cells<br />
can survive at higher temperatures [4, 6].<br />
Magnetofection. The fundamental principle of magnetofection is simple and<br />
comprises the steps of formulating a magnetic vector composed of a therapeutic gene and<br />
surface modified magnetic nanoparticles, adding it to the medium covering cultured cells<br />
or injecting it systemically via the blood stream or applying it locally to a target tissue, and<br />
in addition applying a magnetic field in order to direct the vector towards the target cells<br />
or retain it in the target tissue, respectively [6].<br />
Magnetic resonance imaging (MRI). Clinical diagnostics with MRI has become a<br />
popular noninvasive method for diagnosing mainly soft tissue or recent cartilage<br />
pathologies, because of the different relaxation times of hydrogen atoms.<br />
Superparamagnetic nanoparticles were developed as contrast agents for MRI and<br />
increased the diagnostic sensitivity and specificity due to modifications of the relaxation<br />
time of the protons [6].<br />
3. NON-BIOMEDICAL APPLICATIONS<br />
There are also other branches where iron oxide nanoparticles are or could be used.<br />
Some of them are mentioned below. Catalyst. Materials based on iron oxides have been<br />
found to be good, efficient and cheap catalysts, especially in environmental catalysis (e.g.<br />
for catalytic oxidation removal phenolic and aniline compounds from wastewater [9]).<br />
- 86 -
XI. Workshop of Physical Chemists and Electrochemists´11 Brno<br />
Iron oxide nanoparticle-based catalysts can be more effective than those conventional<br />
from micron-sized particles. These effects could be derived from the high activity of<br />
nanoparticles that have high BET surface areas and more coordination of unsaturated sites<br />
on the surfaces. Chemical and electronic properties, such as phase changes, OH content,<br />
band gap changes etc., could also have contributed to their high reactivity. Iron oxide<br />
(usually mixed with other metal oxides) in particular, has been shown to be a very active<br />
(although unstable) catalyst for the oxygen evolution process as well as other related<br />
processes, such as water splitting, chlorine evolution, the oxidation of organic molecules,<br />
the oxygen reduction process and for the hydrogen peroxide decomposition. Even more<br />
important are iron oxide-based catalysts in non-electrochemical processes [5].<br />
Gas sensor. A number of studies have focused on maghemite (-Fe2O3), which<br />
exhibits good sensing characteristics towards hydrocarbon gases, carbon monoxide and<br />
alcohol. The advantages of -Fe2O3 gas sensors are its high response and low cost.<br />
Furthermore, the sensitivity of these sensors can be enhanced by various doping schemes<br />
and a number of different dopants such as Ni, Pd, Sn, Ti, Zn etc.. While doping is an<br />
important factor for controlling the sensing characteristics, the sensor structure, and<br />
especially the thickness of its active layer, also has a great influence on the sensitivity. In<br />
fact, bulk and thick-film type sensors exhibit a relatively low sensitivity, which<br />
substantially improves when the same sensing material is used in a thin-film type sensor.<br />
The improvement is even greater when a nanosized material is used [10].<br />
Impurity control agent. Iron oxides have relatively high surface area and surface<br />
charge, and they often regulate free metal and organic matter concentrations in soil or<br />
water through adsorption reactions. Many toxic cations (e.g. Co, Zn, Pb, Cd, Cs, U, Sr) and<br />
anions (e.g. AsO4 3− , CrO4 2− , PO4 3− , CO3 2− ) are removed using various phases of iron oxide.<br />
At the nanoscale these materials are potentially highly efficient for binding metal ions.<br />
Selective adsorption of different metal ions can be achieved by tailoring the composition<br />
of the iron oxides. Use of iron oxide nanoparticles is thus becoming very attractive in the<br />
area of adsorption or recovery of metal ions from industrial wastes or natural water<br />
streams [5].<br />
Electro magnetic material. Magnetic nanoparticles, including ferrites, have been<br />
studied for many years for their application as magnetic storage media and ferro-fluids.<br />
Over the recent years, maghemite (-Fe2O3), a ferromagnetic material, is widely used as<br />
magnetic storage media in audio and video recording, magneto-optical devices and<br />
magnetic refrigeration. Furthermore, iron-based nano compounds as positive cathode<br />
materials for Li-ion secondary batteries are of interest due to the low-cost and nontoxicity<br />
[5].<br />
Colouring and coating material. Finally, iron oxide nanoparticles can be found in<br />
transparent iron oxide pigments, which can be used in automotive paints, wood finishes,<br />
construction paints, industrial coatings, plastic, nylon, rubber and print ink. The excellent<br />
weather fastness, UV absorption properties, high transparency and color strength makes<br />
trans-oxide to enrich the colors, increase color shades when combined with organic<br />
pigments and dyes [5].<br />
- 87 -
XI. Workshop of Physical Chemists and Electrochemists´11 Brno<br />
4. CONCLUSION<br />
In this paper we have briefly reviewed the possibilities of iron oxide-based magnetic<br />
nanoparticles utilization. From the information given above, it can be concluded that iron<br />
oxide nanoparticles can be used for numerous in vivo or in vitro biomedical applications,<br />
such as contrast agents for magnetic resonance imaging, magnetofection reagent,<br />
hyperthermia media for tumors treatment, etc.. Besides, iron oxides have been explored as<br />
low-cost and non-toxic magnetic materials for e.g. wastewater treatment, magnetic<br />
storage devises, catalysis or gas sensing.<br />
5. ACKNOWLEDGEMENT<br />
The financial support from the grant KAN 208130801 and the frame of Research<br />
Plan MSM 0021630503 is highly acknowledged.<br />
6. REFERENCES<br />
[1] Wu, W., He, Q., Jiang, Ch.: Nanoscale Res. Lett., 3 (2008), 397<br />
[2] Drbohlavova, J., et al.: Sensors, 9 (2009) , 4, 2352<br />
[3] Qiang, Y., et al.: J Nanopart. Res., 8 (2006), 489<br />
[4] Gupta, A. J., Gupta, M.: Biomaterials, 26 (2005), 3995<br />
[5] Mohapatra, M., Anand, S.: Int. J. Eng. Sci. Tech., 2 (2010), 8, 127<br />
[6] Ma, Z., Liu, H.: China Particuology, 5 (2007), 1<br />
[7] Zhao, Y., Qiu, Z., Huang, J.: Chin. J. Chem. Eng., 16 (2008), 3, 451<br />
[8] Chomoucka, J., et al.: Pharmacol. Res., 62 (2010), 2, 144<br />
[9] Zhang, S., et al.: J. Hazard. Mater., 167 (2009), 560<br />
[10] Jasinski, J., et al.: Sensor. Actuat. B-Chem., 109 (2005),1, 19<br />
- 88 -
XI. Woorkshop<br />
of Physsical<br />
Chemists and a Electrochemmists´11<br />
EXXPRESSSING<br />
G OF BBACTE<br />
ERIAL L<br />
DIHYDRRODIP<br />
PICOLLINAT<br />
TE SYN NTHAASE<br />
IN<br />
GRRAIN<br />
OOF<br />
TR RANSGGENIC<br />
C BAR RLEY<br />
Nataalia<br />
CERNE<br />
GALLUSZKA<br />
BAB<br />
4 , Ja<br />
BULA6 EI<br />
, Ren<br />
1 , Ondřej Z<br />
ana VASKO<br />
né KIZEK1 ZÍTKA1 , Lu<br />
OVA2 udmila OHN NOUTKOV<br />
, Markk<br />
A. SMED DLEY4 VÁ<br />
, Wen<br />
2,3 , Katarrina<br />
MRIZO<br />
ndy A. HARRWOOD5<br />
OVÁ<br />
,<br />
4 , Petr<br />
Petr<br />
1Depaartment of Chhemistry<br />
and<br />
1, 1, CZ-613 00 BBrno,<br />
Czech R<br />
Czech Reppublic;<br />
Oloomouc,<br />
Slecht<br />
of MMolecular<br />
Bio<br />
Crop p Genetics, Joh<br />
Faculty of Ph<br />
3 d Biochemistry<br />
Republic;<br />
Depar<br />
titelu 11, 7837<br />
iology, Faculty<br />
hn Innes Cen<br />
harmacy, Uni<br />
2 ry, Faculty of Agronomy, A M<br />
Insstitute<br />
of Expe perimental Bot<br />
rtment of Celll<br />
Biology and d Genetics, Fa<br />
371 Olomouc-H -Holice, Czech h Republic;<br />
y of Science, PPalacky<br />
Univ<br />
ntre, Norwich h Research Par<br />
iversity of Veeterinary<br />
and<br />
4 Mendel Unive<br />
tany, v.v.i., A<br />
aculty of Scien<br />
Department D o<br />
versity in Olo omouc, Czech<br />
ark, United Ki ingdom,<br />
d Pharmaceuti<br />
6 ersity in Brno<br />
Academy of Sc<br />
ence, Palacky<br />
of Biochemist<br />
h Republic;<br />
Dep<br />
ical Sciences,<br />
5 o, Zemedelskaa<br />
Sciences of thee<br />
University inn<br />
try – Divisionn<br />
Department D off<br />
partment of Natural N Drugs, s,<br />
Palackeho 1- -3, CZ-612 422<br />
Brno, Cz zech Republicc<br />
Absstract<br />
Nutritionnal<br />
quality of human aand<br />
animal l foodstuffs is determinned<br />
by the content off<br />
essenntial<br />
aminoo<br />
acids. Bar rley is the fourth mo ost importa ant cereal oof<br />
the wor rld and thee<br />
seconnd<br />
most immportant<br />
ce ereal grownn<br />
in the Cz zech Repub blic. Cereal grains such h as barleyy<br />
contain<br />
insufficcient<br />
levels of some essential<br />
ami ino acid, esp pecially lyssine.<br />
1. INTRODDUCTION<br />
Provision of sufficie ent quality food and fodders f is still s presennt<br />
appeal. World W foodd<br />
crisiss<br />
brings to border of famine f milllions<br />
of peo ople. Food supplement s tation for biologically b y<br />
impoortant<br />
commpounds,<br />
su uch as vittamins,<br />
am mino-acids and essenntial<br />
fatty acids mayy<br />
contribute<br />
-to solve thi is problemm.<br />
Modern n methods of moleccular<br />
biolo ogy enablee<br />
introoducing<br />
of new prope erties into plants. Lys sine is biol logically veery<br />
importa ant amino--<br />
acid,<br />
which iis<br />
essential for human n. Adults nneed<br />
about 1-1.5 g off<br />
lysine<br />
per dayy,<br />
children about 44 mg m of lysinne<br />
per day. Generally, ,<br />
L-l lysine is ann<br />
essential structural s amino-acid a d, which is crucial forr<br />
all proteins. Lysine pla ays an imp portant rolle<br />
in calciu um uptakee<br />
abs sorption, paarticipates<br />
in biosynth hesis of horrmones,<br />
en nzymes andd<br />
ant tibodies annd<br />
its impo ortance is also a in mettabolism<br />
of<br />
muscularr<br />
tissue.<br />
Positive effect of lysine l is deemonstrated<br />
in processes<br />
of heaaling<br />
of wo ounds afterr<br />
surgical interventio ons or inju uries. Due to these properties, ,<br />
supplemeentation<br />
of f fodders for<br />
livestockk<br />
by lysine e is a veryy<br />
importannt<br />
factor for r improving g of daily inncrease<br />
in weight. w<br />
2. EXXPERIMEN<br />
NT<br />
Bioological<br />
exp periment: Transgenic T bbarley<br />
plan nts of the T11<br />
generatioon<br />
were evaluated e by b PCR, RReal-Time<br />
PCR andd<br />
Westernn<br />
blot. In 2010, grad dually matturing<br />
and d graduallyy<br />
- 89 -<br />
Brnoo
XI. Workshop of Physical Chemists and Electrochemists´11 Brno<br />
regenerate transformed plants, the grain was harvested in July 2010. Plants were divided<br />
based on the RT-PCR analysis in four groups: high expression of the desired gene dapA<br />
and selective gene hpt (hygromycin phophotransferase), intermediate expression, low<br />
expression and different expression. The activity of DHPDS protein and lysine content.<br />
Fig1.MW 3000 Anton Paar<br />
The selected plants with high protein expression were determined. Grain was<br />
harvested from 336 plants. In winter there was a significant slowdown in growth of plants<br />
and extending the growing season. The plants differed in height- even the number of<br />
offsprings and grain and number of grain per spike . Transgenic plants were observed in<br />
relatively large numbers of sterile flower, which has not in corn. An average of all plants<br />
was 20 grains per spike, plants usually had five offsprings.<br />
Analysis: Amino acids content was analyzed by Aminoacid Analyzer AAA400 with<br />
post column derivatization by ninhydrin. Leave samples were prepared by HCl hydrolysis:<br />
0.25 g of homogenized solid sample was mineraralized with 0.5 ml 6M HCl in MW Aton<br />
Paar 3000, power-80,ramp-15,hold-90 (Fig.2).<br />
3. RESULTS AND DISCUSSION<br />
Two constructs pBract214::sTPdapA and pBract214::mdapA containing the dapA<br />
gene from Escherichia coli coding bacterial DHPS were used for transformation of barley.<br />
The vector pBract214::sTPdapA in addition includes the transit peptide Rubisco Hordeum<br />
vulgare ribulose-1,5-bisphosphate carboxylase small subunit, Genbank U43493. An<br />
Agrobacterium-mediated technique was used for transformation of immature embryos of<br />
barley cv. Golden Promise. Plants were analysed with respect to expression of cloned<br />
genes by qRT-PCR technique. On a basis of this analysis, four groups of plants were<br />
established (low, medium, high and unequal gene expression). Due to this fact, we decided<br />
to carry out an analysis of lysine as a product of gene transcription. Ionex chromatography<br />
was used for analysis. Signal of lysine was well-separated with limits of detection of 500<br />
nM and limit of quantification about 5 μM with deviation of 5%.(Fig.2) Real samples were<br />
hydrolyzed by HCl at elevated temperature; obtained extracts were subsequently injected<br />
into chromatographic system in triplicates (R.S.D. was 6.5%). Concentration of lysine in<br />
control group of plants was about 303.5 mM, the concentration of total content of 2<br />
amino-acids. From obtained results follows very good correlation between the rate of<br />
cloned gene expression and lysine concentration (R 2 =0.99).<br />
- 90 -
XI. Woorkshop<br />
of Physsical<br />
Chemists and a Electrochemmists´11<br />
Fig.22:<br />
Standard of Lysine after a hydrollysis<br />
in MW W Anton Pa aar<br />
Fig. 33:<br />
Calibrattion<br />
curve of o lysine<br />
Pictures 44-7<br />
show th hat the aveerage<br />
value of the stud died amino o acids did not n changee<br />
signiificantly<br />
deepending<br />
on o the leveel<br />
of gene expression n. Howeverr<br />
in negati ive controll<br />
grouup<br />
(no vectoor<br />
transform med) the ammino<br />
acid content<br />
was s lower.<br />
- 91 -<br />
Brnoo
XI. Workshop oof<br />
Physical Cheemists<br />
and Electrochemists´11<br />
Fig.4: Thee<br />
amount<br />
exppression.<br />
concentration [mM]<br />
concentration [mM]<br />
8000<br />
7000<br />
6000<br />
5000<br />
4000<br />
3000<br />
2000<br />
1000<br />
0<br />
600<br />
500<br />
400<br />
300<br />
200<br />
100<br />
0<br />
of studied d amino aacids<br />
deter rmined in<br />
mediuum<br />
expressio on<br />
PCR 3 PC CR 28 PCR 311PCR<br />
52 PCR<br />
70 PCR134 4<br />
Fig.5: Thee<br />
amount oof<br />
studied amino aciids<br />
determi ined in sam mples withh<br />
medium gene<br />
exppression.<br />
low expresssion<br />
PCR 7 PCR R 16 PCR 477<br />
PCR 55 PCR R 88 PCR 96<br />
- 92 -<br />
samples wwith<br />
high<br />
Lysin<br />
Threoninn<br />
Methionnin<br />
Lysin<br />
Threoninn<br />
Methionnin<br />
Brno<br />
gene
XI. Workshop of Physical Chemists and Electrochemists´11 Brno<br />
Fig.6: The amount of studied amino acids determined in samples with low gene<br />
expression.<br />
concentration [mM]<br />
800<br />
700<br />
600<br />
500<br />
400<br />
300<br />
200<br />
100<br />
0<br />
Fig.7: The amount of studied amino acids determined in samples with unequal gene<br />
expression<br />
concentration [mM]<br />
400<br />
350<br />
300<br />
250<br />
200<br />
150<br />
100<br />
50<br />
0<br />
unequal expression<br />
PCR 6 PCR 39 PCR 73 PCR 84 PCR 95 PCR<br />
123<br />
negative control<br />
1<br />
Golden promise<br />
Fig.8: The amount of studied amino acids determined in samples without gene expression.<br />
4. CONCLUSION<br />
Amino acid content was analyzed by Aminoacid analyzer AAA400 with post<br />
column derivatization by ninhydrin. 26 samples were measured with the gene expression<br />
of lysine. The result was converted to mM concentration of lysine, methionine and<br />
therionine. Lysine content had no effect on other amino-acids. The selected T1 progene<br />
was sown in October in a greenhouse and characterized by PCR at the level of expression<br />
and gain detection dapA.<br />
5. ACKNOWLEDGEMENT<br />
This work was supported by project 1M06030 of the Ministry of Education, Youth<br />
and Sports of the Czech Republic.<br />
- 93 -<br />
Lysin<br />
Threonin<br />
Methionin<br />
Lysin<br />
Threonin<br />
Methionin
XI. Workshop of Physical Chemists and Electrochemists´11 Brno<br />
6. REFERENCES<br />
[1] Krishnakumar V, Manohar S, Nagalakshmi R.: Spectrochimica Acta Part A-Molecular And<br />
Biomolecular Spectroscopy, 75 (2010), 5, 1394-1397<br />
[2] Veriter S, Mergen J, Goebbels RM.: Tissue Engineering Part A, 16 (2010), 5, 1503-1513<br />
[3] Vyroubalova S, Ohnoutkova L, Galuszka P, In Vitro Cellular Developmental Biology-Animal, 44<br />
(2008), S68-S68<br />
[4] Serhantova V, Ehrenbergerova J, Ohnoutkova L, Plant Soil and Environment, 50 (2004), 456-462<br />
[5] Halamkova E, Vagera J, Ohnoutkova L Biologia Plantarum, 48 (2004), 313-316<br />
[6] Ohnoutkova L,Vaškova J,Mrizova K,Smedley M, Harwood W, XXIVth Genetic Day, Book of<br />
Abstracts 55,1-3 September, 2010<br />
- 94 -
XI. Woorkshop<br />
of Physsical<br />
Chemists and a Electrochemmists´11<br />
DEETERMMINAT<br />
TION PROS STATE E SPECCIFIC<br />
ANNTIGEEN<br />
AN ND TESSTOSTERO<br />
ONE INN<br />
TUUMOUUR<br />
CELL<br />
LINNES<br />
WITH W ENCO E ORE ZINC<br />
ANND<br />
SAARCOS<br />
SINE AAS<br />
WE ELL AS A IN PPROST<br />
TATE<br />
CAANCERR<br />
PAT TIENTSS<br />
Nataalia<br />
CERNE<br />
SOCHOR1<br />
EI<br />
, Petr<br />
1 , Michal M<br />
r BABULA3 MASAŘÍK 2 , Jaromír G<br />
3 , René KIZZEK<br />
1<br />
2 Dep<br />
3 Dep<br />
11<br />
Department t of Chemistry y and Biochemmistry<br />
Mende<br />
partment of PPathological<br />
Physiology, P Fa Faculty of Med<br />
CZ-662 2 43 Brno, Czeech<br />
Republic<br />
partment of NNatural<br />
Drugs, s, Faculty of P<br />
3<br />
el University, Zemedelska a 1, CZ-613 00 0 Brno, Czechh<br />
Republicc<br />
dicine, Masary ryk University ty, Komenskeh eho namesti 2, 2,<br />
3Department t of Natural Dr Drugs, Faculty y of Pharmacyy<br />
Pharmacy, Un niversity of Veterinary Ve andd<br />
Pharmaceut tical Sciences, ,<br />
Palackeho ho 1-3, CZ-6122<br />
42 Brno, Cz zech Republicc<br />
Absstract<br />
Tummour<br />
markerrs<br />
are bioch hemical inddicators<br />
of malignant m tumour t prooliferation.<br />
They servee<br />
not oonly<br />
for diaagnostics<br />
of f malignantt<br />
tumour diseases, d but t also for mmonitoring<br />
of effect off<br />
theraapy<br />
and reecurrence<br />
of o disease. One of th he most important<br />
inddicators<br />
of f quality off<br />
oncoological<br />
maarkers<br />
is the eir sensitivvity;<br />
it mea ans the possibility<br />
to detect dise eases at thee<br />
earlyy<br />
stages, annd<br />
specificity<br />
to givenn<br />
type of tu umour. In the case oof<br />
prostate carcinoma, ,<br />
prosttatic<br />
acid pphosphatase<br />
e (PAP) waas<br />
usually used u in the e past. PAPP<br />
was repla aced at thee<br />
end of eighties of last cent tury by serrum<br />
prostat te specific antigen a (PSSA),<br />
which belongs too<br />
a grooup<br />
of the bbest<br />
tumour r markers, ccurrently<br />
available. a<br />
1. INTRODDUCTION<br />
Seruum<br />
prostate e specific antigen a (PSSA)<br />
was us sed for thee<br />
first timee<br />
at 1969 by Haura et al. PSSA<br />
is a gl lycoproteinn<br />
composedd<br />
of 237 amino-acids<br />
s, which ooriginates<br />
in i prostatee<br />
gland andd<br />
is necess sary to normal<br />
physsiological<br />
function fu off<br />
sperm. Att<br />
the physio ological sta ate, most off<br />
PSA is sec creted intoo<br />
sperm. Onnly<br />
small amount a of PSA is traansported<br />
into i blood, ,<br />
due to thiss<br />
fact, PSA is detectab ble in bloodd<br />
serum. In the case off<br />
disorganizzation<br />
of inner<br />
archite ecture of prrostate<br />
gland,<br />
majorityy<br />
of PSA iss<br />
transporte ed into blo ood, whichh<br />
results in n increasedd<br />
PSA level in bllood<br />
serum m. It was deetermined<br />
that t increas sed PSA levvel<br />
is assoc ciated withh<br />
tumoour<br />
diseases<br />
of prostate<br />
gland. DDeterminati<br />
ion of PSA A level is att<br />
the presen nt the bestt<br />
prosttate<br />
tumouur<br />
marker, , which iss<br />
presently y known and used.TTestosteron<br />
ne is malee<br />
hormmone<br />
- haas<br />
no direc ct relationsship<br />
to tu umour form mation, maay<br />
contribu ute to thee<br />
deveelopment<br />
off<br />
clinical manifestatio<br />
m ons. It was found f that the incidennce<br />
of prostate<br />
cancerr<br />
is muuch<br />
lower iin<br />
eunuchs - they lackk<br />
testosterone.<br />
- 95 -<br />
GUMULEC 2<br />
2 , Ondřej ZZÍTKA1<br />
, Jiří í<br />
Brnoo
XI. Workshop of Physical Chemists and Electrochemists´11 Brno<br />
2. EXPERIMENT<br />
Samples were analysed by the use of apparatus Immune Enzymatic Automated<br />
Analyzer AIA 600 ΙΙ, which serves for measurement of immunochemical parameters in<br />
biological liquids; it uses set of reagents AIA–PACK PSA and fPSAThe AIA -600II<br />
Automated Enzyme immunoassay. The AIA –PACK reagent series test cups are disposable<br />
plastic cups containing the necessary reagents and analytes for each test, one specimen<br />
immunoreaction.The contents of the test cups are freeze-dried and sealed for long term<br />
storage. All reactions and fluorescent measurements are performed in the test cups. An<br />
antigen-antibody reaction begins by combining a patient sample, control, or calibrator<br />
with solvent in an immunoreactions test cup from the AIA-PACK reagent series. In the<br />
EIMA assay, during the incubation period, the antibodies are attached to two distinct<br />
epitopes on the antigen forming a sandwich. Samples are incubated at 37°C with antibody<br />
bound to the surface of magnetic particles. Separation of the bound antibody is achieved<br />
by washingthe beads with a washsolution that removes any conjugates.<br />
After washing, a substrate, 4-methyumbelliferyl phosphate, is added to the test cup.<br />
The remaining enzyme activity on the solid phase (magnetic beads) is then measured<br />
using fluorescent rate method. A set of reagents AIA-PACK TES was used<br />
formeasurement of testosterone. Cell lines were derived from normal prostate tissue<br />
(PNT1A) and tumour tissue - tumour cell lines RVL1.<br />
3. RESULTS AND DISCUSSION<br />
In our experiment, we used fully automated immunochemical detection of serum<br />
prostate specific antigen. Reaction itself is initiated by pipetting of sample (10 μl)<br />
consisting of blood serum or cell lysate with solvents in testing pot AIA-PACK. Samples<br />
were incubated at 37°C, antibodies were bonded on surface of paramagnetic particles.<br />
Separation of bonded and unbounded antibodies is obtained by washing by rinsing<br />
solution - unbounded antibodies were washed out. After washing step, substrate - 4methylumbelliferyl<br />
phosphate was added into testing pot and enzymatic activity on<br />
paramagnetic particles was measured. Calibration curve for PSA was designed (R 2 =<br />
0.9993, standard deviation 0.2 %) and for fPSA (R 2 = 0.9990, standard deviation 0.5 %)<br />
(Fig. 1).<br />
- 96 -
XI. Woorkshop<br />
of Physsical<br />
Chemists and a Electrochemmists´11<br />
Fig.11:<br />
Calibratioon<br />
curves for f determiination<br />
of total t serum m prostate sspecific<br />
ant tigen (PSA) )<br />
and free PSA (fPSA A).<br />
We analyysed<br />
18 sa amples of patients ag<br />
adennocarcinomma<br />
and 3 controls ( (healthy y<br />
deterrmined<br />
usiing<br />
two procedures. p Correlatio<br />
methhod<br />
fPSA) wwas<br />
very close c with R<br />
valuee<br />
of determmined<br />
PSA (method P<br />
PSA values deetermined<br />
by b PA me<br />
compparison<br />
witth<br />
PSA2 method.<br />
At l<br />
by PPSA2<br />
methood<br />
was obse erved (enha<br />
PA mmethod).<br />
Leevels<br />
of PSA A of patien<br />
was 1.50-3.19 nng/ml.<br />
Testo osteron leve<br />
2 ged 62-80 years, sufffering<br />
from m prostatee<br />
young men n). Levels of total PSA weree<br />
on of obta ained data (method PSA2 andd<br />
=0.990. Newly N intro oduced meethod<br />
PSA2 2 decreasedd<br />
PA) by 1.5 ng/ml at average. a Addditionally,<br />
in higherr<br />
ethod, PSA A level was<br />
for abouut<br />
25-30 % lower inn<br />
low PSA le evels, highe er sensitivitty<br />
of PSA determined d d<br />
ancement of o PSA for about a 5-7 % in compa arison withh<br />
nts were in the range 4.78-12.50 ng/ml, levels<br />
of fPSAA<br />
el of patien nts was 278-666<br />
ng/dl.<br />
- 97 -<br />
Brnoo
XI. Workshop oof<br />
Physical Cheemists<br />
and Electrochemists´11<br />
Fig.2: Conncentration<br />
PSA2 and fPSA f of pattients<br />
Fig.3: Conncentration<br />
testosteron ne of patiennts<br />
Propposed<br />
methodology<br />
for<br />
determinnation<br />
of PS SA and fPSA<br />
was subssequently<br />
tested t<br />
on cell lyssates.<br />
In noon-tumour<br />
cell lines, PPSA<br />
levels were abou ut 0.02 ng/mml<br />
and for fPSA<br />
0.02 ng/mll.<br />
In the casse<br />
of tumou ur cell liness<br />
- for tumo our cell line e PC-3, PSAA<br />
level was s 0.05<br />
ng/ml andd<br />
level of fPPSA<br />
was 0.0 02 ng/ml; tuumour<br />
cell line RVL 22 2 with enccore<br />
sarcosi ine 0-<br />
500μM deemonstratedd<br />
significan nt enhanceement<br />
of PSA P levels to 9.58 nng/ml<br />
and fPSA<br />
to11.40 ngg/ml<br />
(Fig.44).Testoster<br />
rone level in cell lines<br />
RVL 1 22 was 36617-<br />
4205 ng/dl<br />
(Fig.5).<br />
Fig.4: Conncentration<br />
PSA and fP PSA of cell lines 22 RV VL1 and PN NT 1A<br />
- 98 -<br />
Brno
XI. Woorkshop<br />
of Physsical<br />
Chemists and a Electrochemmists´11<br />
Fig.55:<br />
Concentrration<br />
testosterone<br />
of ccell<br />
lines 22 2 RVL1 and d PNT 1A<br />
Along witth<br />
testoster rone levels in the pros state cancer r cells the iinfluence<br />
of o sarcosinee<br />
on ccells<br />
lines RVL1 wa as detectedd.<br />
To cell ls lines RVL1,<br />
10.500<br />
μM and d 500 μMM<br />
conccentrations<br />
of sarcosin ne were addded.<br />
Figure es 6 shows that encorre<br />
of sarco osine didn’tt<br />
havee<br />
any effectt<br />
on levels of PSA andd<br />
fPSA. Ho owever Figu ure 7 showws<br />
significan nt effect off<br />
sarcoosine<br />
on tesstosterone<br />
levels. l<br />
Fig.66:<br />
Concentrration<br />
PSA and fPSA oof<br />
cell lines 22 RVL1 with w encoree<br />
sarcosine 0-500μM<br />
- 99 -<br />
Brnoo
XI. Workshop oof<br />
Physical Cheemists<br />
and Electrochemists´11<br />
Fig.7: Conncentration<br />
testosteron ne of cell linnes<br />
22 RVL L 1with enc core sarcosiine<br />
0-500 μM M<br />
4. CONNCLUSIONN<br />
Deteermination<br />
of PSA in blood b serumm<br />
of patien nts is comm mon diagnosstic<br />
method d. We<br />
demonstraated<br />
in ourr<br />
work tha at fully auttomated<br />
tec chnique of f PSA immmunodetecti<br />
ion is<br />
possible allso<br />
in cell lyysates.Determination<br />
oof<br />
testoster rone in cell lines RVL11<br />
and PNT 1A is<br />
possible allso<br />
in cell llysates,<br />
con ntent testossterone<br />
is very v high.T The level off<br />
testosterone<br />
in<br />
men rangees<br />
from 3500<br />
to 1000 ng/dl n after tthe<br />
fortieth h year of lif fe is this noormal<br />
level<br />
will<br />
decrease bby<br />
about 1%<br />
per year.<br />
A historry<br />
of prosta ate cancer has been a long stan nding<br />
contraindiication<br />
to the use of testosterrone<br />
thera apy due to o the beliief<br />
that higher h<br />
serum testtosterone<br />
caauses<br />
more rapid prosttate<br />
cancer growth.<br />
5. ACKKNOWLEDDGEMENT<br />
T<br />
The work has bbeen<br />
suppo orted by graants:<br />
GACR R 301/09/P4 436, IGA MMZ<br />
10200-3 3 and<br />
NANOSEMMED<br />
GA AAV<br />
KAN208 8130801, IGGA<br />
MZ 10200-3.<br />
6. REFFERENCESS<br />
[1] Caire AA, Sun L, RRobertson<br />
CN N.:, J.: UROLOOGY,<br />
75(2010 0), 5,1122-112 27<br />
[2] Williaams<br />
SA, Xu YY,<br />
De Marzo AM.:, A J.: PROOSTATE,<br />
70(2010<br />
), 7, 788-796<br />
[3] Naritaa<br />
D, Anghel AA,<br />
Cimpean AM.:,J.: A NEOPPLASMA,<br />
57 7(2010 ), 3, 19 98-206<br />
[4] Lee TTK,<br />
Miller JS, Epstein JI.:,J. : PATHOLOGGY,<br />
42(2010) , 4, 319-324<br />
[5] Morggentaler<br />
A, LippshultzLI,Ben<br />
nnett R, et al. .JOURNAL OF O UROLOGY Y,185(2011),44,1256-1260<br />
- 100 -<br />
Brno
XI. Workshop of Physical Chemists and Electrochemists´11 Brno<br />
FABRICATION AND CHARACTERIZATION<br />
OF TIO2 QUANTUM DOTS ARRAY<br />
Jana DRBOHLAVOVÁ 1 , Dmitry SOLOVEI 1 , Jaromír HUBÁLEK 1<br />
1 Brno University of Technology, Faculty of Electrical Engineering and Communication, Department of<br />
Microelectronics, Údolní 53, 602 00 Brno, Czech Republic<br />
Abstract<br />
In this work, we report on the electrochemical preparation of TiO2 quantum dots (QDs)<br />
on Ti layer deposited on Si wafer with the aim to investigate the different physicochemical<br />
properties. This QDs array may be widely used for biosensing purposes in<br />
medicine, allowing the detection of DNA and proteins in vitro. The prepared TiO2 QDs<br />
were less than 10 nm in size (characterized with SEM), predominantly composed of<br />
anatase phase (observed with Raman spectroscopy), and exhibited broad emission band in<br />
VIS range (spectra taken by fluorescence spectroscopy).<br />
1. INTRODUCTION<br />
Nonlitographic nanopatterning through thin nanoporous anodic alumina<br />
membranes used as template enables the fabrication of large-scale ordered arrays of<br />
nanostructures on various surfaces. Compared to traditionally employed techniques for<br />
nanostructures synthesis, such as photolithography or e-beam lithography, which are<br />
time-consuming and expensive processes, this technique allows the above mentioned aims<br />
in cheap, fast and well reproducible way. Nowadays, there are lots of papers dealing with<br />
ordered nanotubes array fabricated using template methods, but only very few works<br />
concerning the application of anodization technique for nanodots preparation. Sometimes,<br />
the scientists combine the usage of nanoporous template and other ways of nanodots<br />
deposition, like ion beam evaporation, electron gun evaporation, nanoscale selective<br />
epitaxial growth, selective anodization using AFM tip, electrodeposition etc.<br />
In order to achieve nanocrystals directly grown by anodization with sizes in the<br />
range of 1 to 10 nm which is essential for their quantum effect, the diameter of pores in<br />
the template must also be in this range. Therefore the experimental conditions must be<br />
tuned by choice of electrolyte, temperature, anodization voltage and time, which strictly<br />
depend on aluminium layer thickness. Except quantum effect requirements, the other one<br />
concerns the biocompatibility of QDs. Most of traditionally prepared QDs are toxic, hence<br />
there is a demand for non-toxic material such titanium dioxide [1]. The accomplishment<br />
of both requirements is not easy feasible. For example, Chen et al. prepared TiO2 nanodots<br />
using anodization technique, however they did not reach the size needed for quantum<br />
effect which is strictly below 15 nm (for anatase phase) [2]. Here, new approach of<br />
anodization process application deals with synthesis of QDs array with high<br />
photoluminescence on silicon substrate. Such prepared QDs array is highly promising for<br />
biological imaging and detection of various biomolecules [3].<br />
- 101 -
XI. Workshop of Physical Chemists and Electrochemists´11 Brno<br />
2. EXPERIMENT<br />
The sample preparation involves the deposition of 50 nm Ti layer (using magnetron<br />
sputtering) on Si wafer with SiO2 thermal oxide and subsequent evaporation of Al layer<br />
(700 nm). The anodization procedure takes place in the utility model equipment for<br />
electrochemical post-processing deposition fabricated in our laboratory. Thanks to<br />
different anodizing behavior of Al and Ti layers, the same electrolyte during the whole<br />
process can be applied. Sulphuric acid was chosen as electrolyte since it is known to<br />
provide smaller pore diameter in template compared to other commonly used electrolytes.<br />
The anodization process ran in constant potential mode under various conditions<br />
(electrolyte concentration, temperature, anodization voltage) to obtain as smallest QDs as<br />
possible. After QDs fabrication, the alumina template was removed by etching in a<br />
mixture of H3PO4 (50 ml L –1 ) and CrO3 (30 g L –1 ) for 5 min at 60 °C.<br />
Phase composition, surface topology and photoluminescence studies were performed<br />
through Raman spectroscopy (T64000, Jobin-Yvon), SEM (Mira, Tescan) and fluorescence<br />
spectroscopy (Horiba, Jobin-Yvon), resp. Before Raman and fluorescence characterization,<br />
the samples were annealed at 390 °C for 1h in vacuum furnace.<br />
3. RESULTS AND DISCUSSION<br />
The smallest size of TiO2 QDs was reached under anodic oxidation of Ti in 3 M<br />
sulphuric acid under 4 V at 9 °C. Fig. 1 left shows SEM image of TiO2 QDs array with<br />
approx. diameter and height less than 10 nm created on Ti layer. The nanodots densely<br />
covered titanium surface with interdot distance from 5 to 10 nm. These TiO2 QDs were<br />
found in anatase crystallographic form, as can be seen in Raman spectrum (Fig. 2) with<br />
two characteristic anatase peaks at 537 cm -1 (corresponding to A1g and B1g vibrational<br />
mode) and at 640 cm -1 (corresponding to Eg vibrational mode). Fig. 3 represents the<br />
emission spectra of annealed and non-annealed TiO2 QDs taken with filter cut-off<br />
(400 nm). No photoluminescence was observed for as-prepared QDs (see inset image),<br />
while a broad emission peak appeared in visible range in the case of heat-treated QDs.<br />
XRD analysis was also performed to characterize the sample composition but it brought<br />
no results probably due to texture. Hence electron backscatter diffraction measurement is<br />
now under process.<br />
- 102 -
XI. Woorkshop<br />
of Physsical<br />
Chemists and a Electrochemmists´11<br />
Fiig.1<br />
SEM im mage of TiOO2<br />
QDs after<br />
alumina template t diissolving<br />
Fig. .2 Raman sp pectrum off<br />
TiO2 QDs with dominating<br />
anattase<br />
phase<br />
Fig.33<br />
Emission spectrum of annealeed<br />
TiO2 QD Ds with the<br />
inset ima mage corresp ponding too<br />
emissionn<br />
of as-prep pared TiO2 QQDs<br />
without<br />
thermal treatment<br />
4. CONCLUUSION<br />
Ordered arrays of titania QDDs<br />
with siz ze below 10 nm achhieved<br />
by successivee<br />
anoddization<br />
off<br />
aluminiu um and tiitanium<br />
la ayers in su ulphuric aacid<br />
revealed<br />
strongg<br />
- 103 -<br />
Brnoo
XI. Workshop of Physical Chemists and Electrochemists´11 Brno<br />
luminescence. After further surface modification with suitable biomolecules such as DNA,<br />
these arrays may be used for biosensing purposes and in vitro imaging. Thanks to this<br />
sensors arrangement, where each sensor can be created from QDs emitting the light at the<br />
different wavelength, it could be possible to easily detect many different biomolecules at<br />
the same time.<br />
5. ACKNOWLEDGEMENT<br />
The financial support from the grants GACR P102/10/P618 and KAN 208130801 is<br />
highly acknowledged.<br />
6. REFERENCES<br />
[1] Bao, S.J., Li, C.M.; Zang, J.F., Cui, X.Q., Qiao, Y.: Adv. Func. Mater., 18 (2008) 591<br />
[2] Chen, P.L., Kuo, C.T., Pan, F.M., Tsai, T.G.: Appl. Phys. Lett. 84 (2004) 3888<br />
[3] Drbohlavova, J., Adam, V., Kizek, R., Hubalek, J.: Int. J. Mol. Sci., 10 (2009) 656<br />
- 104 -
XI. Woorkshop<br />
of Physsical<br />
Chemists and a Electrochemmists´11<br />
DEETERMMINAT<br />
TION OF SA ARCO OSINE AS<br />
POOSSIBBLE<br />
TU UMOUUR<br />
MA ARKER R OF PPROS<br />
STATE<br />
TUUMOUURS<br />
AND A ROUTINE<br />
BIOCHEEMICA<br />
AL<br />
TEESTS<br />
IN<br />
URINE<br />
SAAMPL<br />
LES<br />
Nataalia<br />
CERNE<br />
SOCHOR1<br />
EI<br />
, Petr<br />
1 , Michal M<br />
r BABULA3 MASAŘÍK 2 , Jaromír G<br />
3 , René KIZZEK<br />
1<br />
2 Dep<br />
Absstract<br />
Aminno<br />
acid sarrcosine,<br />
kn nown also aas<br />
N-methy ylglycine, may m be esta tablished as s new veryy<br />
impoortant<br />
markker<br />
in prostate<br />
malignnant<br />
tumou urs and may y be determmined<br />
by very v simplee<br />
test. Cancer of prostate is s one of thee<br />
most incident<br />
types s of malignnant<br />
tumou urs in men. .<br />
Moree<br />
than one thousand men m in Czeech<br />
Republ lic die due to this diseease.<br />
As we ell as in thee<br />
case of other malignant<br />
tu umours, for initiation of o treatmen nt well timeed<br />
diagnosis<br />
of diseasee<br />
is neecessary.<br />
1.<br />
11<br />
Department t of Chemistry y and Biochemmistry<br />
Mende<br />
partment of PPathological<br />
Physiology, P Fa Faculty of Med<br />
CZ-662 2 43 Brno, Czeech<br />
Republic 3<br />
el University, Zemedelska a 1, CZ-613 00 0 Brno, Czechh<br />
Republicc<br />
dicine, Masary ryk University ty, Komenskeh eho namesti 2, 2,<br />
3Department t of Natural Dr Drugs, Faculty y of Pharmacyy<br />
INTRODDUCTION<br />
Sarccosine<br />
is naturally n occurring<br />
nnon-toxic<br />
amino a acidd<br />
soluble inn<br />
water. Sarcosine S may be pplaced<br />
into o group off<br />
biogenic aamines,<br />
wh hich occur in differennt<br />
types of foods f (fish, ,<br />
meat, beer,<br />
wine, cabbage, olives). Inn<br />
foods, sa arcosine iss<br />
origiinated<br />
durinng<br />
process of proteins fermentati ion by actio on of variouus<br />
kinds of organisms. .<br />
At iits<br />
consummmation,<br />
sa arcosine paasses<br />
to urine u in un nchanged form. Sarc cosine alsoo<br />
origiinates<br />
in livver<br />
and kidneys<br />
as inteermediate<br />
of o choline metabolism m m. At the be eginning off<br />
20099,<br />
study demmonstrating<br />
g diagnostiic<br />
potential l of this am mino acid wwas<br />
publish hed in veryy<br />
presttigious<br />
jourrnal<br />
Natur re. Sarcosinne<br />
is very reputable marker als lso in early y stages off<br />
tumoours.<br />
Very important is also facct<br />
that sarcosine<br />
was not presennt<br />
in urine of healthyy<br />
peopple.<br />
Due to this fact, probabilityy<br />
of false positivity p of f investigattion<br />
is min nimized. Inn<br />
accorrdance<br />
witth<br />
published d results, saarcosine<br />
is significant tly preferabble<br />
marker of prostatee<br />
canccer<br />
to prosstate-specif<br />
fic antigenee,<br />
whose presence p in<br />
blood iss<br />
routinely y analysed. .<br />
Preseence<br />
of ammino<br />
acid sarcosine s inndicates<br />
rig ghtly aggre essive, highh-malignan<br />
nt tumours. .<br />
Aim of our woork<br />
consiste ed in desiggn<br />
of chrom matographi ic method for determ mination off<br />
sarcoosine<br />
in uriine<br />
sample.<br />
Identificaation<br />
and determinati d on was donne<br />
by spiki ing and byy<br />
methhod<br />
of stanndard<br />
addi ition of saarcosine<br />
to the samp ple of urinne.<br />
We we ere able too<br />
deterrmine<br />
ultrra<br />
low sarcosine<br />
cconcentrati<br />
ions as well w becauuse<br />
we used u ionexx<br />
chroomatographhy<br />
on apparatus<br />
Aminoo<br />
Acid Ana alyzer AAA 400.<br />
- 105 -<br />
GUMULEC 2<br />
2 , Ondřej ZZÍTKA1<br />
, Jiři i<br />
Brnoo
XI. Workshop oof<br />
Physical Cheemists<br />
and Electrochemists´11<br />
2. EXPPERIMENTT<br />
The sarcosine oof<br />
99% puri ity was obttained<br />
from m Fluka Bio oChemika ( (Switzerlan nd). A<br />
solution off<br />
the sarcossine<br />
for pre eparation oof<br />
the calibr ration curv ve was preppared<br />
in a buffer b<br />
Na:TDG ( (N3Na-0.10 g,NaCl-11 1.5 g, C6H88O7-14g<br />
in 1 l of H2O O). The sepparation<br />
of<br />
the<br />
sarcosine wwas<br />
carriedd<br />
out with utilizationn<br />
of the ion nex chroma atography oon<br />
an appa aratus<br />
Amino Accid<br />
Analyzeer<br />
AAA 40 00 (Ingos, CCzech<br />
Rep public). The e AAA anaalyser<br />
work ks on<br />
basis of medium ppressure<br />
li iquid chroomatograph<br />
hy with ionex i coluumn<br />
ninhy ydrin<br />
derivatizattion<br />
and phhotometric<br />
detection aat<br />
520 nm.<br />
Fig. 1 Caliibration<br />
cuurve<br />
of sarco osine<br />
Absorbance<br />
75<br />
50<br />
25<br />
0<br />
0<br />
Cys<br />
Sar<br />
H-Cys<br />
Linear<br />
Linear<br />
Linear<br />
200 400<br />
CCalibration<br />
curve<br />
y = 0.0658x<br />
R2 x + 0.0154<br />
= 0.99986<br />
CConcentration<br />
(mmM)<br />
Fig. 2 Calibbration<br />
currve<br />
sarcosin ne in presennce<br />
of cyste eine and ho omocysteinee.<br />
- 106 -<br />
600<br />
y = 0.0566x - 0<br />
R2 .3913<br />
= 0.99244<br />
y = 00.0266x<br />
- 0.279<br />
R2 94<br />
= 0.9984<br />
800 1000<br />
1200<br />
Brno
XI. Woorkshop<br />
of Physsical<br />
Chemists and a Electrochemmists´11<br />
3. RESULTS<br />
AND DISCUSSIO<br />
D ON<br />
In the exxperimental<br />
l part, we ffirstly<br />
focu used on an analytical determinat tion of thee<br />
sarcoosine.<br />
Ionex<br />
chromato ography wwas<br />
chosen as the mos st suitable analytical technique. .<br />
The sarcosine wwas<br />
analyse ed in a testted<br />
concen ntration sca ale from 5 tto<br />
1000 μM M. Error off<br />
deterrmination<br />
wwas<br />
about 8%. 8<br />
Well resoolved<br />
signal l of sarcosi<br />
The calibrationn<br />
curve was s linear in<br />
and correlationn<br />
coefficien nt R<br />
500 nnM<br />
(3S/N). The limit o<br />
2 ine with migration m tim me of 32 mminutes<br />
was<br />
obtained. .<br />
entire test ted range with w equatioon:<br />
y=0.0266x-0.27944<br />
=0.99884.<br />
Limit of f detection of sarcosinne<br />
was dete ermined ass<br />
of quantificcation<br />
of sa arcosine wa as determinned<br />
as 5 μM (10 S/N).<br />
Analysis oof<br />
sarcosine e in presennce<br />
of two hardly dete erminable aamino<br />
acid ds (cysteinee<br />
and homocysteeine)<br />
was ca arried out. Presence of o these tw wo amino aacids<br />
had no<br />
effect onn<br />
chroomatographhic<br />
signals of o sarcosinee.<br />
All chro omatograph hic signals wwere<br />
resolv ved (Fig. 1<br />
and Fig.2). Freee<br />
amino acids a are prresent<br />
in biological b samples s – due to thi is fact it iss<br />
absollutely<br />
neceessary<br />
to propose p suuitable<br />
tech hnique for determinaation<br />
of sa arcosine inn<br />
preseence<br />
of free<br />
amino ac cids. In ourr<br />
next expe eriment, sa arcosine at concentrat tion 10 μMM<br />
was added intoo<br />
a mixture of 17 aminno<br />
acids of f 20 μM con ncentrationn.<br />
Fig. 3 demonstratess<br />
typiccal<br />
chromaatographic<br />
record. TThe<br />
individ dual amino o acids aree<br />
well sep parated; noo<br />
interrferences<br />
wwith<br />
determ mined sarcossine<br />
were observed. o<br />
Fig. 3 Typical chromatogra<br />
aphic recorrd<br />
of comm mon amino acids a with aaddition<br />
of f sarcosine<br />
Humman<br />
urine samples collection<br />
c n and prep paration<br />
Patients: UUrine<br />
samp ples were oobtained<br />
fro om patients s hospitalizzed<br />
at the Department<br />
D t<br />
of UUrology<br />
oof<br />
St. An nne´s Uniiversity<br />
Hospital H Br rno diagnnosed<br />
with h prostatee<br />
adennocarcinomma<br />
(n=11). Average A agge<br />
was 62-76<br />
years. The sarcossine<br />
of con ncentrationn<br />
15 μMM<br />
-1480 μMM<br />
was dete ected in urrine<br />
sample es from pat tients (Fig.33).<br />
The sam mples fromm<br />
curedd<br />
patients ddiagnosed<br />
with w prostaate<br />
adenoca arcinoma (n n=11) (Depaartment<br />
of Urology off<br />
St. AAnne´s<br />
Univversity<br />
Hos spital Brno) ) were anal lysed.<br />
- 107 -<br />
Brnoo
XI. Workshop of Physical Chemists and Electrochemists´11 Brno<br />
Samples from healthy volunteers (n=30, average age 17-31 years) were obtained<br />
from students Faculty of Agronomy, Mendel University in Brno. In the samples from<br />
healthy volunteers sarcosine wasn’t detected. The urine samples were primarily intended<br />
for routine biochemical tests at the Department of Chemistry Biochemistry, Faculty of<br />
Agronomy, Mendel University in Brno. Urine samples were diluted 10 times (100μl<br />
sample urine+900μl buffer) in buffer Na:TDG (N3Na-0.10 g,NaCl-11.5 g, C6H8O7-14g in 1 l<br />
of H2O).<br />
Fig.4.: Sarcosine contents in patients and control group<br />
Fig.5.: Uric acid contents in patiens, cured and control group<br />
- 108 -
XI. Woorkshop<br />
of Physsical<br />
Chemists and a Electrochemmists´11<br />
Fig.6.: Ur rea contentts<br />
in patiens s, cured and d control grroup<br />
Fig.7.: Glucose<br />
contennts<br />
in patiens,<br />
cured and<br />
control group<br />
4. CONCLUUSION<br />
Chromatoographic<br />
method m enaabling<br />
sim multaneous determinat ation of sa arcosine inn<br />
preseence<br />
of 17 free amino o acids was designed in n our exper rimental wwork.<br />
In pat tients urinee<br />
sampple<br />
sarcosinne<br />
was det tected and in urine samples<br />
from<br />
healthy y volunteers<br />
sarcosinee<br />
wasnn´t<br />
detecteed.<br />
In cure ed patientss<br />
samples sarcosine wasn’t dettected,<br />
bec cause afterr<br />
hemiioterapy<br />
deetection<br />
of f sarcosine is not possible.<br />
Amo ong others biochemic cal markerss<br />
sarcoosine<br />
is thee<br />
only one e exhibitingg<br />
statistical lly significa ant differennce<br />
betwee en patientss<br />
and control grroup.<br />
Increasing<br />
levell<br />
of glucose<br />
is also observed, o hhowever<br />
th his trend iss<br />
statisstically<br />
incconclusive<br />
due d to the small num mber of peo ople in eacch<br />
group. In<br />
contrast, ,<br />
urea and uric accid<br />
are inde ependent prrostate<br />
can ncer.<br />
It shhould<br />
be nooted<br />
that elevated e leevels<br />
of cer rtain bioma arkers mayy<br />
be assoc ciated withh<br />
age of patientss<br />
and the possible ppresence<br />
of o other diseases.<br />
Inn<br />
contrast, sarcosinee<br />
conttent<br />
is age independe ent and itss<br />
associatio on with oth her diseasees<br />
will be the<br />
subjectt<br />
- 109 -<br />
Brnoo
XI. Workshop of Physical Chemists and Electrochemists´11 Brno<br />
of further research. Compared to other biomarkers, sarcosine adds even more<br />
diagnostic potential for prediction of CaP. Further validation experiments and<br />
optimization for the strategy of constructing this model are warranted.<br />
5. ACKNOWLEDGEMENT<br />
The work has been supported by grants: GACR 301/09/P436, IGA MZ 10200-3 and<br />
NANOSEMED GA AV KAN208130801, IGA MZ 10200-3<br />
6. REFERENCES<br />
[1] Jamaspishvili T, Kral M, Khomeriki I:, J.: PROSTATE CANCER AND PROSTATIC DISEASES , 13<br />
(2010),, 12-19,1.<br />
[2] Gonzalez DE, Covitz KMY, Sadee W.:, J.:CANCER RESEARCH, 58<br />
[3]<br />
(1998), 519-525,3.<br />
WoganGN, Paglialunga S, Archer MC.J: CANCER RESEARCH,35 (1975), 1981-1984 , 8.<br />
[4] Sreekumar A, Poisson LM, Rajendiran TM, et al.: Nature (2009), 457, 910-914<br />
[5] Lucarelli G, Larocca A, Fanelli M, et al. EUROPEAN UROLOGY SUPPLEMENTS(MAR 2011) 10 ,2<br />
,205-205<br />
[6] Cao DL, Ye DW, Zhang HL, et al. PROSTATE (MAY 15 2011) 71 , 7 , 700-710<br />
[7] Issaq HJ, Waybright TJ, Veenstra ELECTROPHORESIS(APR) 32 Issue: 9 , SI, 967-975<br />
[8] Jentzmik F, Stephan C, Lein M, et al. JOURNAL OF UROLOGY(FEB 2011 ),185,2,706-711<br />
- 110 -
XI. Workshop of Physical Chemists and Electrochemists´11 Brno<br />
PHOTOCURRENT GENERATION IN INKJET<br />
PRINTED TIO2 LAYERS<br />
Petr DZIK 1 , Magdalena MOROZOVÁ 2 , Michal VESELÝ 1<br />
1 Brno University of Technology, Faculty of Chemistry, Purkyňova 118, 612 00 Brno, Czech Republic<br />
2 Institute of Chemical Process Fundamentals of the ASCR, v.v.i., Department of Catalysis and Reaction<br />
Engineering, Rozvojová 135, 165 02 Prague 6, Czech Republic<br />
Abstract<br />
TiO2 layers were prepared by inkjet printing of reversal micelles sol onto ITO substrates.<br />
Printed films of various thickness were thermally gelled and calcined. Layer homogeneity,<br />
thickness and morfology was studied by optical microscopy, SEM and AFM. The<br />
generation of charge carriers upon UV irradiation was studied by electrochemical<br />
methods.<br />
1. INTRODUCTION<br />
TiO2 photocatalysis has received much attention during the last two decades. When<br />
TiO2 is irradiated by photons of sufficient energy ( < 380 nm) [1], an electron excitation<br />
takes place followed by the creation of an electron-hole pair [2]. The electrochemical<br />
potentials of resulting charge carriers are sufficient to reduce molecular O2 and oxidize<br />
water to hydroxyl radicals. Subsequent reactions in aerated aqueous environment are<br />
somewhat complex producing the so called reactive oxygen species (ROS) as the main<br />
product. Despite their obscure origin, nature and short lifetime, ROS are very powerful<br />
oxidizing agents. They would quickly attack any organic matter in their proximity until it<br />
is totally cleaved to CO2 and water 0. Such process can be exploited for photocatalytic<br />
purification of water and air. ROS also attack the organic matter, including living<br />
organisms (viruses, bacteria, yeast and fungi), thus exhibiting deactivating and disinfecting<br />
effect. Unlike other disinfection processes, photocatalysis is capable of both inactivating<br />
bacteria and removing its toxins [4]. Moreover, a photoinduced reversible superhydrophilic<br />
conversion takes place on irradiated surface of TiO2, yielding a very low water<br />
contact angle. The combined effects of photocatalysis, photodisinfection and<br />
photoinduced superhydrophilicity form the platform for the design of smart self-cleaning<br />
surfaces.<br />
Sol-gel technique is one of the popular synthetic routes to thin coatings of TiO2. In<br />
sol-gel processes, TiO2 is usually prepared by hydrolysis and polycondensation of titanium<br />
alkoxides, which are then transformed into inorganic oxide by thermal calcination. The<br />
traditional methods of sol application include dip-coating, spin-coating and spray coating.<br />
These methods are widely used, yet they are burdened by several significant disadvantages<br />
(limited coated area, sensitivity to surface deffects etc). The authors have shown earlier 0<br />
that inkjet printing is an elegant method for sol delivery to substrate. It provides a<br />
complete control over the deposition process parameters together with an excellent<br />
efficiency of precursor use. Moreover, the possibility of precise patterning and the ease of<br />
- 111 -
XI. Workshop of Physical Chemists and Electrochemists´11 Brno<br />
upscaling make this deposition method very appealing for the production of sensors, solar<br />
cells etc.<br />
The photoexcitation properties of the prepared TiO2 layers and the ability to<br />
photocurrent generation were investigated by electrochemical methods – linear<br />
voltammetry and amperometry. The values of generated photocurrent were recalculated<br />
to Incident Photon to Current conversion Efficiency (IPCE) using the relation IPCE = i<br />
/(F×P), where i denotes for the photocurrent density [A cm -2 ], F for the Faraday constant<br />
(96.485 C mol -1 ) and P is the incident photon flux intensity [Einstein cm -2 s -1 ].<br />
2. EXPERIMENT<br />
Reverse-micelle sol was prepared according to 0. However, this time Triton X-102<br />
and xylen were used as surfactant and solvent. Sol deposition and patterning onto<br />
commercial ITO-coated glass was performed by a dedicated experimental inkjet printer<br />
Fujifilm Dimatix 2831. Prepared sol was sonicated for 5 minutes and then loaded into a<br />
syringe. A 0.2 m membrane filter and a blunt needle were attached to the syringe luer<br />
port and the sol was filtered and filled into the Dimatix ink tank in once. A Dimatix 10 pL<br />
printing head was attached to the the tank and these were mounted into the Dimatix<br />
printer. Since the sol is a true analytical solution and does not contain any solid<br />
components, the jetting performace was excellent and all 16 nozzlez were used for<br />
printing.<br />
Printed layers were dryed and gelled at 110 °C for 30 min and calcined in an<br />
furnance by heating at 3 °C min –1 to 450 °C and keeping at this temperature for 4 hours.<br />
However, two distinctive processing ways were adopted for the multilayered samples:<br />
Single calcinated (SC-n) series of samples was prepared by printing 1-4 layers of<br />
sol. After printing, the sample was gelled and calcined.<br />
Repeatedly calcined (RC-n) samples were prepared by repeated printing, gelling<br />
and calcination after printing each layer. In both cases, n indicates the number of<br />
layers.<br />
Microphotograps of printed layers were recorded using Nikon Eclipse E200 optical<br />
microscope equipped with a Nikon D5000 digital camera and Nikon Camera Control Pro 2<br />
software. Captured RAW images were processed by Adobe Lightroom. The surface<br />
morphology and layers thickness was also investigated by the SEM and AFM.<br />
Photoelectrochemical measurements were performed in a three-electrodes cell<br />
(working el. TiO2/ITO, reference el. Ag/AgCl/KCl(sat), Pt counter el.). As a supporting<br />
electrolyte the water solution of Na2SO4 (0.1M) was used and the wavelength of the<br />
incident light was focused on 365 nm by an interference filter.<br />
3. RESULTS AND DISCUSSION<br />
SEM imaging was employed to determine the layer thickness. Fig. 1 clearly depicts<br />
that the thickness of 3 layers is approx. 340 nm, giving cca 110 nm per single layer. AFM<br />
scan shows the globular structure of the layer originating from the micellar nature of the<br />
sol. The RMS roughness was 5.7 nm.<br />
- 112 -
XI. Woorkshop<br />
of Physsical<br />
Chemists and a Electrochemmists´11<br />
Fig.11<br />
AFM scann<br />
of sample SC-1 and SSEM<br />
cross-s<br />
The electtrochemical<br />
l response of prepared<br />
layers to irradiationn<br />
was imm mediate andd<br />
compparable<br />
to ddip-coated<br />
layers of simmilar<br />
thick kness. Howe ever, the reeached<br />
valu ues of IPCEE<br />
tendd<br />
to be sommewhat<br />
low wer than inn<br />
the case of o dip-coat ting (IPCE was 0,035 for 3 dip-<br />
coateed<br />
layers hhaving<br />
thic ckness apprr.<br />
330 nm) . Worth noting<br />
is thhe<br />
growing differencee<br />
betwween<br />
RC annd<br />
SC laye ers of the same thick kness. Resu ults from oother<br />
analy ysis (XRD) )<br />
indiccate<br />
that thhe<br />
RC laye ers are madde<br />
of large er crystallit tes due to repeated calcination, c ,<br />
durinng<br />
which the re-hea ated materrial<br />
forming<br />
lower la ayer rearraanges<br />
to fo orm biggerr<br />
crysttallites.<br />
IPCE<br />
0.022<br />
0.01<br />
0.000<br />
-0.01<br />
-400 -200<br />
0 200 400 600<br />
Potential (mV)<br />
SC, 1layeer<br />
RC, 1 layyer<br />
SC, 2 layers<br />
RC, 2 layyers<br />
SC, 3 layers<br />
RC, 3 layyers<br />
ITO<br />
800 1000<br />
Fig.22-left:<br />
Polarization<br />
cu urves of linnear<br />
voltam<br />
light/darrk<br />
period. Right: R The photocurre<br />
0.6 V (AAg/AgCl)<br />
at 10 mW/cmm<br />
2 mmetry, irr radiation att<br />
5 s interv vals of thee<br />
ent-time be ehaviour wwith<br />
constan nt potentiall<br />
irradiatio on.<br />
4. CONCLUUSION<br />
Thin oxidde<br />
semicond ductor layeers<br />
have be een prepare ed by inkjeet<br />
printing and sol-gell<br />
process.<br />
Not onnly<br />
the laye er thicknesss<br />
but also the therma al history hhas<br />
signific cant impactt<br />
on chharge<br />
generration,<br />
as th hicker and repeatedly y calcined la ayers give hhigher<br />
values<br />
of IPCE. .<br />
section of R<br />
IPCE<br />
- 113 -<br />
0.02<br />
0.01<br />
0.00<br />
0 20 40<br />
RC-3 samplles<br />
60 80 100<br />
120 140 160 1880<br />
200 220 240<br />
Time<br />
(s)<br />
Brnoo<br />
SC, 1 layer<br />
RC, 1 layer<br />
SC, 2 layers<br />
RC, 2 layers<br />
SC, 3 layers<br />
RC, 3 layers<br />
ITO
XI. Workshop of Physical Chemists and Electrochemists´11 Brno<br />
5. 4.ACKNOWLEDGEMENT<br />
This work has been supported by project 104/09/P165 of the Czech Science<br />
Foundation.<br />
6. REFERENCES<br />
[1] Blount, M. C., Kim, D. H., Falconer, J. L., Environmental Science & Technology 35 (2001), 14, 2988-<br />
2994.<br />
[2] Han, F., et al., Applied Catalysis A: General, 359 (2009), 1-2, 25-40.<br />
[3] Mills, A., Le Hunte, S., Journal of Photochemistry and Photobiology A: Chemistry, 108 (1997), 1, 1-<br />
35.<br />
[4] G. S. Shephard, et al., Water Research, 36 (2002), 1, 140-146<br />
[5] Dzik P., Veselý M., Chomoucká J., Journal of Advanced Oxidation Technologies, 13 (2010), 2, 172-<br />
183<br />
[6] Klusoň, P., Lusková, H., Cajthaml, T., Šolcová, O. Thin Solid Films, 495 (2006), 1-2, 18-23<br />
- 114 -
XI. Workshop of Physical Chemists and Electrochemists´11 Brno<br />
OPTICAL SPECTROSCOPY IN MODERN<br />
BIOPHYSICAL RESEARCH<br />
Tomáš FESSL 1<br />
1 Tomáš Fessl, Institute of Physical Biology, University of South Bohemia, Zamek 136, Nove Hrady<br />
Abstract<br />
UV/VIS optical spectroscopy evolved in last few decades into a powerful and sensitive tool<br />
widely used in biophysical, chemical and biological sciences. Rapid development of new<br />
technologies implemented into experimental instruments led to distinct improvement of<br />
spatial and temporal sensitivity, hence improved applicability to solve complex problems.<br />
Here, we show the advantages of Single-Molecule Fluorescence Spectroscopy (SMFS) and<br />
Fluorescence Correlation Spectroscopy (FCS) employed in detection of CHD4 protein<br />
translocating along DNA as ATP-driven molecular motor and in detection of MS2<br />
bacteriophage capsid assembly, respectively. On the example of fast charge transfer<br />
between DNA and fluorescent dye QSY 21, we demonstrate the ultrasensitive temporal<br />
resolution of femtosecond transient absorption spectroscopy.<br />
1. CONTENT<br />
Huge development in electronics, computer science and the consequent<br />
implementation of this technology into scientific instrumentation facilitated birth or<br />
distinct improvement of many novel concepts in UV/VIS spectroscopy. Here we will<br />
show the main advantages and applications of two advanced fluorescence and one<br />
absorption technique.<br />
Fluorescence techniques take advantage of great spatial and decent temporal<br />
resolution. Here we report FCS and Förster Resonance Energy Transfer (FRET) on<br />
individual molecules. FCS is one of the fluctuation techniques, detecting via<br />
autocorrelation or crosscorrelation changes in fluorescence intensity in approximately<br />
femtolitre volume. Via these fluctuations, FCS provides information about diffusion<br />
coefficients, triplet state lifetime and dye photophysics, such as blinking, fluorescence<br />
quenching and FRET kinetics. Here we utilize FCS to create simple tool for detection of<br />
virus capsid assembly on the model virus. During long assembly time, we measure FCS<br />
record on labelled MS2 bacteriophage's simplified assembly components and calculate the<br />
probability distribution of diffusion coefficients as a function of assembly time via inverse<br />
Laplace transform (Fig. 1).<br />
- 115 -
XI. Workshop oof<br />
Physical Cheemists<br />
and Electrochemists´11<br />
Fig. 1 Capsid<br />
formatiion<br />
during 400 minutees<br />
of assem mbly time. The T curves were calcu ulated<br />
fromm<br />
inverse Laplace tr ransforms oof<br />
individu ual FCS re ecords. Twoo<br />
datasets with<br />
diffferent<br />
initial<br />
assembly y conditionns<br />
are show wn, their as ssembly traajectories<br />
visibly<br />
difffer,<br />
hence wwe<br />
claim, the t methodd<br />
is capable to detect complex c sysstem<br />
behav viour,<br />
succh<br />
as fallingg<br />
into kinetic<br />
traps andd<br />
subsequen nt escape.<br />
To inntroduce<br />
siingle-molec<br />
cule FRET, we presen nt the study y of humann<br />
CHD4 pr rotein<br />
translocatiion<br />
activityy.<br />
Due to changes oof<br />
the FRE ET efficienc cy, we cann<br />
track lab belled<br />
protein sttepping<br />
aloong<br />
DNA molecule, , reveal it ts directionality<br />
andd<br />
elucidate e the<br />
dependencce<br />
of translocation<br />
mo ovement onn<br />
ATP meta abolism (Fig g. 2).<br />
Fig 2. Trannslocation<br />
activity of f human CHHD4<br />
protei in in the presence<br />
of ATP. From m the<br />
FREET<br />
(or prooximity<br />
ra atio) time trajectories s, direction nality, dweell<br />
times (Δt1), (<br />
trannslocation<br />
ttimes<br />
(Δt2) and step siize<br />
(Δp1 an nd Δp2) can be revealed.<br />
Ultraafast<br />
transient<br />
absorpt tion spectrroscopy<br />
as an a example e of absorpption<br />
techn niques<br />
offers the possibility to study kinetics<br />
of eexcited<br />
stat te absorptio on, ground state bleac ching,<br />
stimulatedd<br />
emission, charge tra ansfer and other phot tophysical processes oon<br />
femtose econd<br />
- 116 -<br />
Brno
XI. Woorkshop<br />
of Physsical<br />
Chemists and a Electrochemmists´11<br />
time scale. Heree<br />
we emplo oyed this teechnique<br />
to o explore th he interactioon<br />
between n DNA andd<br />
termminally<br />
attaached<br />
non-fluorescentt<br />
quencher r QSY 21 (Fig. 3) annd<br />
the pho otophysicall<br />
propperties<br />
of thhe<br />
quencher r itself.<br />
Fig.<br />
3.<br />
[1]<br />
3 Two maain<br />
binding g motifs obbtained<br />
fro om molecular<br />
dynamiics<br />
simulat tion of thee<br />
DNA-QS QSY 21 com mplex [1]. TThe<br />
dye is covalently c attached too<br />
DNA via six carbonn<br />
flexible llinker.<br />
Dur ring the timme,<br />
QSY 21 spend in binding b mottif<br />
captured d at the topp<br />
photo-innduced<br />
elec ctron transffer<br />
is highly y probable.<br />
2. ACKNOWWLEDGEM<br />
MENT<br />
The workk<br />
has been n supported<br />
by “Bioa active Bioc compatible Surfaces and Novell<br />
Nanoostructuredd<br />
Composites<br />
for AApplication<br />
ns to Me edicine annd<br />
Drug Delivery”, ,<br />
KANN2001008011.<br />
REFERENNCES<br />
Kabelac, M. .: Phys. Chem m. Chem. Phyys.,<br />
12 (2010), 9677-9684<br />
- 117 -<br />
Brnoo
XI. Workshop of Physical Chemists and Electrochemists´11 Brno<br />
AN ELECTROCHEMICAL SPM UNDER FULL<br />
ENVIRONMENTAL CONTROL<br />
Fiona FREHILL 1<br />
1 Fiona Frehill, Agilent Technologies, 610 Wharfedale Road, IQ Winnersh, Wokingham, Berkshire, RG41<br />
5TP, UK, fiona_frehill@agilent.com<br />
For over two decades, scanning probe microscopy (SPM) has provided scientists a<br />
unique tool to study in situ electrochemical (EC) processes with atomic/molecular<br />
resolution. New discoveries continue to be reported as the research boundary expands<br />
wider and deeper. While the field steadily advances, the requirements for electrochemical<br />
scanning probe microscopes also become greater. A substantial effort has been made by<br />
Agilent over the past years to provide an EC SPM device which - in addition to clean<br />
liquid imaging and atomic and molecular resolution – provides an oxygen-free<br />
environment. This has been considered critical for many EC SPM studies, highlighting the<br />
oxygen-elimination capability of our standard environmental chamber, plus the optional<br />
use of a fully integrated glove box.Examples presented range from studies of metallic and<br />
molecular layers under electrochemical and environmental control (temperature, solvent,<br />
atmosphere), studies of electron-transfer, electro-polymerization of poly-electrolytes<br />
using cyclic voltammetry, up to studies of “real-world” samples like corrosion studies on<br />
steel alloys or applications in non-aqueous battery technology (Lithium-and Zinc-based<br />
substrates).<br />
In summary several techniques and examples will be shown that demonstrate the<br />
capabilities of electrochemical SPM for topographical imaging on the nanometer scale and<br />
simultaneously modifying a surface under potentiostatic and environmental control.<br />
- 118 -
XI. Workshop of Physical Chemists and Electrochemists´11 Brno<br />
HEAVY METALS IN PROSTATE CANCER<br />
CELL LINES<br />
Jaromír GUMULEC 1 , Marian HLAVNA 1 , Markéta SZTALMACHOVÁ 1 , Šárka<br />
KUCHTICKOVÁ 1 , Roman HRABEC 2 , Arne ROVNÝ 2 , Soňa KŘÍŽKOVÁ 4 , Petr BABULA 3 ,<br />
Vojtěch ADAM 4 , René KIZEK 4 , Michal MASAŘÍK 1<br />
1 Department of Pathological Physiology, Faculty of Medicine, Masaryk University, Kamenice 5, CZ-625 00<br />
Brno, Czech Republic<br />
2 Department of Urology, St. Anne´s University Hospital, Pekarska 53, CZ-65691, Brno<br />
3 Department of Natural Drugs, Faculty of Pharmacy, University of Veterinary and Pharmaceutical Sciences<br />
Brno, Palackeho 1/3, CZ-612 42 Brno, Czech Republic<br />
4 Department of Chemistry and Biochemistry, Mendel University in Brno, Zemedelska 1, CZ-613 00 Brno,<br />
Czech Republic<br />
Abstract<br />
Prostate cancer is second leading cause of death among men. In the present time, prostate<br />
specific antigen (PSA) is the only tumor marker used for carcinoma detection. This tumor<br />
marker has high level of sensitivity, but lower level of specificity, so it can be increased<br />
either in inflammation or in prostate hyperplasia. It is desirable to find a new markers or<br />
genes with higher level of specificity. The aim of this study is to describe the level of<br />
metallothionein using electrochemical methods and real time PCR in prostatic cell lines<br />
after stimulation by various heavy metals.<br />
4. INTRODUCTION<br />
Prostate tissue is specific in zinc metabolism – it accumulates high level of zinc(II) –<br />
up to ten times higher compared to other tissues. In such concentration, zinc(II) affects<br />
energetic metabolism, antioxidative processes and apoptosis. High zinc(II) content affect<br />
apoptosis through the formation of BAX pores on the outer mitochondrial membrane.<br />
Cytochrome-C can further be released from mitochondria and can trigger cascade of<br />
caspases resulting in increased apoptosis.[1]<br />
Metallothioneins play a key role in metabolism, transport and storage of heavy<br />
metals. Due to zinc(II) high affinity to proteins following the Irving-Williams series,<br />
metallothioneins bind mostly zinc(II).[2, 3] When zinc(II) ions get into a cytosol through<br />
zinc transporters, it is immediately buffered by metallothionein, thus the free zinc(II) ions<br />
level is maintained on very low level. Due to signalling roles of free zinc(II) ions,<br />
metallothionein plays an important role in this process because of its level regulation.<br />
Metallothioneins also protect cells against oxidative stress,[2] because they cooperate with<br />
reduced glutathione (GSH).[4] Due to these features it is not surprising that MTs are<br />
overexpressed under conditions with increased risk of reactive oxygen species formation<br />
such as cell proliferation or embryonic development.[4] A lot of recent studies indicate<br />
elevated serum levels of metallothioneins in number of malignancies such as breast,<br />
bronchial, urogenital, colorectal, prostate carcinomas, melanoma and several<br />
lymphoma.[2]<br />
- 119 -
XI. Workshop of Physical Chemists and Electrochemists´11 Brno<br />
However, it was found that the level of intracellular zinc(II) of lateral lobes of<br />
prostate is significantly lower in patients suffering from prostate cancer.[5]This is due to<br />
the loss of ability to accumulate zinc(II) of prostate cancer cells.[6] Together with the<br />
finding that lateral lobes are also the major site of initiation of malignancy and zinc(II) has<br />
effects on apoptosis and proliferation, it is expectable that zinc(II) may play an important<br />
role in prostate cancer pathogenesis. According to results from recent studies, in zincimport<br />
transporter family, reduced expression of ZIP1 protein was identified.[7]The<br />
importance of ZIP1 transporter in prostate (cancer) is emphasized by finding that this<br />
transporter does uptake the majority of zinc(II) from the circulation. Furthermore,<br />
another phenomenon of ZIP1 in prostate cancer was described: the increased expression<br />
of this transporter reduces the ability of prostate cancer to metastasize.[8] ZIP1 may<br />
therefore be regarded as a tumor suppressing gene. ZIP1 is down-regulated by RREB-1<br />
due to up-regulated RAS-RAF-MEK-ERK cascade.[9] However, this prostate cancerspecific<br />
zinc(II) dyregulation is still not fully clarified and needs further research that will<br />
lead to a more complex view on zinc(II) fluxes. As a consequence of zinc(II)<br />
downregulation, metallothionein level is significantly decreased.<br />
As a result of zinc(II)/metallohionein down-regulation, apoptic/antiapoptic balance,<br />
energetic metabolism and antioxidative capacity is changed. Cancer cells can become<br />
more energy-efficient compared to healthy "energy unefficient" prostate cells.[10]This<br />
phenomenon can also be used in prostate cancer to support tumor cell growth. In terms of<br />
apoptosis and proliferation of prostate cancer cells, overexpression of Bcl-2 was observed.<br />
Antiapoptic gene Bcl-2 is overexpressed in 30–60% of prostate cancer within the luminal<br />
epithelium in high-grade prostatic intraepithelial neoplasia lesions.[11, 12]. Bcl-2 inhibits<br />
caspase activity either by preventing the release of Cytochrome C from the mitochondria<br />
and/or by binding to the apoptosis-activating factor (APAF-1). Moreover, due to<br />
decreased zinc(II) level, BAX-Cytochrome C apoptic cascade is significantly silenced.[13]<br />
The aim of this study is to describe the level of metallothionein using<br />
electrochemical methods in prostatic cell lines after stimulation by various heavy<br />
metals.<br />
5. EXPERIMENT<br />
In this study, two cell lines were used: (1) 22Rv1, derived from a xenograft from<br />
androgen-dependent primary tumor of Gleason sum 9), (2) PNT1A, established by<br />
immortalisation of normal adult prostatic epithelial cells by transfection with SV40). Both<br />
cell lines used in this study were purchased from HPA Culture Collections (Salisbury,<br />
UK). Once the cells grew up to 50-60% confluence of the culture, the grow mediums were<br />
replaced by fresh medium for 24h to synchronize cell growth. The cells were then treated<br />
with or without zinc(II) (0–800μM), Copper (0–800 μM) and cadmium (0–150 μM) in<br />
fresh medium for 48h. Subsequently, thermal-mechanical lysates were prepared at 99 °C<br />
in a thermomixer (Eppendorf 5430, Germany) for 15 min with shaking. This is possible<br />
due to thermostable characteristics of metallotihioneins. For RNA isolation was used High<br />
pure total RNA isolation kit from Roche (Basel, CH), RNA lysates were prepared<br />
according to instruction manual.<br />
- 120 -
XI. Workshop of Physical Chemists and Electrochemists´11 Brno<br />
RT-PCR was performed in triplicate using the TaqMan gene expression assay system<br />
with the 7500 real-time PCR system (Applied Biosystems), and the amplified DNA was<br />
analyzed by the comparative Ct method using β-actin as an endogenous control. The<br />
primer and probe sets for β-actin (Assay ID: Hs00185826_m1), MT1 Assay ID:<br />
Hs00185826_m1) and MT2 (Hs00794796_m1) were selected from TaqMan gene.<br />
Metallothionein content was analysed electrochemically using differential pulse<br />
voltammetry. Measurements were performed with 747 VA Stand instrument connected to<br />
746 VA Trace Analyzer and 695 Autosampler (Metrohm, Switzerland), using a standard<br />
cell with three electrodes and cooled sample holder (4 °C). A hanging mercury drop<br />
electrode (HMDE) with a drop area of 0.4 mm2 was the working electrode. An<br />
Ag/AgCl/3M KCl electrode was the reference and glassy carbon electrode was auxiliary.<br />
For data processing GPES 4.9 supplied by EcoChemie was employed. The analyzed<br />
samples were deoxygenated prior to measurements by purging with argon (99.999 %),<br />
saturated with water for 120 s. Brdicka supporting electrolyte containing 1 mM<br />
Co(NH3)6Cl3 and 1 M ammonia buffer (NH3(aq) + NH4Cl, pH = 9.6) was used. The<br />
supporting electrolyte was exchanged after each analysis. The parameters of the<br />
measurement were as follows: initial potential of –0.7 V, end potential of –1.75 V,<br />
modulation time 0.057 s, time interval 0.2 s, step potential 2 mV, modulation amplitude -<br />
250 mV, Eads = 0 V, volume of injected sample: 20 μl (100 × diluted sample with 0.1 M<br />
phosphate buffer pH 7.0). All experiments were carried out at temperature 4°C employing<br />
thermostat Julabo F25 (Labortechnik GmbH, Germany).<br />
Software Statistica 9 was used to perform statistical analysis and visualization of<br />
results. Correlations were performed to evaluate dependency between variables,<br />
visualized results are those with p < 0.05 and those where strong dependence is present,<br />
i.e. with |r| > 0.85 and p is barely significant, i.e. close to 0.05.<br />
6. RESULTS AND DISCUSSION<br />
We have observed statistically significant strong correlation between zinc in<br />
medium and in cells (p = 0,001, r = 0,99) in 22Rv1 cancer cell line and, interestingly, we<br />
found statistically significant negative correlation, in PNT1A cell line suggesting<br />
significant differences in zinc transport between healthy and cancer cells.<br />
In terms of metallothionein, we found significantly elevated metallothionein protein<br />
level in healthy cell line, which is in contrary to previous studies (fig. 2 right). Moreover,<br />
we’ve observed significant correlations in PNT1A cell line between metallothionein level<br />
and zinc(II) (positive correlation r = 0,90 at p = 0,04) and copper(II) (negative correlation r<br />
= -0,98 at p = 0,002). We found no correlation between zinc(II) and metallothionein in<br />
cancer cell line 22Rv1. We found negative correlation between intracellular free zinc and<br />
metallothionein in PNT1A cell line (-0,93 at p = 0,02), not in 22Rv1 cell line (fig.1).<br />
In mRNA analysis, we found elevation of MT2A class of metallothionein as<br />
compared to MT1A class. Moreover, we found elevation of booth MT classes in cancer<br />
cell line (fig.2). This finding is not consistent with protein level of metallohionein. This is<br />
evidenced by finding, that MT protein level does not correlate with booth mRNA classes<br />
- 121 -
XI. Workshop of Physical Chemists and Electrochemists´11 Brno<br />
of metallothioneins except zinc-treated PNT1A cell line and MT2A gene (r = 0,94 at p =<br />
0,01). No similar evidence was observed in 22Rv1 cell line (data not shown).<br />
Intracellular free metal level<br />
Metallothionein/total protein (µg/mg)<br />
Metal: Cd<br />
Metal: Cu<br />
Metal: Zn<br />
Metal: Cd<br />
Metal: Cu<br />
Metal: Zn<br />
30<br />
20<br />
10<br />
0<br />
0,0<br />
0 40 80 120 0 20 40 60<br />
28<br />
24<br />
20<br />
16<br />
12<br />
8<br />
4<br />
0<br />
2,0<br />
1,6<br />
1,2<br />
0,8<br />
0,4<br />
60<br />
40<br />
20<br />
0 200 400 600 800<br />
0<br />
0 200 400 600 800<br />
Cell line: 22Rv1<br />
Metal in medium (µM)<br />
0,0<br />
0 40 80 120 160<br />
1,6<br />
1,2<br />
0,8<br />
0,4<br />
0,0<br />
0 200 400 600 800<br />
1,6<br />
1,2<br />
0,8<br />
0,4<br />
0,0<br />
0 200 400 600 800<br />
Cell line: 22Rv1<br />
Fig.1 Correlations of metal in medium vs. intracellular metal level (left), between metal in<br />
medium vs. MT (right)<br />
- 122 -<br />
2,4<br />
2,0<br />
1,6<br />
1,2<br />
0,8<br />
0,4<br />
60<br />
40<br />
20<br />
Metal in medium (µM)<br />
0<br />
0 100 200 300 400<br />
6<br />
4<br />
2<br />
0<br />
0 40 80 120 160<br />
40<br />
30<br />
20<br />
10<br />
Cell line: PNT1A<br />
0<br />
0 20 40 60<br />
40<br />
30<br />
20<br />
10<br />
0<br />
0 100 200 300 400<br />
30<br />
20<br />
10<br />
0<br />
0 40 80 120 160<br />
Cell line: PNT1A
XI. Workshop of Physical Chemists and Electrochemists´11 Brno<br />
relative transcript level x PNT1A<br />
rel. transcript level<br />
200%<br />
190%<br />
180%<br />
170%<br />
160%<br />
150%<br />
140%<br />
130%<br />
120%<br />
110%<br />
100%<br />
90%<br />
16000%<br />
14000%<br />
12000%<br />
10000%<br />
8000%<br />
6000%<br />
4000%<br />
2000%<br />
0%<br />
MT1A expression<br />
22Rv1 PNT1A<br />
Cell line<br />
22Rv1 Metallothionein<br />
MT1A MT2A<br />
mRNA<br />
Metallothionein/total protein (µg/mg)<br />
35<br />
30<br />
25<br />
20<br />
15<br />
10<br />
5<br />
0<br />
relative transcript level x PNT1A<br />
rel. transcript level<br />
260%<br />
250%<br />
240%<br />
230%<br />
220%<br />
210%<br />
200%<br />
190%<br />
180%<br />
170%<br />
160%<br />
150%<br />
140%<br />
130%<br />
120%<br />
110%<br />
100%<br />
90%<br />
7500%<br />
5000%<br />
2500%<br />
750%<br />
500%<br />
250%<br />
22Rv1 PNT1A<br />
Cell line<br />
MT2A expression<br />
22Rv1 PNT1A<br />
Cell line<br />
PNT1A Metallothionein<br />
MT1A MT2A<br />
mRNA<br />
Fig.2 Metallothionein mRNA level: Difference in classes (first row left), difference in cell<br />
lines (second row left), metallothionein protein level (below)<br />
7. CONCLUSION<br />
In this study we have shown different behavior of cancer and healthy prostate<br />
tissue, as demonstrated on the cell lines. We have shown, that zinc buffering significantly<br />
differs between cell lines, that metallothionein level is dependent on the zinc(II) level<br />
more significantly in healthy tissue. Furthermore, we have demonstrated a discrepancy<br />
between metallothionein RNA and protein level and, at last, we identified MT2A as a<br />
major metallothionein class in prostate tissue.<br />
8. ACKNOWLEDGEMENT<br />
The work has been supported by grants GACR 301/09/P436 and NSI0200-3<br />
- 123 -
XI. Workshop of Physical Chemists and Electrochemists´11 Brno<br />
9. REFERENCES<br />
1. Feng, P., et al., The involvement of bax in zinc-induced mitochondrial apoptogenesis in malignant<br />
prostate cells. Molecular Cancer, 2008. 7.<br />
2. Eckschlager, T., et al., Metallothioneins and Cancer. Current Protein & Peptide Science, 2009. 10(4):<br />
p. 360-375.<br />
3. Colvin, R., et al., Cytosolic zinc buffering and muffling: Their role in intracellular zinc homeostasis.<br />
Metallomics, 2010. 2(5): p. 306-317.<br />
4. Krizkova, S., et al., Metallothionein - a promising tool for cancer diagnostics. Bratislavske Lekarske<br />
Listy, 2009. 110(2): p. 93-97.<br />
5. Kambe, T., et al., Overview of mammalian zinc transporters. Cellular and Molecular Life Sciences,<br />
2004. 61(1): p. 49-68.<br />
6. Costello, L. and R. Franklin, The intermediary metabolism of the prostate: a key to understanding the<br />
pathogenesis and progression of prostate malignancy. Oncology, 2000. 59(4): p. 269-282.<br />
7. Hogstrand, C., et al., Zinc transporters and cancer: a potential role for ZIP7 as a hub for tyrosine<br />
kinase activation. Trends in Molecular Medicine, 2009. 15(3): p. 101-111.<br />
8. Golovine, K., et al., Overexpression of the Zinc Uptake Transporter hZIP1 Inhibits Nuclear Factor- B<br />
and Reduces the Malignant Potential of Prostate Cancer Cells In vitro and In vivo. Clinical Cancer<br />
Research, 2008. 14(17): p. 5376.<br />
9. Milon, B.C., et al., Ras Responsive Element Binding Protein-1 (RREB-1) Down-Regulates hZIP1<br />
Expression in Prostate Cancer Cells. Prostate, 2010. 70(3): p. 288-296.<br />
10. Costello, L. and R. Franklin, The clinical relevance of the metabolism of prostate cancer; zinc and<br />
tumor suppression: connecting the dots. Molecular Cancer, 2006. 5(1): p. 17.<br />
11. Humbert, L. and M. Chevrette, Somatic Molecular Genetics of Prostate Cancer, in Male Reproductive<br />
Cancers Epidemiology, Pathology and Genetics, W.D. Foulkes and K.A. Cooney, Editors. 2009,<br />
Springer Verlag: New York, Dordrecht, Heidelberg, London.<br />
12. DiPaola, R.S., J. Patel, and M.M. Rafi, Targeting apoptosis in prostate cancer. Hematology-Oncology<br />
Clinics of North America, 2001. 15(3): p. 509-+.<br />
13. Franklin, R. and L. Costello, The important role of the apoptotic effects of zinc in the development of<br />
cancers. Journal of cellular biochemistry, 2009. 106(5): p. 750-757.<br />
- 124 -
XI. Workshop of Physical Chemists and Electrochemists´11 Brno<br />
NEW POSSIBILITIES IN<br />
FUNCTIONALIZATION AND LABELING OF<br />
DNA FOR ELECTROCHEMICAL ANALYSIS<br />
Luděk HAVRAN 1 , Petra HORÁKOVÁ 1 , Hana PIVOŇKOVÁ 1 , Milan VRÁBEL 2 , Hana<br />
MACÍČKOVÁ-CAHOVÁ 2 , Michal HOCEK 2 , Miroslav FOJTA 1<br />
1 Institute of Biophysics ASCR v.v.i., Královopolská 135, 612 65 Brno, Czech Republic<br />
2 Institute of Organic Chemistry and Biochemistry ASCR v.v.i., Flemingovo nám. 2, 16610 Prague 6, Czech<br />
Republic<br />
Abstract<br />
A chemically modified DNA probes labelled by different electroactive tags were prepared<br />
by incorporation of modified deoxynucleoside triphosphates (dNTP) into the<br />
oligonucleotide chain by using enzymes. Modified dNTPs were synthesized by simple<br />
cross-coupling reaction in aqueous media. Electroactive modified DNA probes were used<br />
in development of electrochemical sensors for the analysis of nucleotide sequences and for<br />
DNA-protein interaction assays.<br />
1. INTRODUCTION<br />
Electrochemical analysis of DNA has been one of the most dynamically developing<br />
fields in bioanalytical electrochemistry in last two decades [1]. This progress starts mainly<br />
due to try to develop electrochemical sensors for detection of DNA hybridization,<br />
interactions, and damage. Application of signaling DNA probes (short oligonucleotide<br />
molecules) modified by some electroactive tags belong to techniques frequently used in<br />
this area. Beside “classical” methods – using modified dNTPs in solid-phase<br />
oligonucleotide synthesis or post-synthetic modification of synthetic oligonucleotide, a<br />
new approach was introduced recently [2] based on enzymatic incorporation of modified<br />
dNTPs in to oligonucleotide chain. Modified dNTPs can be synthesized by simple crosscoupling<br />
reaction in aqueous media [2]. In this contribution we demonstrate using of the<br />
above mentioned method for the preparation of a set of signaling DNA probes labeled<br />
with different electroactive tags (ferrocene [3], amino or nitro groups [4,5], complexes of<br />
Ru 2+ or Os 2+ [6] and alkylsulfanylphenyl group [7]), their incorporation into DNA and<br />
application in the development of electrochemical sensors for the analysis of nucleotide<br />
sequences and DNA protein interactions.<br />
2. EXPERIMENT<br />
Modified dNTPs were synthesized by the direct single-step aqueous-phase<br />
crosscoupling reactions of halogenated dNTPs. Based on our previous experience that 8substituted<br />
purine dNTPs are not efficiently incorporated we have chosen 7-substituted 7deaza-adenine<br />
and 7-deaza-guanine as substitute for the adenine and guanine bases.<br />
Labelled DNA signalling probes was prepared by means of primer extension (PEX)<br />
catalysed by different DNA polymerases (Klenow (exo-) DNA polymerase fragment,<br />
- 125 -
XI. Workshop oof<br />
Physical Cheemists<br />
and Electrochemists´11<br />
DyNAzymme,<br />
Vent(exxo-),<br />
Pwo - New Enggland<br />
Biolab bs (UK), PE EQLAB (SRRN),<br />
Finnz zymes<br />
(Finland)) . Results off<br />
PEX reacti ion were mmonitored<br />
by b polyacry ylamide gel electropho oresis.<br />
PEX prodducts<br />
were separated by Qiagenn<br />
Nucleotid de Remova al kit or bby<br />
streptav vidine<br />
coated maagnetic<br />
beads<br />
(Dynabeads®<br />
MM-270<br />
Strep ptavidin, Dynal D A.S. Norway). The<br />
building bblocks<br />
andd<br />
PEX pro oducts weree<br />
analysed d by mean ns of in siitu<br />
and ex x situ<br />
(adsorptivee<br />
transfer stripping) cyclic andd/or<br />
square e-wave vol ltammetry (CV, SWV V) at<br />
hanging mmercury<br />
drrop<br />
electro ode (HMDEE)<br />
or pyro olytic graphite<br />
electrrode<br />
(PGE) ). All<br />
voltammettric<br />
measurrements<br />
were w performmed<br />
at am mbient temp perature ussing<br />
an Au utolab<br />
analyzer (EEcoChemiee,<br />
The Neth herlands) inn<br />
a three-ele ectrode set-up.<br />
3. RESSULTS<br />
ANND<br />
DISCU USSION<br />
By crosscouplinng<br />
reactions<br />
were synnthetized<br />
dN<br />
or alkylsullfanylphenyyl<br />
groups, and a compleexes<br />
of Ru2+ NTPs bearing<br />
ferrocenne,<br />
amino, nitro<br />
+ or Os2+ (Fig g.1)<br />
Fig.1. Struuctures<br />
of ddNTPs<br />
mod<br />
(B) , [Ru(bipy) 3] 2+ dified by: fe ferrocenylet thynyl group<br />
(A), nittrophenyl<br />
group g<br />
(C), and d benzylsullfanyl<br />
group p (D).<br />
Electtrochemicaal<br />
behaviou ur of thesee<br />
dNTPs was w studied d at mercuury<br />
and ca arbon<br />
electrodes by differeent<br />
voltam mmetric meethods.<br />
Con nstant curr rent chronoopotentiom<br />
metric<br />
stripping was used in case of f dNTPs annd<br />
PEX products<br />
be earing alkyylsulfanylph<br />
henyl<br />
groups. Laabelled<br />
dNTTPs<br />
were in ncorporatedd<br />
in to DN NA by PEX reaction. PProducts<br />
of f PEX<br />
reaction wwas<br />
electrocchemically<br />
analysed ssame<br />
way as a dNTPs. Some S modiified<br />
dNTPs s was<br />
used for ellectrochemmical<br />
analysis<br />
of nucleootide<br />
seque ence or for study of DNNA<br />
interac ctions<br />
with proteeins<br />
(Fig.2). .<br />
- 126 -<br />
Brno
XI. Woorkshop<br />
of Physsical<br />
Chemists and a Electrochemmists´11<br />
Fig. 22.<br />
Electrochhemical<br />
“m multicolour” ” labelling of o DNA usi ing dNTPs modified by b differentt<br />
electroacctive<br />
tags.<br />
4. CONCLUUSION<br />
DNA proobes<br />
labele ed by elecctroactive<br />
tags t were prepared by incorp poration off<br />
diffeerent<br />
chemiically<br />
modi ified dNTP.<br />
These pro obes were used u for eleectrochemic<br />
cal analysiss<br />
of DDNA<br />
sequeences<br />
(inclu uding anallysis<br />
of sin ngle nucle eotide polyymorphisms)<br />
and forr<br />
monnitoring<br />
of DDNA<br />
– prot tein interacctions.<br />
5. ACKNOWWLEDGEM<br />
MENT<br />
The workk<br />
was suppo orted by Grrant<br />
Agency<br />
of the Ac cademy of SSciences<br />
of f the Czechh<br />
Repuublic<br />
(IAA 400040903 3), MEYS CR (LC060 035) and th he Academmy<br />
of Scien nces of thee<br />
Czecch<br />
Republicc<br />
(AV0Z500 040507, AVV0Z5004070<br />
02).<br />
6.<br />
[1]<br />
[2]<br />
[3]<br />
[4]<br />
[5]<br />
[6]<br />
[7]<br />
REFERENNCES<br />
Paleček, E.: Electroanaly ysis, 21 (20099),<br />
239<br />
Hocek, M., Fojta, M.: Or rg. Biomol. CChem.,<br />
6 (2008 8), 2233<br />
Brázdilová, P., Vrábel, M., M Pohl, R., PPivoňková,<br />
H.,<br />
Havran, L., Hocek, M., FFojta,<br />
M.: Che em. Eur. J. 133<br />
(2007), 95277<br />
Cahová, H., , Havran, L., Brázdilová, PP.,<br />
Pivoňková á, H., Pohl, R.,<br />
Fojta, M., HHocek,<br />
M.: An ngew. Chem. .<br />
Int. Ed. 47 ( (2008), 2059<br />
Horáková, PP.,<br />
Macíčkov vá-Cahová, HH.,<br />
Pivoňková á, H., Špaček, , J., Havran, L., Hocek, M., M Fojta, M.: :<br />
Org. Biomool.<br />
Chem. 9 (2011),<br />
1366<br />
Vrábel, M., Horáková, P., P Pivoňkováá,<br />
H., Kalacho ová, L., Černo ocká, H., Cahhová,<br />
H., Poh hl, R., Šebest, ,<br />
P., Havran, L., Hocek, M., M Fojta, M.: CChem.<br />
Eur. J. 15 (2009), 11 144<br />
Macíčková--Cahová,<br />
H., Pohl, R., Hooráková,<br />
P., Havran, H L., Šp paček, J., Fojtta,<br />
M., Hocek k, M.: Chem. .<br />
Eur. J. 2011 in press<br />
- 127 -<br />
Brnoo
XI. Workshop of Physical Chemists and Electrochemists´11 Brno<br />
REVIEW OF ELECTROREDUCTION OF<br />
HYDROGEN IONS ON MERCURY<br />
Michael HEYROVSKÝ 1<br />
1 J.Heyrovský Institute of Physical Chemistry, Academy of Sciences of Czech Rep.,v.v.i., Dolejškova 3, 182 23<br />
Prague 8<br />
Electroreduction of hydrogen ions occurs on mercury with highest overpotential of<br />
all metals. This has the advantage in electroanalysis that mercury electrodes provide the<br />
widest potential range for reduction processes. The high hydrogen overpotential gives<br />
also the possibility to catalyze hydrogen evolution by a variety of chemical entities - they<br />
can be ions of rare metals, cobalt complexes containing sulphur, some nanoparticles,<br />
peptides, proteins, nucleic acids, polysaccharides. The hydrogen evolution catalysis has<br />
been utilized in polarography and in voltammetry, however, the most sensitive reactions<br />
of hydrogen catalysis can be achieved in chronopotentiometry, where during fast change<br />
of electrode potential can become catalytically active even short interactions between the<br />
catalyst and the electrode.<br />
- 128 -
XI. Workshop of Physical Chemists and Electrochemists´11 Brno<br />
QUANTUM DOTS WITH FUNCTIONALIZED<br />
SHELL LAYERS FOR ENHANCED<br />
BIOCONJUGATION AND<br />
FLUOROIMMUNOASSAYS<br />
Antonín HLAVÁČEK 1 , Petr SKLÁDAL 1<br />
1 Masaryk University, Faculty of Science, Department of Biochemistry, Kotlářská 2, 611 37 Brno<br />
Abstract<br />
Quantum dots (QD) are widely proposed as useful fluorescent labels with potential to rival<br />
classic organic fluorophores. Their optical properties ensure low background what is<br />
desired in variety of immunochemical assays. Here, the application of highly stable<br />
biotinylated QD conjugates prepared at our laboratory is presented. The preparation of<br />
QDs was optimized with aim to reach storage stability (two months in buffer without any<br />
decay of signal) and high signal/noise ratio when used in fluorescent bioaffinity assays.<br />
Such optimized QDs were successfully applied in the competitive flouroimmunoassay of<br />
human serum albumin in urine samples. Characteristics of this assay (LOD 1.9 μg/ml,<br />
working range from 2.8 to 10.4 μg/ml) are relevant to clinically important limits for<br />
microalbuminuria.<br />
1. INTRODUCTION<br />
Fluorescent semiconductor nanocrystals known as quantum dots (QD) used as labels<br />
in various bioconjugates belong to the most highlighted applications of nanotechnology in<br />
bioanalytical chemistry [1,2]. QDs exhibit size-tuneable photoluminescence properties,<br />
broader excitation spectra and narrower emission bandwidth in comparison with the<br />
classic organic fluorophores [3]. Such properties provide significantly higher signal/noise<br />
ratio in the fluorescent techniques. In bioanalytical chemistry, QDs were used for<br />
multiplexed fluoroimmunoassays (FIA) [4,5] enabling sensitive detection of specific<br />
oligonucleotides and proteins using fluorescently encoded microbeads [6]. The<br />
dependence of QDs fluorescence intensity in aqueous solutions on metal ion<br />
concentration was used for their determination [7]. Electrochemiluminescent properties<br />
of QDs were used for construction of novel sensors for determination of proteins [8], DNA<br />
[9], cells [10], ascorbic acid and others analytes [11]. Here, biotinylated QDs were used for<br />
competitive fluoroimmunoassays of human serum albumin in urine samples.<br />
2. EXPERIMENT<br />
Competitive FIA utilizing fluorescent biotin-QD conjugate was developed. The 384<br />
well microplates were coated with HSA (80 μl per well, 0.3 mg/ml HSA in Pi, incubated<br />
overnight at refrigerator). The sodium phosphate buffer with 0.05 % Tween-20 (Pi, 50<br />
mM phosphate, pH 7.4) was used for washing of the plates which were stored in a<br />
desiccator at cold. The mixtures of biotinylated antibody and either HSA standard or<br />
- 129 -
XI. Workshop of Physical Chemists and Electrochemists´11 Brno<br />
diluted urine samples in PBS were prepared and incubated for 15 min at laboratory<br />
temperature. Next, 20 μl of the resulting solution were added to the microplate wells,<br />
incubated for 40 min at laboratory temperature and the plates were washed with<br />
Pi/Tween. The microplate wells were filled with 20 μl of avidin solution (40 μg/ml in Pi),<br />
incubated for 25 min and washed. Biotinylated QDs were added (20 μl, 5 nM in Pi) and<br />
incubated for 25 min. Finally, fluorescence of the washed and dried wells was measured<br />
by Synergy 2 (excitation / emission at 360 / 620 nm, respectively).<br />
3. RESULTS AND DISCUSSION<br />
The calibration curve (Fig. 1) was generated using repeated assays of five<br />
concentrations of the HSA standard (1.6, 4, 8, 20 and 100 μg/ml in Pi) which are around<br />
the threshold value of 20 μg/ml HSA in urine indicating the clinical complications. The<br />
concentrations of HSA in the analyzed urine samples were determined using this<br />
calibration curve, significant matrix effects were not observed. However, the background<br />
level (fluorescence around 970) was significantly higher than zero; it was due to the nonspecific<br />
binding of the reagents during the assay.<br />
The concentrations of HSA in samples were compared with the values estimated by<br />
the common clinical procedure – the automatic turbidimetric analyser COBAS Integra<br />
800 (Fig. 2). Parameters of the developed method were: LOD 1.9 μg/ml (corresponding to<br />
90% fluorescence), IC50 5.5 μg/ml (corresponding to 50% fluorescence) and working range<br />
from 2.8 to 10.4 μg/ml (corresponding to 80% - 20% fluorescence). The total time of<br />
analysis was 120 min, which is not that much critical due to the parallel processing of<br />
samples in the microplates.<br />
The proposed assay of HSA using QD as labels seems useful for clinical application<br />
although further assay optimisation is required mainly to lower background fluorescence<br />
and to increase precision. Nephropathy becomes developed in 45% of the patients with<br />
insulin dependent diabetes mellitus and the onset of this disease is accompanied with<br />
slightly increased level of albumin in urine known as microalbuminuria. The<br />
concentration range typical for microalbuminuria is from 20 to 200 μg/ml in the 24-h<br />
specimens. In this respect, the reported analytical parameters of the presented FIA are<br />
sufficient to discriminate positive microalbuminuria samples.<br />
- 130 -
XI. Woorkshop<br />
of Physsical<br />
Chemists and a Electrochemmists´11<br />
Fig.11<br />
Calibratioon<br />
curve of f the develooped<br />
fluore escence imm munoassay utilizing biotinylated<br />
b d<br />
QD. Parrameters<br />
of f the approoximating<br />
si igmoidal eq quation aree<br />
indicated d inside thee<br />
graph.<br />
Fig.22<br />
Correlatioon<br />
of the lev vels of HSAA<br />
in urine samples s det termined ussing<br />
the pro oposed FIAA<br />
method and the standard iimmunotur<br />
rbidimetric c assay (CCOBAS<br />
Int tegra 800). .<br />
Parametters<br />
of the linear<br />
regreession<br />
fit are e given insi ide the grapph.<br />
4. CONCLUUSION<br />
Biotinylatted<br />
QDs were w successsfully<br />
used d for fluore escence immmunoassay<br />
of humann<br />
serumm<br />
albumin in urine sa amples. Parrameters<br />
of f the fluore escence immmunoassay<br />
(LOD 1.966<br />
μg/mml<br />
and workking<br />
range 2.86-10.4 μμg/ml)<br />
are sufficient s fo or detectionn<br />
of slightly y increasedd<br />
levells<br />
of HSA inn<br />
urine (mi icroalbumiinuria).<br />
The e biotinylat ted quantumm<br />
dots are consideredd<br />
to bee<br />
generally applicable for fluoresccence<br />
affinity<br />
assays.<br />
- 131 -<br />
Brnoo
XI. Workshop of Physical Chemists and Electrochemists´11 Brno<br />
5. ACKNOWLEDGEMENT<br />
The work has been supported by the ESF OPVK grant CZ.1.07/2.3.00/09.0167<br />
"Nanobiotechnologies and biosensors for biointeraction studies" and by the Ministry of<br />
Education project no. LC06030 "Biomolecular centre".<br />
6. REFERENCES<br />
[1] Katz, E., Willner, I.: Angew. Chem. Int. Ed., 43 (2004), 45, 6042<br />
[2] Michalet, X., Pinaud, F.F., Bentolila, L.A., Tsay, J.M., Doose, S., Li, J.J., Sundaresan, G., Wu, A.M.,<br />
Gambhir, S.S., Weiss, S.: Science, 307 (2005), 5709, 538<br />
[3] Resch-Genger, U., Grabolle, M., Cavaliere-Jaricot, S. Nitschke, R., Nann, T.: Nat. Methods, 5 (2008),<br />
9, 763<br />
[4] Goldman, E.R., Clapp, A.R., Anderson, G.P., Uyeda, H.T., Mauro, J.M., Medintz, I.L., Mattoussi, H.:<br />
Anal. Chem., 76 (2004), 3, 684<br />
[5] Peng, C., Li, Z., Zhu, Y., Chen, W., Yuan, Y., Liu, L., Li, Q., Xu, D., Qiao, R., Wang, L., Zhu, S., Jin,<br />
Z., Xu, C.: Biosens. Bioelectron., 24 (2009), 12, 3657<br />
[6] Ma, Q., Wang, X., Li, Y., Shi, Y., Su, X.: Talanta, 72 (2007), 4, 1446<br />
[7] Xia, Y.S., Zhu, C.Q.: Talanta, 75 (2008), 1, 215<br />
[8] Wang, G.L., Xu, J.J., Chen, H.Y., Fu, S.Z.: Biosens. Bioelectron., 25 (2009), 4, 791<br />
[9] Willner, I., Patolsky, F., Wasserman, J.: Angew. Chem. Int. Ed., 40 (2001), 10, 1861<br />
[10] Qian, Z., Bai, H.J., Wang, G.L., Xu, J.J., Chen, H.Y.: Biosens. Bioelectron., 25 (2010), 9, 2045<br />
[11] Chen, H., Li, R., Lin, L., Guo, G., Lin, J.M.: Talanta, 81 (2010), 4, 1688<br />
- 132 -
XI. Workshop of Physical Chemists and Electrochemists´11 Brno<br />
USING OF TEMPLATES BASE METHOD FOR<br />
FARICATION OF NANORODS STRUCTURES<br />
FOR ELECTROCHEMICALSENZING<br />
ELEMENTS<br />
Radim HRDÝ 1 , Marina VOROZHTSOVÁ 1 , Jana DRBOHLAVOVÁ 1 , Jana CHOMOUCKÁ 1 ,<br />
Jan PRÁŠEK 1 , Petra BUSINOVÁ 1 , Jaromír HUBÁLEK 1<br />
1 Brno University of Technology, Faculty of Electrical Engineering and Communication, Department of<br />
Microelectronics, Technicka 3058/10, 616 00 Brno, Czech Republic<br />
Abstract<br />
The porous alumina attracts attention because of its self-ordered hexagonal structure. It<br />
can be used as a template nanosize structure, for many devices such as magnetic,<br />
electronic and optoelectronic. The aim of this method is preparation of the mask for<br />
electrodepositing nanowires directly on Si substrate. The presented technique without<br />
utilization of high-resolution electron-beam lithographs belongs to low-cost technology<br />
in the microelectronic industry. Anodic alumina has been prepared in several electrolytes<br />
by the anodization process and the characteristics of pore structures have been studied in<br />
different anodizing conditions. The thickness of aluminum film for anodization was 1-2<br />
um. The two methods for deposition of aluminum thin film on Si substrate are thermal<br />
evaporating and sputtering. The prepared alumina structures have 15-30 nm pore<br />
diameters and 30-110 nm interpore distances.<br />
1. INTRODUCTION<br />
Many techniques have existed for preparing nanostructures. Lithographic methods<br />
have the best chance under the control of formation and sizes of single samples of<br />
nanostructures, but they are not low cost technologies. A cheaper technique exists for the<br />
deposition of ordered hexagonal nanostructures; aluminum can be transformed to selfordered<br />
alumina pore structure by special conditions [1-3]. These qualities of aluminum<br />
are of interest to many scientists. The purpose of this method is creating a template for<br />
electro deposition nanowires directly on n-type Si substrate. Semiconductor,<br />
optoelectronic and sensor devices use this template without using thick aluminum sheet.<br />
We used 1-2 μm thin films of aluminum for the fabrication of the template. The purpose<br />
of this method is anodic oxidation of aluminum film which is anode [4]. Cathode is<br />
graphite electrode. Diffusion of ions of oxygen and aluminum through the alumina layer<br />
is controlled by an electric field. The speed of growth of alumina film is exponential to the<br />
relationship of the electric field intensity. Al3+ ions have moved through the oxide barrier<br />
and they have increased the thickness of the barrier. The array of hexagonal ordered pores<br />
is the result of this method. This technique is not a simple process. The first problem is<br />
deposition of homogenous aluminum film on Si substrate. We used two methods:<br />
sputtering and evaporating. Both methods have advantages and disadvantages [5].<br />
- 133 -
XI. Workshop oof<br />
Physical Cheemists<br />
and Electrochemists´11<br />
Evaporatedd<br />
aluminuum<br />
film is homogenoous<br />
but it has bad adhesion. In compar rison,<br />
sputtered film has saatisfactory<br />
adhesion a buut<br />
sputterin ng has crea ated nanocrrystal<br />
struc ctures<br />
during depposition.<br />
Thhey<br />
avoid fabricating f a self-order red pore str ructure. A ffilm<br />
prepar red in<br />
this way should bee<br />
annealed in vacuuum.<br />
Theref fore, evapo orating hass<br />
been use ed in<br />
preferencee<br />
to sputtering<br />
and 100<br />
nm thiin<br />
Au film is used as s an intermmetalic<br />
laye er for<br />
improvingg<br />
adhesion.<br />
The seco ond probleem<br />
was fin nding cond ditions for r fabricatin ng an<br />
ordered poore<br />
templatte.<br />
Next op peration consists<br />
of fil lling the po ores with mmetal<br />
by el lectro<br />
depositionn<br />
method, in order to fabricatted<br />
nanow wires or na anotubes. TThin<br />
film gold<br />
electrodes with alummina<br />
templa ate are appplied<br />
like base b for dep posited nannoparticles.<br />
The<br />
fabricationn<br />
of nanommachining<br />
surface s deppends<br />
on va arious param meters likee<br />
temperatu ure of<br />
solution, ppH<br />
and currrent<br />
densit ty. Last opeeration<br />
is dissolving d the<br />
aluminaa<br />
template. As a<br />
result we obtained mmetal<br />
nano owires on ccomb<br />
electr rodes whic ch are objeect<br />
of addit tional<br />
research.<br />
Fig.1 Model<br />
of preparring<br />
ordere ed alumina template.<br />
2. EXPPERIMENTT<br />
To bbegin<br />
withh,<br />
high pur rity (99,99<br />
substrate iin<br />
vacuum.<br />
The alum minum film<br />
was degreeased<br />
in aceetone<br />
and cleaned in<br />
10 wt % ssulfuric<br />
aciid<br />
at 10 °C C temperat<br />
potenciosttatic<br />
mode. . The volta age was 22<br />
current vaalue<br />
decreaased<br />
by les ss than 1 m<br />
sample weere<br />
signalized<br />
by the depletion d of<br />
prepared ppores<br />
were opened an nd increased<br />
was 10 - 115<br />
nm andd<br />
the interpore<br />
dista<br />
applicationn<br />
of the oppened<br />
alum mina, the t<br />
nanowiress.<br />
The mettal<br />
used fo or experim<br />
(componennt<br />
of electrrolyte:<br />
6 g.L<br />
density off<br />
depositionn<br />
over the<br />
nanostructtures<br />
and tthe<br />
depositi<br />
was approox.<br />
50 °C. Inn<br />
the next<br />
Results it iis<br />
seen on FFig.2.<br />
.<br />
-1 99%) alumi inum was evaporated<br />
m was 2 μm m. Subseque ently, the a<br />
n deionized d-water. Th he sample w<br />
ture. Porou us alumina a film was<br />
2 V and cu urrent 5 mA. m After 3<br />
mA. This decline d and d change o<br />
f all alumin num for for rmation por<br />
d in 5% H3 3PO4 solutio on. The res<br />
ance was 30 – 50 nm.<br />
Concer<br />
template was w used fo or the elect<br />
ments on the t nanostr ructure gro<br />
of K[AAu(CN)2]<br />
an nd 2.32 g.L L<br />
total area of nanopores<br />
was usu<br />
ion time wwas<br />
10 secon nds. The te<br />
phase, thee<br />
filled tem mplate was<br />
-1 d on n-typ<br />
aluminum<br />
was placed<br />
s conducte<br />
35 minutes<br />
of colour o<br />
re alumina<br />
sulting diam<br />
rning, the<br />
trodepositio<br />
rowth was<br />
of H3BOO3).<br />
The cu<br />
ually 0.25 mA.cm<br />
emperature<br />
dissolved in<br />
2 pe Si<br />
layer<br />
d into<br />
ed in<br />
s, the<br />
of the<br />
a. The<br />
meter<br />
next<br />
on of<br />
gold<br />
urrent<br />
fo or Au<br />
e of plating bath<br />
n 5% H3PO O4 [6]<br />
- 134 -<br />
Brno
XI. Woorkshop<br />
of Physsical<br />
Chemists and a Electrochemmists´11<br />
Fig.22<br />
SEM imagges<br />
of fabri icated gold nanowires s, on the left/<br />
nanowirres<br />
which are a hold inn<br />
the alummina<br />
porous s templates,<br />
right / cro oss section of o nanowire res structure e.<br />
3. RESULTS<br />
AND DISCUSSIO<br />
D ON<br />
Several saamples<br />
of thin t aluminnum<br />
were prepared in i differentt<br />
condition ns but onlyy<br />
somee<br />
of them aare<br />
suitable e for fabricaation<br />
of na ano templat tes. It is neecessary<br />
to use a highh<br />
hommogenous<br />
suubstrate.<br />
Th he sputterinng<br />
method ds are not acceptable a for the deposition<br />
off<br />
thin aluminum films beca ause they crreate<br />
nanoc crystals in the aluminnum<br />
layer. The size off<br />
the nnanocrystalls<br />
grows wi ith time. Thhe<br />
layer thickness<br />
1-2 2 μm is mouulded<br />
by much m biggerr<br />
crysttals<br />
than inn<br />
thin layer r 100 nm. MMany<br />
defec cts can be found f betwween<br />
nanocrystals.<br />
Onn<br />
the ggrain<br />
bounndary,<br />
the current deensity<br />
prev vails to cur rrent densiity<br />
in nano ocrystal byy<br />
anoddization<br />
proocess<br />
and it i avoids crreating<br />
ord dered pore structures. . The solut tion of thee<br />
issuee<br />
is in usinng<br />
of CVD. . The alumminum<br />
laye er which was w depositeed<br />
by sput ttering wass<br />
turbiid.<br />
On the other hand,<br />
the aluuminum<br />
films<br />
which h have been<br />
prepare ed by thee<br />
evapporating<br />
tecchnique<br />
are a brilliant polish. 2 μm<br />
film is pr repared by overlaying g of a singlee<br />
layerr.<br />
Thereforre<br />
the nan nocrystals ddo<br />
not gro ow continu ually as theey<br />
do by sputtering. .<br />
Bordders<br />
betweeen<br />
nanocry ystals are evvident<br />
but they t do no ot affect thee<br />
anodizatio on process. .<br />
The pore structture<br />
is regu ular withouut<br />
defects. This T anodized<br />
aluminaa<br />
is useful for f using ass<br />
a maask<br />
for depoosition<br />
orde ered nanowwires<br />
or for etching tec chniques. TThe<br />
lack of adhesion iss<br />
onlyy<br />
one problem<br />
caused d by evapoorating.<br />
Th he layers have h usuallly<br />
been cr racked andd<br />
severred<br />
by anoodization.<br />
The T solutioon<br />
of the is ssue is usin ng an interrmetalic<br />
Au u layer andd<br />
prehheating<br />
of thhe<br />
substrate e. The widtth<br />
and the density of created c nannostructure<br />
es are givenn<br />
by thhe<br />
templatee.<br />
The length<br />
of nanosstructures<br />
depends d on n the amounnt<br />
of depos sited metal, ,<br />
thus the requirred<br />
length of o nanostruuctures<br />
can be achieve ed if the cuurrent<br />
dens sity (with a<br />
certaain<br />
limitattion<br />
of the<br />
diffusionn,<br />
electron n transfer, electrical potential, , chemicall<br />
potenntial,<br />
the pprocessing<br />
temperaturre<br />
which can c influen nce the moobility<br />
of io ons, crystall<br />
growwth,<br />
etc.) aand<br />
the tim me of electrrodepositio<br />
on are adeq quate. Metaal<br />
nanostru uctures aree<br />
fabriicated<br />
by ellectrodepos<br />
sition of thhe<br />
required metal into o the nanoppores<br />
of the e template. .<br />
Metaal<br />
ions are attracted to o the cathoode<br />
(conduc ctive substr rate of the template) leaving l thee<br />
insullant<br />
aluminna<br />
template e.<br />
- 135 -<br />
Brnoo
XI. Workshop of Physical Chemists and Electrochemists´11 Brno<br />
4. CONCLUSION<br />
The aim of this work is to find the conditions of the anodization process. The<br />
optimal conditions for anodization processes have been determined. The self-organized<br />
process of thin films is dependent on high purity and the homogenity of aluminum film.<br />
5. ACKNOWLEDGEMENT<br />
This research has been supported by Grant Agency of the Czech Republic under the<br />
contract GA 102/08/1546 and Grant Agency of the Czech Academy of Science, Czech<br />
Republic under the contract KAN 208130801.<br />
6. REFERENCES<br />
[1] Li X, Chin E, Sun H, Kurup P, Gu Z:. Sens Actuators, B 2010, 148:404-412.<br />
[2] Klosova K, Hubalek J: Phys Status Solidi A-Appl Mat 2008, 205:1435-1438<br />
[1] Mozalev A, Smith AJ, Borodin S, Plihauka A, Hassel AW, Sakairi M, Takahashi H: Electrochim Acta<br />
2009, 54:935-945.<br />
[4] Rabin O, Herz PR, Lin YM, Akinwande AI, Cronin SB, Dresselhaus MS: Adv Funct Mater 2003,<br />
13:631-638.<br />
[5] Hubalek J, Hrdy R, Vorozhtsova M: In Proceedings of the Eurosensors XXIII Conference. Volume 1.<br />
Edited by Brugger J, Briand D. Amsterdam: Elsevier Science Bv; 2009: 36-39: Procedia Chemistry<br />
[6] Hrdy R, Vorozhtsova M, Drbohlavova J, Prasek J, Hubalek J: Electrochemical transducer utilizing<br />
nanowires surface. In.; 2010: 510-514<br />
- 136 -
XI. Workshop of Physical Chemists and Electrochemists´11 Brno<br />
TRENDS IN CHEMICAL SENSORS<br />
Jaromír HUBÁLEK 1<br />
1 Laboratory of Microsensors and Nanotechnologies, Brno University of Technology, Technická 10, 616 00<br />
Brno<br />
Abstract<br />
Principals of chemical sensors have been widely developed during last two decades.<br />
Technology advancing brought many materials and structures involved into transducer<br />
which is the most important part of chemical sensors. The chemical sensing based on<br />
these materials where chemical reaction is transformed to physical quantity is most<br />
widespread and it can be called the first generation of chemical tranducers. As the second<br />
generation the optical principles can be called. In this case chemical properties are<br />
observed using light and the transducer contain light generator and detector as physical<br />
part of optical transducers.<br />
1. INTRODUCTION<br />
Chemical sensors are becoming more and more important in any area where the<br />
measurement of concentrations of volatile compounds is relevant for both control and<br />
analytical purposes. They have also found many applications in sensor systems called<br />
electronic noses and tongues. This chapter will first consider fundamentals of sensor<br />
science including a brief discussion on the main terms encountered in practical<br />
applications, such as: sensor, transducer, response curve, differential sensitivity, noise,<br />
resolution and drift. Basic electronic circuits employed in the sensor area will be discussed<br />
with a particular emphasis on the noise aspects, which are important for achieving high<br />
resolution values in those contexts where measurement of the lowest concentration values<br />
of chemicals is the main objective. All the most relevant transducers such as: MOSFET,<br />
CMOS, Surface Plasmon Resonance device, Optical Fibre, ISFET, will be covered in some<br />
detail including their intrinsic operating mechanisms and showing their limitation and<br />
performance. Shrinking effects of these transducers will also be commented on. The<br />
electronic nose and electronic tongue will be described as systems able to give olfactory<br />
and chemical images, respectively, in a variety of applications fields, including medicine,<br />
environment, food and agriculture. [1]<br />
Electronic nose’ systems involve various types of electronic chemical gas sensors<br />
with partial specificity, as well as suitable statistical methods enabling the recognition of<br />
complex odours. As commercial instruments have become available, a substantial increase<br />
in research into the application of electronic noses in the evaluation of volatile<br />
compounds in food, cosmetic and other items of everyday life is observed. At present, the<br />
commercial gas sensor technologies comprise metal oxide semiconductors, metal oxide<br />
semiconductor field effect transistors, organic conducting polymers, and piezoelectric<br />
crystal sensors. Further sensors based on fibreoptic, electrochemical and bi-metal<br />
principles are still in the developmental stage. Statistical analysis techniques range from<br />
simple graphical evaluation to multivariate analysis such as artificial neural network and<br />
- 137 -
XI. Workshop oof<br />
Physical Cheemists<br />
and Electrochemists´11<br />
radial bassis<br />
functionn.<br />
The int troduction of electronic<br />
noses into the aarea<br />
of food<br />
is<br />
envisaged for qualiity<br />
contro ol, process monitorin ng, freshn ness evaluaation,<br />
shel lf-life<br />
investigatiion<br />
and autthenticity<br />
assessment. a Considerab ble work ha as already bbeen<br />
carrie ed out<br />
on meat, ggrains,<br />
coffe fee, mushro ooms, cheesse,<br />
sugar, fi ish, beer an nd other beeverages,<br />
as s well<br />
as on the oodour<br />
qualiity<br />
evaluation<br />
of food packaging material. [2 2]<br />
The most relevvant<br />
contri ibutions inn<br />
the field of fiber-op ptic chemiical<br />
sensors s and<br />
biosensorss<br />
in the lastt<br />
five years s are reviewwed.<br />
Gas optodes o (inc cluding oxyygen,<br />
hydrogen,<br />
carbon diooxide<br />
and aammonia),<br />
humidity h seensors,<br />
mon nitors for pH, p cations and anions s, and<br />
sensors forr<br />
organic ccompounds<br />
constitutee<br />
the differe ent section ns. Optical fiber biose ensors<br />
based on eenzymes,<br />
anntibodies,<br />
nucleic n acidds<br />
and who ole microor rganisms seerve<br />
to illus strate<br />
the state-of-the-art<br />
in this active areea.<br />
Selecte ed examples<br />
of abbsorbance-b<br />
based,<br />
luminescent,<br />
evanesscent<br />
wave e, Fabry-Perot,<br />
chem miluminesce ent and suurface<br />
plasmon<br />
resonance-based<br />
senssors<br />
and biosensors,<br />
aamong<br />
othe er techniques<br />
used forr<br />
interrogat te the<br />
sensitive ppart<br />
of the ddevices<br />
are methods using<br />
in analysis.<br />
[3]<br />
The main typess<br />
of modern n multisenssor<br />
systems s of the elec ctronic tonggue<br />
type as s well<br />
as the sennsitive<br />
materials<br />
and sensors (trransducers)<br />
) are also commonly c used analy ytical<br />
applicationns<br />
as recognnition<br />
and classificatioon<br />
of variou us liquid media, m quanttitative<br />
ana alysis,<br />
process moonitoring<br />
and<br />
taste ass sessment off<br />
foodstuffs.<br />
[4]<br />
2. PRINNCIPAL<br />
MMETHODS<br />
S<br />
Princciples<br />
utilizzed<br />
for che emical sensoors<br />
are resi istive transd ducers - MOOS<br />
(metal oxide<br />
semiconduuctor),<br />
and CP (Condu ucting Polyymers),<br />
grav vimetric transducers<br />
– SAW (Su urface<br />
Acoustic WWave)<br />
and BAW (Bulk<br />
Acoustic Wave), it is the same e as QCM ( Quartz Cou upled<br />
Microbalances),<br />
semiiconductor<br />
transducerr<br />
– MOSFE ET (Metal Oxide O Semiiconductor<br />
Field<br />
Effect Traansistor)<br />
seee<br />
Fig.1. Ele ectrochemiical<br />
transdu ucer – usin ng electrodees<br />
with sol lid or<br />
liquid eleectrolytes<br />
and stand dards metthods<br />
as potentiom metric, volttammetric<br />
and<br />
amperomeetric.<br />
Last pprincipals<br />
use u optical transducers<br />
(Fig.2) - hollow h wavveguides<br />
HWGs H<br />
(hollow wwaveguidess),<br />
SPR (Surface ( PPlasmon<br />
Resonance) R see Fig.33,<br />
fluoresc cence<br />
transducerrs<br />
– optical transducer r with chemmiluminisce<br />
ent layer, quantum q doots,<br />
fluoresc ceins,<br />
etc.<br />
Resitivve<br />
QCM ( (BAW)<br />
Fig.1 Princcipal<br />
transdducers<br />
using g sensing mmaterials<br />
- 138 -<br />
SAW<br />
Brno<br />
FET<br />
F
XI. Woorkshop<br />
of Physsical<br />
Chemists and a Electrochemmists´11<br />
Fig.33<br />
Sensing paart<br />
of optical<br />
transduccer<br />
using SP PR method<br />
3. CONCLUUSION<br />
The trendds<br />
are going g to advancce<br />
today kn nown princ ciples usingg<br />
new mate erials to bee<br />
miniiaturized<br />
innto<br />
very small<br />
chemicaal<br />
analyzers s of very wide<br />
spectruum<br />
of specie es.<br />
5.<br />
[1]<br />
[2]<br />
[3]<br />
[4]<br />
REFERENNCES<br />
Figg.<br />
2 Optical<br />
transduce er<br />
4. ACKNOWWLEDGEM<br />
MENT<br />
The workk<br />
has been supported by project t GACR 10 02/08/1546 (NANIME EL) and thee<br />
framme<br />
of researcch<br />
plan MS SM 00216300503.<br />
Orsini A., DD´Amico<br />
A., Conference AAdvances<br />
in sensing s with security Appplications,<br />
July y 2005, Italy, ,<br />
1-26<br />
Schaller E., et al.: Lebens sm.-Wiss. u.- Technol., 31 (1998), 305–3 316<br />
Current Annalytical<br />
Chem mistry, Vol. 4 (2008), 273-2 295<br />
Yuri G Vlassov<br />
et al 2006 Russ. Chem. . Rev. 75 (200 06), 1-125<br />
- 139 -<br />
Brnoo
XI. Workshop of Physical Chemists and Electrochemists´11 Brno<br />
NANOTECHNOLOGY FOR SENSORS AND<br />
DIAGNOSIS<br />
Jaromír HUBÁLEK 1 , René KIZEK 2<br />
1 Laboratory of Microsensors and Nanotechnologies, Brno University of Technology, Technická 10, 616 00<br />
Brno<br />
2 Laboratory of Metalomics and Nanotechnoogies, Mendel University in Brno, Zemědělská 1, 613 00 Brno<br />
Abstract<br />
Nanotechnologies are going to spread in many disciplines including sensors and devices<br />
for diagnosis in medicine because of promising properties advancing of small integrated<br />
devices. Usually increasing sensitivity and specificity is expected. Also level of integration<br />
can be increased, it means the smaller and smaller devices can be prepared for common<br />
use not only in specialized laboratories. Different nanomaterials are nowadays used as<br />
nanopillars, nanowires and nanotubes mostly prepared template based method on<br />
substrates, and colloidal nanoparticles for in vitro or in-vivo applications in analysis.<br />
Nanopillars or nanotubes are usually used in nanostructuring of sensing part of chemical<br />
sensors. Quantum dots or magnetic nanoparticles are used for bio-probe employing as<br />
separation tool or imaging tool in DNA, RNA or another desired biological material<br />
analysis.<br />
1. INTRODUCTION<br />
Large scale of nanoparticles can be used for detection of important molecules<br />
including quantum dots, magnetic beads, carbon nanotubes or metal nanostructures such<br />
as nanorods, nanowires and nanotubes formed on various solid supports (electrodes).<br />
These nanostructures are particularly convenient for bio/chemosensing purposes because<br />
the sensors show significantly higher sensitivity due to increasing of active sensing surface<br />
and in addition often modified/functionalized for desired purpose. The most important<br />
advantage of this techniques of nanostructures is its low cost [1]. Carbon nanotubes<br />
(CNTs) belong to the most promising nano-materials, because they show unique<br />
electronic, mechanical and chemical properties [2] that lead to many applications.<br />
The magnetic nanoparticles can be conjugated further with biologically active<br />
compounds in order to use them in controlled drug delivery, as agents in magnetic<br />
resonance imaging as well as for magnetic-induced tumour treatment via hyperthermia.<br />
Namely, streptavidin protein is one of the functionalization agent which can be attached<br />
to magnetic nanoparticle surface for its special affinity to vitamin biotin and hence for<br />
detection of diverse biomolecules in immunoassays and DNA hybridization procedures<br />
[3]. Viral infections pose a threat for mankind [4]. Certain viruses such as Human<br />
Immunodeficiency Virus (HIV) or influenzas viruses (mainly influenza A virus subtype<br />
H5N1) can evoke pandemics with high mortality. The time is very important in these<br />
cases of pandemics because the rapid detection can safe many lives. This magnetic bioprobe<br />
can be smart tool obtain this property of rapid technique.<br />
- 140 -
XI. Woorkshop<br />
of Physsical<br />
Chemists and a Electrochemmists´11<br />
Quantum dots, which<br />
also fouund<br />
usage for biomed dical intenttions,<br />
can be utilizedd<br />
eitheer<br />
in colloiidal<br />
phase mainly as labels in fl luorescence e imaging oor<br />
in epitaxial<br />
grownn<br />
formm<br />
as biosennsors<br />
for in n situ detecction<br />
of bio omolecules s [5]. Geneerally,<br />
they y consist off<br />
semiiconductorss<br />
like CdSe e, CdTe, CCdHgTe,<br />
bu ut most fre equently thhey<br />
are fab bricated ass<br />
core/ /shell mateerial,<br />
e.g. CdSe/ZnS.<br />
Since<br />
they are a intende ed to be useed<br />
in biosy ystems, twoo<br />
key pparameters<br />
must be sa atisfied: no toxicity and<br />
solubility y in aqueouus<br />
medium.<br />
2. NANOSTTRUCTUR<br />
RES AND TTHEIR<br />
AP PPLICATIO ONS<br />
Results annd<br />
experien nces obtainned<br />
in nano otechnology y using in ssensing<br />
are e nowadayss<br />
very y wide. Thhe<br />
non-lit thography template- -based tech hniques of electrod de surfacess<br />
nanoostructuringg<br />
were dev veloped [6] . Nickel na anopillars as a example are shown n in Fig.1a, ,<br />
gold nanotubes in Fig.1b, CNTs C in Figg.1c.<br />
aa)<br />
Fig. 1 Nickel naanopillars<br />
(a a), gold nannotubes<br />
(b) , carbon na anotubes (CCNTs)<br />
(c).<br />
The nanoostructures<br />
on electroode<br />
can be<br />
used for r increasingg<br />
specific affinity orr<br />
selecctivity<br />
moleecules<br />
in diagnosis d inn-vitro<br />
from m human fl luids e.g. uurease<br />
[7] or o it can bee<br />
b) b<br />
- 141 -<br />
c) c<br />
Brnoo
XI. Workshop oof<br />
Physical Cheemists<br />
and Electrochemists´11<br />
covered bby<br />
oxide naanoparticle<br />
es for gas ddetection<br />
[8], [ where significanttly<br />
increase e the<br />
sensing arrea<br />
resultinng<br />
to highe er signal ouutput<br />
and lower l detec ction limitts<br />
regarding g S/N<br />
ration risinng.<br />
The carbon eleectrode<br />
wa as substitutted<br />
by car rbon nanot tubes (CNTTs)<br />
[9]. Sui itable<br />
using andd<br />
modificattion<br />
of CN NTs deposiited<br />
on electrode<br />
ca an enhancee<br />
the dete ection<br />
properties.<br />
Patterninng,<br />
sprayin ng with oorganic<br />
vehicle,<br />
dire ect grow iin<br />
PECVD D are<br />
nowadays used for deeposition.<br />
CNTs C are ussed<br />
in sensi ing pure or r functionallized<br />
to inc crease<br />
specific seensitivity<br />
ffor<br />
exampl le in case of heavy metals an nd other ttoxic<br />
substa ances<br />
detection [10].<br />
Fig. 2 Quaantum<br />
dotss<br />
functiona alized by biotin-glutat<br />
thione and d streptaviddin<br />
as bio-p probe<br />
for labelling oof<br />
DNA.<br />
Nowwadays<br />
in medical diagnosis d nnew<br />
approaches<br />
emp ploying naanoparticles<br />
s are<br />
utilized. QQuantum<br />
doots<br />
are obje ective of thhe<br />
research h as bio-pro obe with seeveral<br />
func ctions<br />
[11]. Currrent<br />
way is focuse ed on labbeling<br />
for r in-vivo imaging. Technique es of<br />
functionallization<br />
of quantum dots by biiotinated<br />
glutathione g were alsoo<br />
developed<br />
for<br />
sensing appplications<br />
[12]. Their r principal l function is i presented<br />
in Fig. 22.<br />
Another very<br />
interestingg<br />
applicatioon<br />
of nan noparticles is using modified m paramagnet p tic particle es for<br />
separationn<br />
of desiredd<br />
molecules<br />
[13] fromm<br />
body flu uids brings perspectivee<br />
tool for rapid<br />
techniquess<br />
of virusees,<br />
bacteria<br />
or interresting<br />
biomolecules<br />
detection [14]. Also o the<br />
technique can be used<br />
for heavy y metal deteection<br />
[15] and drug delivery d [166].<br />
3. CONNCLUSIONN<br />
The paper deaals<br />
about techniquess<br />
and usin ng of new nanomateerials<br />
in se ensor<br />
constructioon<br />
and in medicine applicationns.<br />
Metal nanostruct tures verticcally<br />
aligne ed to<br />
surfaces oof<br />
electrodes<br />
have been<br />
foundd<br />
to be su uitable in chemical c ssensing.<br />
Se everal<br />
techniquess<br />
can be ussed<br />
for incr reasing of ssensitivity<br />
as a modifica ation and fuunctionaliz<br />
zation<br />
of nanostrructures<br />
to iincrease<br />
th he affinity too<br />
detected ions or molecules.<br />
Quuantum<br />
dot ts and<br />
magnetic nanoparticcles<br />
were shown as very prom mising tool ls in mediccine<br />
as in n-vivo<br />
diagnosis aand<br />
drug deelivery.<br />
4. ACKKNOWLEDDGEMENT<br />
T<br />
The work has been supported<br />
by pproject<br />
GAA AV KAN20 08130801 ( (NANOSEM MED)<br />
and the fraame<br />
of reseearch<br />
plan MSM M 00216630503.<br />
- 142 -<br />
Brno
XI. Workshop of Physical Chemists and Electrochemists´11 Brno<br />
5. REFERENCES<br />
[1] Shingubaras S., Journal of Nanoparticle Research, ISSN: 1388-0764, Vol. 5, No. 1-2<br />
[2] Ajayan P.M.; Chem. Rev., 99 (1999), pp 1787-1799.<br />
[3] Liu H.L., Sonn C.H., et al., Biomaterials. 29 (2008) 4003-4011.<br />
[4] Gessain A. and Calattini S., Future Virol., 2008, pp. 71-81.<br />
[5] Drbohlavova J., Adam V., Kizek R., Hubalek J., Int. J. Mol. Sci. 10 (2009) 656-673<br />
[6] Klosova, K., Hubalek, J., physica status solidi Vol. 205, No. 6, 2008, pp. 1435 – 1438<br />
[7] Hubalek J., et al., Sensors Vol. 7, No. 7, 2007, pp. 1238-1255<br />
[8] Drbohlavova, J.,et al., Chemické listy Vol. 102, No. 15, 2008, pp. S1043-2<br />
[9] Prasek J., et al., IEEE Sensors Vol. 1-3, 2006, pp. 1257-1260<br />
[10] Majzlik P., et al., Listy cukrovarnicke a reparske Vol. 126, No. 11, 2010, pp. 413-414<br />
[11] Drbohlavova, J., et al., International Journal of Molecular Sciences Vol. 10, No. 2, 2009, pp. 656 – 673<br />
[12] Chomoucka J., 32nd International Spring Seminar on Electronics Technology, 2009 pp. 653-657<br />
[13] Drbohlavova J., et al., Sensors Vol. 9, No. 4, 2009, pp. 2352-2362<br />
[14] Kukacka, J., et al., Clinical Chemistry Vol. 55, No. 6, 2009, pp. A42<br />
[15] Huska D., et al., FEBS Journal Vol. 276, 2009, pp. 281-281<br />
[16] Chomoucka, J.; Drbohlavova, et. al., Pharmacological Research Vol. 62, No. 2, 2010, pp. 144 – 149<br />
- 143 -
XI. Workshop of Physical Chemists and Electrochemists´11 Brno<br />
ELECTROCHEMICAL ANALYSIS OF DNA<br />
AND CADMIUM IONS INTERACTION<br />
Dalibor HŮSKA 1 , Jan SLAVÍK 2 , Vojtěch ADAM 1 , Libuše TRNKOVÁ 3 , René KIZEK 1<br />
1 Department of Chemistry and Biochemistry, Mendel University in Brno, Zemedelska 1, CZ-613 00 Brno,<br />
Czech Republic<br />
2 Department of Biomedical Engineering, Faculty of Electrical Engineering and Communication, Brno<br />
University of Technology, Kolejni 4, CZ-612 00 Brno, Czech Republic<br />
3 Department of Chemistry Faculty of Science, Masaryk University, Kotlarska 2, CZ-611 37 Brno, Czech<br />
Republic<br />
Abstract<br />
Cadmium (Cd) is a highly toxic environmental pollutant dangerous especially due to the<br />
ability of accumulation. Cd is emitted to the environment mostly by metallurgy, mining<br />
industry and production of nickel-cadmium batteries. The intoxication is caused mostly<br />
by cigarette smoke, foodstuffs and air pollution. The connection between cadmium and<br />
prostate, lung and testicles cancer as well as kidney and liver failure, lung oedema and<br />
spondylomalacia was proven. (Tokumoto 2011).<br />
Cd also generates reactive oxygen forms, damage DNA influence the function of proteins<br />
connected with an antioxidant defence of the organism. This work is focused on<br />
monitoring of the interactions between Cd ions and chicken genome DNA by square wave<br />
voltammetry on hanging mercury drop electrode. Significant signal decrease of 25% and<br />
80% was observed in DNA exposed to Cd ions for 1 hour and 3 days, respectively.<br />
1. INTRODUCTION<br />
Cd toxicity was observed already in 1955 in Japan (Itai-itai dinase) and negative<br />
impacts on human health were proven since then. The most serious effects of Cd on<br />
human health include immune failure, osteoporosis, prostate and lung cancer and/or<br />
kidney and liver failure. Also DNA damage and gene expression disruption as well as<br />
influence of antioxidant proteins are other impacts of Cd exposure. At the cell level Cd<br />
influence the progresses in cell cycle and methylation inhibition. The effects on DNA<br />
synthesis and cell proliferation are dependent on Cd concentration. It was found that<br />
already at 1 μM concentrations these processes are inhibited. However at lower<br />
concentrations the DNA synthesis and cell proliferation is stimulated. The main effect of<br />
Cd on DNA is in creation of single strand breaks (SSB) and chromosomal aberrations,<br />
sister chromatid exchanges and DNA–protein binding failures in several types of<br />
mammalian cells (Bertin a Averbeck, 2006, Huska, a kol., 2009, Palecek a Jelen, 2002,<br />
Tokumoto, a kol., 2011). The aim of this work is to monitor the interaction between DNA<br />
and Cd ions by electrochemical methods.<br />
- 144 -
XI. Woorkshop<br />
of Physsical<br />
Chemists and a Electrochemmists´11<br />
2. EXPERIMMENT<br />
Electrochhemical<br />
me easurementts<br />
were performed<br />
w<br />
connnected<br />
to 7446<br />
VA Trac ce Analyzerr<br />
and 695 Autosample A<br />
a standard<br />
cell with three electrodes s and cooled d sample ho<br />
dropp<br />
electrode (HMDE) with w a droop<br />
area of 0.4 mm<br />
Ag/AAgCl/3M<br />
KKCl<br />
electrod de was the reference<br />
electtrode.<br />
GPPES<br />
4.9 suppliedd<br />
by<br />
EcoCChemie<br />
waas<br />
employe ed. The annalysed<br />
sampples<br />
were deoxygen nated prioor<br />
to<br />
softwware<br />
measuurements<br />
by b purgingg<br />
with<br />
argonn<br />
(99.999% %) saturated d with watter<br />
for<br />
120 s. Electrocchemical<br />
measuremen<br />
m nt An<br />
acetaate<br />
buffer ( (0.2 M CH H3COOH + 0.2 M<br />
CH3CCOONa;<br />
pH5) was w used for<br />
electtrochemical<br />
measure ement. Chhicken<br />
genoome<br />
DNA aand<br />
Cd(NO3 3)2 were ussed<br />
for<br />
expeeriments.<br />
2 with 747 VVA<br />
Stand instrument i t<br />
r (Metrohmm,<br />
Switzerland),<br />
usingg<br />
older (4 °C) ). A hangin ng mercuryy<br />
was w the wo working elec ctrode. Ann<br />
and glassy carbon eleectrode<br />
wa as auxiliaryy<br />
3. RESULTS<br />
AND DISCUSSIO<br />
D<br />
First, the dependenc cy of the si<br />
was iinvestigated.<br />
Signal in ncreased int<br />
range<br />
from 0,2 to 6,25 μg/ ml was obe<br />
3.48224<br />
with ccoefficient<br />
(Fig. 1).<br />
R2 ON<br />
ignal response<br />
on the concentraation<br />
of chi icken DNAA<br />
the concen ntration range<br />
0.2 – 50 0 μg/ml and d the linearr<br />
erved. The calibration n curve equaation<br />
is: y = 193.64x +<br />
of 0.9975<br />
Based onn<br />
these ex xperimentss<br />
DNA<br />
conccentration<br />
of 3 μg/ml l was chossen<br />
for<br />
furthher<br />
expeeriments.<br />
Cd(NO3) )2 at<br />
conccentratios<br />
oof<br />
1 μM, 5 μM and 10 μM<br />
was used. All of these Cd C concenttrations<br />
decreeased<br />
the signal<br />
of DN NA for abouut<br />
35%<br />
in 600<br />
minutes oof<br />
interactio on (Fig. 2).<br />
Fig. 22.<br />
Interacti ion of chick ken DNA wwith<br />
Cd2+ af fter 60 min. .<br />
The signiificantly<br />
hi igher decreease<br />
in the e DNA sign nal was obbserved<br />
afte er 72 hourr<br />
expoosure<br />
to thee<br />
Cd ions. One O μM Cd ions caused<br />
80% decr rease in thee<br />
signal in comparison c n<br />
- 145 -<br />
Brnoo<br />
Fig.1. Calibration<br />
cuurve<br />
of chic cken DNA. .
XI. Workshop oof<br />
Physical Cheemists<br />
and Electrochemists´11<br />
to pure DNNA.<br />
The deecrease<br />
was 60% and 990%<br />
in case e of 5 μM Cd C and 10 μμM,<br />
respect tively<br />
(Fig. 3).<br />
Subssequently<br />
tiime-depend<br />
dency of DDNA<br />
signal in presence<br />
of Cd ionns<br />
was expl lored.<br />
Twelve meeasurementts<br />
of the DN NS signal innteracting<br />
with 5 M Cd ions wwas<br />
perform med in<br />
6-minute intervals. The decrea ase of 10-115%<br />
was observed o be etween 5 aand<br />
30 mi inute.<br />
Between 330<br />
and 70 mminute<br />
the e signal deccreased<br />
to the 50% of<br />
the originnal<br />
value. In I 72<br />
hours the signal of onnly<br />
20% of the originaal<br />
value was s observed (= 80% deccrease)<br />
The impact of tthe<br />
Cd ions<br />
on a shorrt<br />
nucleotid de (GAAGG GAACAGGGACAAGCT<br />
TGC)<br />
was also thhe<br />
interest.<br />
Therefore e the same experimen nt as describ bed previouusly<br />
was ca arried<br />
out. Besidees,<br />
no decreease<br />
in the DNA signaal,<br />
but even n about 10% % increase wwas<br />
observe ed.<br />
Fig. . 3. Interact tion of chiccken<br />
DNA with w Cd2+ after a 72 h.<br />
4. CONNCLUSIONN<br />
Fromm<br />
the obtainned<br />
results s follow thaat<br />
electroch hemical methods<br />
suchh<br />
as square wave<br />
voltammettry<br />
using hhanging<br />
me ercury dropp<br />
electrode are able to o monitor cchanges<br />
in DNA<br />
signal caussed<br />
by the toxic eleme ents such aas<br />
cadmium m It can be concluded c that Cd res strain<br />
the adeninne<br />
and cytoosine<br />
reduct tion on thee<br />
electrode and therefo ore lower ccurrent<br />
resp ponse<br />
is detectedd.<br />
On the other hand d it is inteeresting<br />
tha at such a decrease d inn<br />
the signal l was<br />
observed iin<br />
the anaalysis<br />
of th he chicken genome DNA D but not n in the analysis of o the<br />
synthetic oligonucleootide,<br />
wher re the signnal<br />
even inc creased. Th his phenommenon<br />
is no ot yet<br />
clear and rrequires<br />
furrther<br />
invest tigation.<br />
5. ACKKNOWLEDDGEMENT<br />
T<br />
The work has bbeen<br />
suppor rted by NAANIMEL<br />
GA A ČR 102/08/1546.<br />
- 146 -<br />
Brno
XI. Workshop of Physical Chemists and Electrochemists´11 Brno<br />
6. REFERENCES<br />
[1] BERTIN, G.; AVERBECK, D. Cadmium: cellular effects, modifications of biomolecules, modulation of<br />
DNA repair and genotoxic consequences (a review). Biochimie, 2006, roč. 88. č. 11, s. 1549-1559. ISS<br />
0300-9084.<br />
[2] HUSKA, D.; ADAM, V.; BABULA, P.; HRABETA, J.; STIBOROVA, M.; ECKSCHLAGER, T.;<br />
TRNKOVA, L.; KIZEK, R. Electroanalysis, 2009, roč. 21. č. 3-5, s. 487-494. ISS 1040-0397. clanek IF<br />
2.630<br />
[3] PALECEK, E.; JELEN, F.. Crit. Rev. Anal. Chem., 2002, roč. 32. č. 3, s. 261-270. ISS 1040-8347.<br />
[4] TOKUMOTO, M.; OHTSU, T.; HONDA, A.; FUJIWARA, Y.; NAGASE, H.; SATOH, M. Journal of<br />
Toxicological Sciences, 2011, roč. 36. č. 1, s. 127-129. ISS 0388-1350.<br />
- 147 -
XI. Workshop of Physical Chemists and Electrochemists´11 Brno<br />
FABRICATION OF COPPER<br />
MICROPARTICLES BASED WORKING<br />
ELECTRODES FOR ELECTROCHEMICAL<br />
DETECTION OF ADENINE<br />
Jana CHOMOUCKÁ 1 , Jan PRÁŠEK 1 , Petra BUSINOVÁ 1 , Libuše TRNKOVÁ 2 , Jaromír<br />
HUBÁLEK 1<br />
1 LabSensNano, Department of Microelectronics, Faculty of Electrical Engineering and Communication,<br />
Brno University of Technology, Technicka 3058/10, CZ-616 00 Brno, Czech Republic<br />
2 Department of Chemistry, Faculty of Science, Masaryk University, Kamenice 5, CZ-625 00 Brno, Czech<br />
Republic<br />
Abstract<br />
This paper is focused on the preparation and characterization of Cu2O nanoparticles via<br />
simple wet chemical route. Samples were characterized by SEM and XRD. These<br />
nanoparticles were used for fabrication of spraying working electrodes for electrochemical<br />
detection of purine bases in DNA.<br />
1. INTRODUCTION<br />
Cuprous oxide (Cu2O) is a p–type metal oxide semiconductor with a direct band gap<br />
of 2.0–2.2 eV. It has attracted increasing interest due to its promising application in<br />
magnetic devices, solar energy conversion and catalysts [1].<br />
New types of solid electrodes are necessary for small device technologies contrary to<br />
standard electrochemical analysis, where mercury drop electrodes are commonly used.<br />
The performance of solid electrode is determined by its surface modifications to make it<br />
sensitive and selective towards a certain analyte, to obtain either chemically or<br />
biochemically modified electrodes [2]. Solid electrodes can be fabricated by thick–film<br />
technology (TFT) process. The advantage of TFT is its flexibility, low production costs,<br />
good reproducibility and good electrical and mechanical properties of electrodes.<br />
2. EXPERIMENT<br />
Cu2O microparticles preparation<br />
The preparation method of Cu2O nanoparticles is based on the procedure reported in<br />
[3]. Nanoparticles were prepared by two-step synthesis. At first, 0.0035 mol<br />
Cu(CH3COO)2·H2O was dissolved in 100 mL absolute ethanol under ultrasonic to form the<br />
deep green solution. The solution was heated to 60 °C. Than 50 mL glucose aqueous<br />
solution (0.1 mol/L) was slowly added into the solution under vigorous stirring. After<br />
that, 50 mL NaOH aqueous solution (0.5 mol/L) was also added to the solution at the same<br />
speed. Then some light yellow precipitates was occurred. The particles in the suspension<br />
were then separated by centrifugation at 4000 rpm for 8 min. The particles were<br />
- 148 -
XI. Workshop of Physical Chemists and Electrochemists´11 Brno<br />
resuspended in absolute ethanol followed by distilled water. The centrifugation was<br />
repeated thrice to remove CH3COO − , glucose and NaOH. The light yellow precipitate was<br />
then dried under nitrogene atmosphere overnight.<br />
Electrodes fabrication<br />
Working mikroelectrodes were fabricated using standard thick-film technology<br />
process on the alumina substrate. Thick-film pastes used for contact and covering layers<br />
were ESL 9562-G and ESL 4917 both from ESL Electroscience, UK. Carbon paste BQ 221<br />
(Dupont) was screen-printed over Ag/Pd/Pt based contact layer to avoid the contact<br />
layer to be present in electrochemical reaction.<br />
The working electrode was fabricated by spray coating deposition using Cu2O<br />
microparticles powder as the filling material N-Methyl-Pyrrolidone (NMP) as a carrier<br />
and binding material. For spray coating deposition 0.4 g of Cu2O microparticles with 10<br />
ml of NMP and the mixture was dispersed in an ultrasonic bath for 30 minutes.<br />
The spray-coating process was done using standard airbrush gun Fengda BD-208. To<br />
ensure good shape of the electrode a precise template was used for the deposition and the<br />
substrate was heated to 250 °C. The spray-coating process was repeated until the carbon<br />
layer was totally covered with the nanotubes to prevent later impact to electrochemical<br />
analysis.<br />
Electrochemical measurement<br />
Electrochemical measurements were performed with PalmSens handheld<br />
potentiostat/galvanostat (Palm Instruments BV, Netherlands). The device was connected<br />
to a personal computer for measurement setup and response evaluation. A three–electrode<br />
system was used, Cu2O electrode was employed as the working electrode, an Ag/AgCl/3M<br />
KCl electrode served as the reference electrode and Pt electrode was used as the auxiliary<br />
electrode. Cyclic voltammetry (CV) were carried out in the presence of 20 ml 0,2 M<br />
acetate buffer pH 5.0 and in the presence of various concentration of adenine. CV<br />
parameters: scan rate 100 mV/s, potential range -0.5 to 0.5 V.<br />
3. RESULTS AND DISCUSSION<br />
In our experiment, glucose was used as reductant. Reduction of Cu(II) tartrate<br />
complex by glucose can yield stable sols of cuprous oxide, whose particle size and<br />
morphology are strongly dependent on the concentration of reactants As shown in Fig. 1,<br />
sample has a spherical aggregation with a diameter of 1000 nm. But they are<br />
conglomerated by smaller particles with the mean size of 150 nm. According to the XRD<br />
measurement, we prepared Cu2O/CuO nanoparticles consisted of 70 % Cu2O and 30 %<br />
CuO.<br />
- 149 -
XI. Workshop oof<br />
Physical Cheemists<br />
and Electrochemists´11<br />
The electrocheemical<br />
oxid dation of aadenine,<br />
gu uanine or other puriine<br />
derivat tes at<br />
carbon eleectrode<br />
is wwell<br />
known n. Formationn<br />
of complexes<br />
of these<br />
compouunds<br />
with metals m<br />
including copper has<br />
been studied.<br />
Speciies<br />
Cu(II) can be red duced to CCu(I)<br />
and in n the<br />
presence of adeninee,<br />
Cu(I) re eacts with adenine to form in nsoluble ccompounds<br />
that<br />
accumulatte<br />
on the electrode<br />
sur rface [4] and<br />
cause dec creasing of current ressponse<br />
(Fig.2).<br />
Current [uA]<br />
200<br />
150<br />
100<br />
50<br />
0<br />
‐50<br />
‐100<br />
‐150<br />
‐0,66<br />
‐0,4<br />
Fig.1 SEM S image of Cu2O na anoparticle es<br />
1.2 2.10‐6 M Adde<br />
2.4 4.10‐6 M Adde<br />
4.8 8.10‐6 M Adde<br />
0 M Ade<br />
‐0,2 0<br />
PPotential<br />
[V]<br />
Fig.1 Cycliic<br />
voltammmograms<br />
rep presenting the electro ochemical behaviour b oof<br />
Cu2O working<br />
elecctrode.<br />
CVV<br />
conditions;<br />
100 mV/ /s scan rate e in potent tial range bbetween<br />
+0 0.5 V<br />
andd<br />
−0.5 V.<br />
4. CONNCLUSIONN<br />
Cu2OO<br />
microparrticles<br />
for preparatioon<br />
of thic ck film pa astes weree<br />
prepared and<br />
characterizzed.<br />
Prepaared<br />
microp paricles weere<br />
sprayed<br />
on prev viously preppared<br />
electrode<br />
substrate. These eleectrodes<br />
were w succeessfully<br />
used<br />
as the working electrodes s for<br />
electrocheemical<br />
detecction<br />
of ade enine.<br />
- 150 -<br />
0,2<br />
0,4<br />
0,6<br />
Brno
XI. Workshop of Physical Chemists and Electrochemists´11 Brno<br />
5. ACKNOWLEDGEMENT<br />
The financial support from the grant GAČR 102/08/1546 and the frame of Research<br />
Plan MSM 0021630503 is highly acknowledged.<br />
6. REFERENCES<br />
[1] Zahmakiran, M., Ozkar, S., et al.: Mater. Lett., 2009, 63, 400-402.<br />
[2] Pravda, M., O'Meara, C., et al.: Talanta, 2001, 54, 887-892.<br />
[3] Huang, L., Peng, F., et al.: Solid State Sciences, 2009, 11, 129-138.<br />
[4] Trnkova, L., Zerzankova, L., et al.: Sensors, 2008, 8, 429-444.<br />
- 151 -
XI. Workshop of Physical Chemists and Electrochemists´11 Brno<br />
PREPARATION OF WATER SOLUBLE<br />
GLUTATHIONE-COATED CDTE QUANTUM<br />
DOTS<br />
Jana CHOMOUCKÁ 1 , Markéta RYVOLOVÁ 2 , Libor JANU 2 , Jana DRBOHLAVOVÁ 1 ,<br />
Vojtěch ADAM 2 , René KIZEK 2 , Jaromír HUBÁLEK 1<br />
1 Department of Microelectronics, Faculty of Electrical Engineering and Communication, Brno University of<br />
Technology, Technicka 3058/10, CZ-616 00 Brno, Czech Republic<br />
2 Department of Chemistry and Biochemistry, Faculty of Agronomy, Mendel University, Zemedelska 1, CZ-<br />
613 00 Brno, Czech Republic<br />
Abstract<br />
In this paper, water soluble glutathione-coated CdTe quantum dots were prepared by a<br />
simple one step method using Na2TeO3 and CdCl2. Obtained QDs were separated from the<br />
excess of the glutathione by capillary electrophoresis employing 300 mM borate buffer<br />
with pH 7.8 as a background electrolyte.<br />
1. INTRODUCTION<br />
Quantum dots (QDs) are nanometer-sized crystals made of metallic or mostly of<br />
semiconductor materials with dimensions in the range of 2–10 nm. QDs are characterised<br />
by a number of unique physical and optical properties like strong light absorbance, sizetuneble<br />
emission, bright fluorescence, high quantum yield, narrow symmetric emission<br />
bands, high photostability and low photobleaching rates [1]. Their broad absorption<br />
spectrum allows the simultaneous excitation of QDs of all sizes by a single excitation light<br />
source in the UV to violet part of spectrum. QDs play an important role mainly in the<br />
imaging and as fluorescent probes for biological sensing [2]. The most popular types of<br />
QDs include CdTe, CdSe, ZnSe, ZnS, however also other semiconductor metals such as In,<br />
Ga, and many others can be used. Majority of sensing techniques employing QDs in<br />
biological systems are applied in solution (colloidal form) [3]. The organometallic way<br />
produces QDs, which are generally capped with hydrophobic ligands (e.g.<br />
trioctylphosphine oxide - TOPO or trioctylphosphine - TOP) and hence cannot be<br />
directly employed in bioapplications. Such hydrophobic QDs have to be transferred from<br />
the organic phase to aqueous solution, which is quite complicated procedure and often<br />
associated with the significant loss of quantum yield and stability. The second way is the<br />
aqueous synthesis route, producing QDs with excellent water solubility, biological<br />
compatibility, and stability. Thiol-capped QDs could be prepared directly in aqueous<br />
solution with thiols as efficient stabilizers. Mercaptopropionic acid and reduced<br />
glutathione (GSH) are the most popular coatings among thiols. GSH is not only an<br />
important water-phase antioxidant and essential cofactor for antioxidant enzymes, but<br />
also plays roles in catalysis, metabolism, signal transduction and gene expression [4]. GSH<br />
due to its key function in detoxification of heavy metals in organisms provides an<br />
additional functionality to the QDs. In addition, GSH-QDs exhibit high sensitivity to H2O2<br />
- 152 -
XI. Workshop of Physical Chemists and Electrochemists´11 Brno<br />
produced from the glucose oxidase catalyzing oxidation of glucose and therefore glucose<br />
can be sensitively detected by the quenching of the GSH-QDs florescence. Beside the<br />
application as simple sensors, QDs have much higher impact as unique fluorescent labels.<br />
Various specific labeling strategies are known and most of these approaches are based on<br />
bioconjugation with other biomolecule exhibiting some specific affinity to the target<br />
compound [5].<br />
QDs can be applied in molecule tracking in immunochemistry, where they replace<br />
the fluorescent beads used for study of dynamics of neurotransmitter receptors. Due to<br />
their much smaller size compared to latex beads (approx. 500 nm), the lateral movement<br />
of individual receptor can be studied in great detail. Another example of QDs application<br />
is in genetic disease screening and diagnostics, where, in combination with stage-scanning<br />
confocal microscopy, they provide the imaging of QDs chromatic free aberrations, with<br />
resolution better than 10 vnm. Infrared QDs were also found to be useful probes for noninvasive<br />
detection in vivo, mainly inside small animals, where they can substitute<br />
conventional organic fluorophores emitting in the IR, which suffer from poor stability<br />
and quantum yield.<br />
2. EXPERIMENT<br />
Synthesis of glutathione coated CdTe QDs<br />
The procedure for synthesis of glutathione coated CdTe QDs was adapted from the<br />
work of Duan et al. [6]. Sodium telluride was used as the Te source. Due to the fact that<br />
sodium telluride is air stable, all of the operations were performed in the air avoiding the<br />
need for inert atmosphere. The synthesis of CdTe QDs and their subsequent coating were<br />
as follows: 2 mL of the CdCl2 solution (c = 0.04 mol/L) was diluted with 21 mL of water.<br />
During constant stirring, 50 mg of sodium citrate, 2 mL of Na2TeO3 solution (c = 0.01<br />
mol/L), 150 mg of GSH and 20 mg of NaBH4 were added into water-cadmium(II) solution.<br />
The mixture was kept at 95°C under the reflux cooling for 2.5 hours. As a result, yellow<br />
solution of the GSH-QDs was obtained.<br />
Capillary electrophoresis<br />
Synthesized GSH-QDs were analyzed by capillary electrophoresis (Beckman<br />
Coulter, PACE 5500) with absorbance detection at 214 nm and with the laser-induced<br />
fluorescence detection (Ar + , λex - 488 nm/ λem - 530 nm). Separation of the excess of B-GSH<br />
and GSH was carried out using uncoated fused silica capillary with 50 μm internal<br />
diameter and 375 μm b outer diameter. Total length was 47 cm and the effective length<br />
was 40 cm. Borate buffer (300 mmol/L, pH 7.8) was used as a background electrolyte.<br />
3. RESULTS AND DISCUSSION<br />
We prepared water soluble glutathione-coated CdTe QDs by a simple one step<br />
method using Na2TeO3 and CdCl2. The prepared GSH-CdTe QDs at 520 nm (Fig.1) and<br />
their emission spectrum showed quite symmetric and narrow shape. An inset in Fig. 1<br />
shows the solution of the GSH-QDs under the ambient light (left) and the fluorescence<br />
under the illumination by the UV lamp is shown on the right.<br />
- 153 -
XI. Workshop oof<br />
Physical Cheemists<br />
and Electrochemists´11<br />
Fig.1 Fluoorescence<br />
sspectrum<br />
of o GSH-CdTTe<br />
QDs. In nset: GHS-QDs<br />
underr<br />
ambient light<br />
(lefft),<br />
GSH-QD QDs under UV U light illuumination<br />
(right) (<br />
The typical elecctropherog<br />
gram of the GSH CdTe e QDs solut tion is showwn<br />
in the Fig F 2.<br />
The identtification<br />
GSH signal<br />
was doone<br />
by th he standar rd additionn<br />
method and<br />
identificattion<br />
of the GGSH-QDs<br />
signal s was ddone<br />
by CE E-LIF.<br />
GSH<br />
Fig.2 Electtropherograam<br />
of GSH-QDs,<br />
UV detection at a 214 nm, LIF L detectiion<br />
(488 nm m/530<br />
nmm)<br />
4. CONNCLUSIONN<br />
It folllows<br />
fromm<br />
the results<br />
obtained that GSH<br />
synthesis of thiol sttabilized<br />
Cd dTe QDs. Obtained<br />
fluorimetrric<br />
detection<br />
with the e excitationn<br />
by Ar<br />
emission oof<br />
530 nm.<br />
+ is suitable coating forr<br />
the single e step<br />
QDs are of o good prooperties<br />
for<br />
the<br />
las ser at the wavelength w h of 488 nm m and<br />
- 154 -<br />
GSH‐QDs<br />
Brno
XI. Workshop of Physical Chemists and Electrochemists´11 Brno<br />
5. ACKNOWLEDGEMENT<br />
The financial support from the grant KAN 208130801 and the frame of Research<br />
Plan MSM 0021630503 is highly acknowledged.<br />
6. REFERENCES<br />
[1] Drummen, G.: Int. J. Mol. Sci., 11 (2010), 154-163.<br />
[2] Chomoucka, J., Drbohlavova, J. et al.: Procedia Engineering, 5 (2010), 922<br />
[3] Drbohlavova, J., Adam, V. et al.: Int. J. Mol. Sci., 10 (2009), 656<br />
[4] Liu, Y.F., Yu, J.S.: J. Colloid Interface Sci., 333 (2009), 690<br />
[5] Ryvolova, M., Chomoucka, J. et al.: Electrophoresis, 32 (2011), 1<br />
[6] Duan, J. L., Song, L. X. et al.: Nano Res., 2 (2009), 61<br />
- 155 -
XI. Workshop of Physical Chemists and Electrochemists´11 Brno<br />
APPLICATION OF CITP FOR BIOMINERAL<br />
ANALYSIS<br />
Zdeňka JAROLÍMOVÁ 1 , Přemysl LUBAL 1<br />
1 Department of Chemistry, Faculty of Science, Masaryk University, Brno<br />
Abstract<br />
This contribution concerns the possibility of application of capillary isotachophoresis<br />
(CITP) for analysis of biominerals concerning of less soluble compounds (calcium oxalate,<br />
hydroxyapatite).<br />
1. INTRODUCTION<br />
CITP is an analytical electromigration technique, which enables ion’s separation<br />
based on their different mobilities [1]. The goal of this work was to develop analytical<br />
method for simultaneous determination of anions such as oxalates and phosphates and<br />
their species which can be found in biominerals (e.g. renal stones). The developed method<br />
was utilized for the study of composition and solubility of those compounds in order to<br />
follow the experimental conditions driving their solubility.<br />
2. EXPERIMENTAL<br />
Method optimization for separation and determination of analytes was carried out<br />
on electrophoretic equipment EA 102 (Villa Labeco, Spišská Nová Ves, Slovakia) on PTFE<br />
capillary (diameter 0.3 mm, length 200 mm) joined with conductivity detector under<br />
laboratory temperature. The samples were analyzed under following conditions: 10 mM<br />
HCl + histidine (leading electrolyte, pH = 5.50), 10 mM hexanoic acid + imidazole<br />
(terminating electrolyte, pH = 7.00). 0.1% solution of hydroxyethylcellulose was added to<br />
eliminate electro-osmotic flow.<br />
3. RESULTS AND DISCUSSION<br />
The analytical procedure was optimized for simultaneous determination of mixture<br />
of anionic oxalate and phosphate species. Detection limits for anion determination were<br />
calculated from their calibration lines: phosphate 0.9 M, diphosphate 5.0 μM,<br />
triphosphate 1.9 μM, oxalate 0.7 μM. Then this procedure was applied for analysis of<br />
samples of renal stones (see Fig. 1) and it was shown that developed approach can<br />
distinguish the kind of stone consisting of calcium phosphate and calcium oxalate[2]. This<br />
approach was also employed for the study of solubility of these compounds (calcium<br />
oxalate, hydroxyapatite) which are present in biominerals [2].<br />
- 156 -
XI. WWorkshop<br />
of Phyysical<br />
Chemists and Electrocheemists´11<br />
Fig. . 1: The exxample<br />
of ITP I recordd<br />
of renal stone s of ox xalate class. . The first zone is<br />
oxalate,<br />
the second d zone is phhosphate.<br />
4. CONCLLUSION<br />
This conntribution<br />
is i related tto<br />
biomine eral analysi is by meanns<br />
of CITP P which<br />
seemms<br />
to be mmore<br />
suitabl le alternativve<br />
to other r analytical l methods eemployed<br />
in i anion<br />
analysis<br />
(CZE,<br />
ionic chr romatograpphy).<br />
Also it can be used for study of physico- p<br />
chemical<br />
proceesses<br />
leadin ng to formaation<br />
of these<br />
biominerals.<br />
5. ACKNOOWLEDGE<br />
EMENT<br />
The worrk<br />
was sup pported byy<br />
Ministry of Educat tion of thee<br />
Czech Republic R<br />
(proojects<br />
ME009065<br />
and d LC060355)<br />
and Gr rant agenc cy of the Czech Republic R<br />
(2033/09/1394).<br />
.<br />
6.<br />
REFEREENCES<br />
[1] BBoček<br />
P., Demml<br />
M., Gebaue er P., Dolník V., Analytick ká kapilární iz zotachoforézaa<br />
(Analytical Capillary<br />
Isotachophhoresis),<br />
Acad demia, Praha 1987.<br />
[2] KKönigsberger<br />
E., Königsbe erger L.C., Biiomineralizati<br />
ion: Medical Aspects of SSolubility,<br />
Wi iley, New<br />
York 20066.<br />
- 157 -<br />
Brno
XI. Workshop of Physical Chemists and Electrochemists´11 Brno<br />
UTILIZATION OF FRACTIONAL<br />
EXTRACTION FOR CHARACTERIZATION<br />
OF THE INTERACTIONS BETWEEN HUMIC<br />
ACIDS AND METALS<br />
Michal KALINA 1 , Martina KLUČÁKOVÁ 1 , Petr SEDLÁČEK 1<br />
1 Brno University of Technology, Faculty of Chemistry, Centre for Materials Research<br />
CZ.1.05/2.1.00/01.0012, Purkyňova 464/118, 612 00 Brno, e-mail: xckalina@fch.vutbr.cz<br />
Abstract<br />
The aim of this work is the study of interactions between the humic acids and<br />
copper(II) in diffusion experiments. The diffusion experiments were combined with<br />
selective extractions of the diffused copper(II) ions. The results showed that the<br />
diffused ions are in humic gel presented in more forms according to the bond strength<br />
towards humic acids. Their distributions into the individual fractions developed in<br />
time and were stabilized.<br />
1. INTRODUCTION<br />
Humic acids (HA) are natural organic compounds, which can be found in soils,<br />
waters, sediments and coal. In previous works 0, 0, 0 easy diffusion experiments in<br />
humic hydrogels were described as a suitable approach for the study of reactivity of<br />
humic acids. Metals in nature may exist in different chemical forms and can be<br />
bonded on various matrices with different bond strength. For the determination of<br />
the individual ion fractions the application of selective extractions of the metals seems<br />
to be suitable. The aim of this work is the deeper exploration of the interactions<br />
between the HA and metals.<br />
2. EXPERIMENT<br />
The isolation of humic acids from South-Moravian lignite and preparation of<br />
humic hydrogel is listed elsewhere 0, 00. For the diffusion experiments prepared<br />
humic hydrogel was packed into the cylindrical glass tubes (length 3 cm, diameter<br />
1 cm). These tubes were sunk into the diffusion solution of 0.05M CuCl2. The chosen<br />
method for the diffusion experiments was the non-stationary diffusion from the<br />
solution with time variable concentration 0, 0. After passing the defined time of the<br />
diffusion experiments (1, 3, 5, 7, 9, 11, 14 and 20 days) humic gels were sliced and<br />
each slice was separately extracted with the leaching solutions. All slices originating<br />
from the gel of the same glass tube were leached with the same extraction solution.<br />
The used leaching solutions were water, 1M MgCl2 and 1M HCl 0. All prepared<br />
extracts were after diluting measured by the means of electrochemical analyzer<br />
EcaFlow 150 GLP. From obtained data the concentration profiles of copper(II) ions<br />
in the tubes and diffusion fluxes were calculated. These diffusion fluxes were<br />
- 158 -
XI. Workshop of Physical Chemists and Electrochemists´11 Brno<br />
compared to the diffusion fluxes calculated from decrease of the concentration of<br />
cupric ions in diffusion solution.<br />
3. RESULTS AND DISCUSSION<br />
Fig. 1 a) presents the concentration profiles of copper(II) ions in humic hydrogel<br />
for three fractions of diffused ions, which corresponds to three used leaching<br />
solutions. The concentration profiles have the same symmetrical shape with the<br />
minimum in the middle. The highest concentrations of cupric ions were obtained by<br />
extraction with 1M HCl, on the other side the lowest with water. The concentration<br />
profile for 1M MgCl2 lies between these two extremes.<br />
a) b)<br />
concentration of copper(II) ions<br />
(mol dm -3 )<br />
0,06<br />
0,05<br />
0,04<br />
0,03<br />
0,02<br />
0,01<br />
0,00<br />
0 5 10 15 20 25 30<br />
distance from interface gel/solution (mm)<br />
- 159 -<br />
diffusion flux (mol.m –2 )<br />
1,00<br />
0,80<br />
0,60<br />
0,40<br />
0,20<br />
0,00<br />
.<br />
water 1 M MgCl2 1 M HCl<br />
Fig.1 a) Concentration profiles of diffused ions extracted by water (black cirles), 1M<br />
MgCl2 (grey circles), 1M HCl (white circles), b) calculated diffusion fluxes of<br />
used fractions of diffused ions (colour identification of fractions is same as<br />
previous)<br />
It is assumed that water can leach out only free mobile fraction of diffused ions,<br />
1M MgCl2 can extract previous plus ion-exchangeable fraction and 1M HCl extracts<br />
all diffused ions 0. Fig. 1b) represents the comparison of diffusion<br />
fluxes of three above mentioned fractions of diffused ions. The fluxes are<br />
increasing in order water, 1M MgCl2, 1M HCl. The both data in Fig.1 a) and b) are for<br />
the duration of the diffusion 1 day. The concentration profiles and the diffusion fluxes<br />
for other duration of diffusion experiments show similar results. The differences can<br />
be found only in the shape of the profiles. With increasing duration of diffusions the<br />
profiles become more constant, from the duration 9 day the profiles were straight.
XI. Workshop of Physical Chemists and Electrochemists´11 Brno<br />
diffusion flux (mol.m –2 )<br />
1,4<br />
1,2<br />
1,0<br />
0,8<br />
0,6<br />
0,4<br />
0,2<br />
0,0<br />
0 5 10 15 20 25<br />
square root of time (hour 0,5 )<br />
Fig.2 Diffusion fluxes in dependence on square root of duration of the diffusions for<br />
ions extracted by water (black cirles), 1M MgCl2 (grey circles), 1M HCl (white<br />
circles) and calculated from decrease of concentrations in diffusion solutions<br />
(black triangles)<br />
According to the mathematical apparatus 0, 0 6the dependence of diffusion flux<br />
on the square root of time was constructed (Fig. 2). These results confirm that water<br />
extracts the least amounts of diffused ions – only the mobile fractions. 1M MgCl2 has<br />
higher affinity to cupric ions. It extracts higher amounts of diffused ions, which<br />
corresponds to mobile plus ion-exchangeable fractions. The highest affinity has 1M<br />
HCl, which leach out previous plus strongly bonded and residual fractions of diffused<br />
ions. The comparison of diffusion flux of fraction extracted with 1M HCl and the<br />
diffusion flux calculated from decrease of the concentration of cupric ions in diffusion<br />
solution shows that 1M HCl extracts at used concentrations all diffused ions.<br />
Simultaneously, the results of Fig. 2 show, that the dependence of diffusion fluxes on<br />
square root of time for extraction with water corresponds to the changes of diffusion<br />
flux for mobile fractions of ions during the experiments. The difference between the<br />
dependences for extraction with 1M MgCl2 and water corresponds to changes of<br />
diffusion flux of ion-exchangeable fraction of cupric ions and the difference between<br />
the dependences for 1M HCl and 1M MgCl2 corresponds to the changes<br />
of the diffusion flux of the strongly bonded and residual fraction of diffused cupric<br />
ions. The results also show the constant distribution of cupric ions between the three<br />
fractions, after passing a certain time. It indicates equilibrium between the fractions,<br />
which is created and then maintained during the experiments.<br />
4. CONCLUSION<br />
The combination of the diffusion experiments with the selective extraction of<br />
diffused ions showed to be suitable for the study of interactions, which take place<br />
between humic matrices and metals in diffusion experiments. The diffused ions were<br />
divided according to the bond strength towards humic acids. The results indicate that<br />
after passing a certain time the distribution between the fractions becomes constant.<br />
- 160 -
XI. Workshop of Physical Chemists and Electrochemists´11 Brno<br />
5. ACKNOWLEDGMENT<br />
This work was supported by the project “Centre for Materials Research at FCH<br />
BUT” No. CZ.1.05/2.1.00/01.0012 from ERDF.<br />
6. REFERENCES<br />
[1] Sedláček, P., Klučákova. M.: Geoderma, 153 (2009), 1–2, 286 – 292<br />
[2] Sedláček, P., Klučáková, M.: Collect. Czech. Chem. C., 74 (2009), 9, 1323 – 1340<br />
[3] Klučáková, M. Pekař M. Colloid Surface A, 349 (2009), 1-3, 96-101<br />
[4] Klučáková, M.: CHEMagazín, 3 (2004), 14, 9<br />
[5] Cranck, J. The Mathematics od Diffusion, 2 nd ed., Oxford: Claredon Press 1975<br />
[6] Tessier, A. et al.: Analytical Chemistry 51 (1979) 844<br />
- 161 -
XI. Workshop of Physical Chemists and Electrochemists´11 Brno<br />
MONITORING OF STRESS MARKERS IN<br />
MAIZE (ZEA MAYS L.) EXPOSED TO<br />
CADMIUM AND ZINC IONS<br />
Andrea KLECKEROVÁ 1 , Olga KRYŠTOFOVÁ 1 , Pavlína ŠOBROVÁ 1 , Natalia<br />
CERNEI 1 , David HYNEK 1 , Vojtěch ADAM 1 , René KIZEK 1 ,<br />
1 Department of Chemistry and Biochemistry, Faculty of Agronomy, Mendel University in Brno,<br />
Zemědělská 1, Brno, Czech Republic<br />
Abstract<br />
Heavy metals are classified as priority pollutants monitored in environments. Heavy<br />
metals are not biodegradable, having ability to accumulate in organisms. Cadmium is<br />
one of the most toxic heavy metal ions in the environment due to its high mobility<br />
and severe toxicity to the organisms. Zinc is an essential micronutrient for plants but<br />
can be highly toxic when present at excessive concentration. We aimed at<br />
investigation of detoxification mechanisms of maize plants (Zea mays L.) treated with<br />
the following combinations of zinc(II) and cadmium(II) ions 0 M Zn 2+ + 0 M Cd 2+ ;<br />
100 M Zn 2+ + 0 M Cd 2+ ; 0 M Zn 2+ + 100 M Cd 2+ ; 10 M Zn 2+ + 100 M Cd 2+ ; 50 M<br />
Zn 2+ + 100 M Cd 2+ ; 75 M Zn 2+ + 100 M Cd 2+ and 100 M Zn 2+ + 100 M Cd 2+ for 10<br />
days. Based on fresh weight of plants we observed the all treated experimental groups<br />
had decrease production of both aboveground biomass and root parts compared with<br />
control. In addition to growth parameters, we electrochemically determined the metal<br />
content in plants.<br />
1. INTRODUCTION<br />
Cadmium is one of the most toxic heavy metal in the environment due to its<br />
high mobility and severe toxicity to the organisms [1, 2]. Zinc is an essential<br />
micronutrient for plants but can be highly toxic when present at excessive<br />
concentration. Anthropogenic inputs of Cd and Zn to soils occur via short or longrange<br />
of mining, atmospheric depositions, and use of fertilizers/manures, municipal<br />
sewage-wastes, compost and industrial sludge. Cadmium and zinc are elements having<br />
similar geochemical and environmental properties. Zinc ores normally contain 0.1–<br />
5% of Cd, and the processing and subsequent release of Zn to the environment is<br />
normally accompanied by Cd [3].<br />
Symptoms of phytotoxicity were reflected in concentrations much lower than<br />
that of other toxic metals. The most frequently reported symptoms of Cd toxicity<br />
include browning of root hairs and root tips of plants, reddish-brown tint, reddishbrown<br />
necrosis on young leaves and especially reduction of growth [4, 5]. Zinc plays<br />
an important role in the metabolism of plants, because they contribute to the<br />
activation of many enzymes and provides a link between enzyme and substrate.<br />
- 162 -
XI. Workshop of Physical Chemists and Electrochemists´11 Brno<br />
However, the surplus will limit plant growth, especially roots, turgor decrease and<br />
toxicity are similar chlorosis [6].<br />
The association of cadmium and zinc in the environment and their chemical<br />
similarity can lead to interactions between these two ions, resulting in the lowering of<br />
cadmium toxicity. Cadmium is a non-essential ion and it is toxic at a lower<br />
concentration than zinc. Consequently, the uptake and translocation of zinc by plants<br />
is higher than that of cadmium. This antagonistic effect is due to the smaller ionic<br />
radius of Zn 2+ than the Cd 2+ [3, 4, 7].<br />
Phytoremediation, i.e. the use of green plants to remove pollutants from the<br />
environment or to render them harmless has been proposed as an environment<br />
friendly and cost-effective technique for soil and water remediation. In case of heavy<br />
metal contaminated soil, the biological process of phytoextraction includes metal<br />
mobilization as well as acquisition and transport. Root system is the main interface of<br />
ion exchange between plants and their environment, thus in each process roots play a<br />
central role [8]. Excessive metal has marked effects on root growth of plants; however,<br />
there is less knowledge about the root morphological changes in hyperaccumulators<br />
after exposure to heavy metal stress. Various previous studies were limited to toxic<br />
effects of metal on the shoot with less attention to root system, and the data about<br />
toxic effects of heavy metal on hyperaccumulator roots were mostly limited to root<br />
biomass. Studies on the interactions between heavy metal conducted have been<br />
focused so far on the conventional plant species, little information is available about<br />
the interactions in the hyperaccumulator, especially on root morphological changes.<br />
In hyperaccumulators, root length determines the capacity to acquire water and<br />
nutrients, and therefore metal uptake capacity is more strongly related to root length<br />
than root weight. When looking at phytoextraction, not only quantitative root<br />
parameters (biomass) should be considered but qualitative root characteristics may<br />
also be looked into. Root length, surface area, length–diameter distribution and<br />
volume could serve as valuable parameters when describing and comparing root<br />
systems [9].<br />
2. EXPERIMENT<br />
PLANT CULTIVATION<br />
Maize (Zea mays L.) CE 220 (hybrid) was used in our experiment. Five-day<br />
seedlings were placed in hydroponic culture vessels, which were available for seven<br />
days filled with Richter’s nutrient solution. After seven days, the contents of the<br />
containers were exchanged for a solution of zinc and cadmium with these<br />
concentrations: 0 μM Zn 2+ + 0 μM Cd 2+ ; 100 μM Zn 2+ + 0 μM Cd 2+ ; 0 μM Zn 2+ + 100 μM<br />
Cd 2+ ; 10 μM Zn 2+ + 100 μM Cd 2+ ; 50 μM Zn 2+ + 100 μM Cd 2+ ; 75 μM Zn 2+ + 100 μM Cd 2+<br />
and 100 μM Zn 2+ + 100 μM Cd 2+ . For the preparation of chemical solutions of the<br />
metal ions, Zn(NO3)2 and Cd(NO3)2 were used (Sigma-Aldrich, USA). The experiment<br />
was conducted for 10 days under constant conditions (temperature 20°C, humidity<br />
65%, 12h light). Five plants were harvested from each experimental variant.<br />
Harvested plants were rinsed in distilled water, and then were divided into above-<br />
- 163 -
XI. Workshhop<br />
of Physical l Chemists and Electrochemists<br />
E<br />
s´11<br />
groundd<br />
part and rroots.<br />
The fresh f weighht<br />
of the sa amples was s measuredd<br />
on a Sarto orius<br />
scale immmediatelyy<br />
after rinsin ng.<br />
ELECTR<br />
E<br />
(EcoCh<br />
three e<br />
with w<br />
1 KCl) a<br />
(EcoCh<br />
mol/l-1 ROCHEMICCAL<br />
DETERMINATIONN<br />
OF CADM<br />
lectrochemmical<br />
meas surements were per<br />
hemie, Nethherland)<br />
with w VA-Staand<br />
663 (M<br />
lectrode syystem,<br />
whic ch consisteed<br />
of hangin<br />
working elecctrode<br />
surfa ace 0.4 mmm<br />
as referencee<br />
electrode e and platin<br />
hemie, Nethherland)<br />
wa as used for<br />
CH3COOHH<br />
+ CH3CO OONa) was<br />
corn keernels<br />
weree<br />
deoxygen nated by arg<br />
cadmiuum<br />
was mmeasured<br />
using u diffe<br />
(DPASVV).<br />
Anodicc<br />
scan was started at<br />
accumuulated<br />
on tthe<br />
HMDE E potential<br />
temperrature.<br />
The solution was w mixed<br />
importaant<br />
methodd<br />
parameters<br />
were: m<br />
modulaation<br />
amplittude<br />
49.5 mV. m<br />
2 MIUM<br />
rformed on o the deevice<br />
Aut<br />
Metrohm, Switzerland S d). It was u<br />
ng mercury y drop elecctrode<br />
(HM<br />
, silver-ch hloride elect trode (Ag / AgCl / 3 m<br />
num wire as<br />
auxiliary electrode. GPES softw<br />
processing raw data. Acetate A bufffer<br />
pH 3.6<br />
used as the<br />
supportin ng electrolyyte.<br />
Sample<br />
gon (99.999 9%) for 120<br />
s. The cooncentratio<br />
erential pu ulse anodic c strippingg<br />
voltamm<br />
-0.7 V and<br />
stopped at -0.4 V. Cadmium<br />
at 0.7 V with w a 120 s accumul ulation at r<br />
during exc cretion (145 50 rev minn<br />
odulations time 0.02 s, step pote<br />
-1 tolab<br />
used<br />
MDE)<br />
mol.l<br />
). Other u<br />
ential 1.05<br />
-<br />
ware<br />
(0.2<br />
es of<br />
on of<br />
metry<br />
was<br />
oom<br />
used<br />
mV,<br />
3. RRESULTS<br />
AND DIS SCUSSIONN<br />
In our studdy,<br />
we stud died the inffluence<br />
of different d co oncentratioons<br />
of cadm mium<br />
and zinnc<br />
ions on thhe<br />
growth of maize.<br />
m ( (g FW)<br />
days<br />
0 ZZn<br />
0<br />
Cd<br />
0 ZZn<br />
1000<br />
Cd<br />
Fig. 1a.<br />
Fi<br />
part an<br />
concen<br />
Cd2+ Growth cu<br />
irstly, we s<br />
nd roots of<br />
ntrations 0 μ<br />
; 100<br />
μM Zn<br />
and 10<br />
observe<br />
abovegr<br />
signific<br />
2+ +<br />
0 μM Zn2+ urve – above<br />
studied the<br />
maize. Ma<br />
μM Zn<br />
ed the all<br />
round biom<br />
cant growth<br />
2+ eground pa<br />
e influence<br />
aize (Zea m<br />
+ 0 μM Cd<br />
+ 100 μM C<br />
+ + 100 μM<br />
treated e<br />
mass and ro<br />
h inhibitio<br />
2+ ;<br />
Cd2+ ; 50 μM<br />
M Cd2+ arts Fig.<br />
e of metal i<br />
mays L.) we<br />
100 μM Zn<br />
Zn<br />
for<br />
experimenta<br />
oot parts c<br />
on was obs<br />
2+ 1b.Growth<br />
ions on the<br />
re exposed<br />
n<br />
+ 100<br />
10 days. B<br />
al groups<br />
compared w<br />
served in g<br />
2+ + 0 μM<br />
0 μM Cd2+ h curve – ro<br />
e fresh wei<br />
d to Cd<br />
; 7<br />
Based on fr<br />
had decre<br />
with contro<br />
groups in w<br />
2+ an<br />
Cd2+ ; 0 μM<br />
75 μM Zn2+ oots<br />
ight of gro<br />
nd Zn<br />
resh weigh<br />
ease produ<br />
ol (Fig. 1 a<br />
which we<br />
2+ ion<br />
Zn2+ ound<br />
ns in<br />
+ 100 0 μM<br />
+ + 100 μM Cd<br />
ht of plants<br />
uction of b<br />
a, b). The m<br />
combined<br />
2+<br />
s we<br />
both<br />
most<br />
the<br />
- 164 -<br />
Brno
XI. Workshop of Physical Chemists and Electrochemists´11 Brno<br />
highest concentrations of Zn 2+ and Cd 2+ ions. At these plants were also observed<br />
procumbention of plants and chlorosis.<br />
In addition to growth parameters, we electrochemically determined the metal<br />
content in plants. It was found that content of both metal ions enhanced in<br />
aboveground parts and in roots during the experiment (Fig. 2a - d).<br />
ng/g DW<br />
ng/g DW<br />
2a<br />
350<br />
300<br />
250<br />
200<br />
150<br />
100<br />
50<br />
140<br />
120<br />
100<br />
80<br />
60<br />
40<br />
20<br />
0<br />
0<br />
0Zn<br />
0Cd<br />
0Zn<br />
0Cd<br />
0Zn<br />
100Cd<br />
0Zn<br />
100Cd<br />
2. day 10. day<br />
100Zn<br />
0Cd<br />
10Zn<br />
100Cd<br />
50Zn<br />
100Cd<br />
Applied concentration (M)<br />
100Zn<br />
0Cd<br />
2. day 10. day<br />
10Zn<br />
100Cd<br />
50Zn<br />
100Cd<br />
Applied concentration (M)<br />
75Zn<br />
100Cd<br />
75Zn<br />
100Cd<br />
100Zn<br />
100Cd<br />
Fig 2a, b. Zinc content in the aboveground parts (a) and roots (b) of maize plants in<br />
the 2 nd and 10 th day of cultivation<br />
100Zn<br />
100Cd<br />
- 165 -<br />
ng/g DW<br />
700<br />
600<br />
500<br />
400<br />
300<br />
200<br />
100<br />
0<br />
0Zn<br />
0Cd<br />
0Zn<br />
100Cd<br />
100Zn<br />
0Cd<br />
2. day 10. day<br />
10Zn<br />
100Cd<br />
50Zn<br />
100Cd<br />
Applied concentration (M)<br />
75Zn<br />
100Cd<br />
Fig 2c, d. Cadmium content in the aboveground parts (c) and roots (d) of maize plants<br />
in the 2 nd and 10 th day of cultivation<br />
ng/g DW<br />
1400<br />
1200<br />
1000<br />
2b<br />
800<br />
600<br />
400<br />
200<br />
0<br />
0Zn<br />
0Cd<br />
0Zn<br />
100Cd<br />
100Zn<br />
0Cd<br />
2. day 10. day<br />
10Zn<br />
100Cd<br />
50Zn<br />
100Cd<br />
Applied concentration (M)<br />
75Zn<br />
100Cd<br />
100Zn<br />
100Cd<br />
100Zn<br />
100Cd
XI. Workshop of Physical Chemists and Electrochemists´11 Brno<br />
As we can see in Fig. 2 a - d, plants accumulated more Zn 2+ than Cd 2+ , which as<br />
the essential element it isacceptable for them. We also determined a higher<br />
concentration of metal ions in root sections which shows on the fact that roots are the<br />
first plant tissue, which is in close contact with heavy metal ions.<br />
It was found that the group treated with 100 M Zn 2+ + 0 M Cd 2+ took less Zn in<br />
the second collection day on average 0.8 - 6 times and in the tenth day of collection<br />
0.1 - 1.1 times in aboveground parts and in the second day of sampling averaged 0.3 -<br />
4.8 times and in the tenth day of collection 0.7 - 2.2 times the root sections (Fig. 2a,<br />
b). In the case of Cd it was found that the groups treated with a combination of Zn<br />
and Cd had enhancing concentration of Cd with increasing concentrations of Zn in<br />
aboveground parts (Fig. 2c) in the second and tenth day of collection and root parts of<br />
the tenth day of sampling (Fig. 2d). An interesting finding in the experiment was that<br />
the presence of Zn in the culture solution increases the intake of Cd maize plants.<br />
Based on the comparison of results obtained from the second and tenth day of<br />
the experiment it can be concluded that despite the growth inhibition caused by<br />
metals, accumulation of Zn and Cd occurs in the aboveground parts and in roots.<br />
4. CONCLUSION<br />
The increasing amount of pollutants of various kinds and origin,<br />
environmental organisms leads to the activation of detoxification mechanisms.<br />
Learning how to adapt to different types of pollution is a very important task of<br />
modern analytical chemistry, biochemistry and molecular biology.<br />
Total inhibition of growth of maize plants was probably due to the activation of<br />
defensive reactions, preferably plant protection compounds synthesized, instead of the<br />
biosynthesis of substances necessary for growth. Furthermore, we can conclude that<br />
the inhibition of root part is probably associated with the intake of cadmium root<br />
system. In the plant, the content of metal ions was increasing with increasing time of<br />
cultivation. An interesting finding in the experiment was that the presence of Zn in<br />
the culture solution increases the intake of Cd by maize plants.<br />
5. ACKNOWLEDGEMENT<br />
This work was supported by grant IGA AF MENDELU TP 7/2011.<br />
6. REFERENCES<br />
[1] Das, P., S. Samantaray, and G.R. Rout, Studies on cadmium toxicity in plants: A review.<br />
Environmental Pollution, 1997. 98(1): p. 29-36.<br />
[2] Matusik, J., T. Bajda, and M. Manecki, Immobilization of aqueous cadmium by addition of<br />
phosphates. Journal of Hazardous Materials, 2008. 152(3): p. 1332-1339.<br />
[3] Chakravarty, B. and S. Srivastava, Effect of cadmium and zinc interaction on metal uptake and<br />
regeneration of tolerant plants in linseed. Agriculture Ecosystems & Environment, 1997. 61(1):<br />
p. 45-50.<br />
[4] Gabbrielli, R. and L.S. di Toppi, Response to cadmium in higher plants. Environmental and<br />
Experimental Botany, 1999. 41(2): p. 105-130.<br />
[5] Adriano, D.C., Trace elements in terrestrial environments: Biogeochemistry, bioavailability, and<br />
risks of metals. 2001, New York: Springer-Verlag.<br />
- 166 -
XI. Workshop of Physical Chemists and Electrochemists´11 Brno<br />
[6] Pandey, N., et al., Enzymic changes in response to zinc nutrition. Journal of Plant Physiology,<br />
2002. 159(10): p. 1151-1153.<br />
[7] Shrivastava, G.K. and V.P. Singh, Uptake accumulation and translocation of cadmium and zinc<br />
in Abelmoschus esculentus L. Moench. Plant Physiol. Biochem, 1989. 16: p. 17-22.<br />
[8] Marschner, H., Mineral Nutrition of Higher Plants. second ed. 1995, London: Academic Press.<br />
[9] Li, T.Q., et al., Effects of zinc and cadmium interactions on root morphology and metal<br />
translocation in a hyperaccumulating species under hydroponic conditions. Journal of Hazardous<br />
Materials, 2009. 169(1-3): p. 734-741.<br />
- 167 -
XI. Workshop of Physical Chemists and Electrochemists´11 Brno<br />
SYNDROM OF NEWLY FILLED RESERVOIR<br />
FROM THE MERCURY POINT OF VIEW<br />
Kamila KRUŽÍKOVÁ 1 , Renata KENSOVÁ 1 , Lenka GAJDOVÁ 1 , Zdeňka<br />
SVOBODOVÁ 1 .<br />
1 University of Veterinary and Pharmaceutical Sciences, Faculty of Veterinary Hygiene and Ecology,<br />
Department of Veterinary Public Health and Toxicology<br />
Abstract<br />
Želivka is a typical canyon-shaped reservoir. After imundation, unexpectedly high<br />
level of mercury was found in fish from Želivka. That is why the long-term<br />
monitoring of mercury contamination by some of most frequent kind of fish started.<br />
Monitoring is in progress from 1974. After flooding, there are a good and available<br />
conditions for microbial convertion (because of anoxic condition and decay of organic<br />
matter) of inorganic Hg to organic mercury which is accumulate into food chain. In<br />
the first years, the mercury level is high and then is gradually decline. It pointed to<br />
that mercury level in fish tissues is stabilized and do not exceed hygienic limit set by<br />
European Union.<br />
1. INTRODUCTION<br />
The accumulation of mercury in the fish tissues found in recently impounded<br />
reservoirs has been known for forty years (Brinkmann and Rasmussen, 2010). Because<br />
of the risks to human consumers of these fish, it is important to determine how long<br />
after impoundment this will continue to occur. In the manmade reservoir for drinking<br />
water, Želivka (Czech Republic), built from 1970 to 1974, the systematic investigation<br />
of bioaccumulation of mercury in fish from 1974 to 1997 and in 2009 was performed.<br />
2. EXPERIMENT<br />
In the Želivka reservoir, the main fish predator species were sampled and<br />
mercury concentration in the fish muscle and liver were analyzed using method of<br />
cold vapor atomic absorption spectrometry (AMA 254 analyzer). The data for Esox<br />
lucius, Perca fluviatilis, Sander lucioperca and Aspius aspius were evaluated. Muscle<br />
and liver of fish were analyzed.<br />
3. RESULTS AND DISCUSSION<br />
In the period 1974–1988 have been founded a quite high value (about 1 mg/kg)<br />
of mercury content in fish tissues. Although there is not any source of mercury<br />
contamination in the Želivka reservoir, about 55% of analyzed sampled (predatory<br />
species) exceeded 0.6 mg/kg. An expressive reduction have been found after twenty<br />
years and in 2009 following mercury content in fish tissues was determined most for<br />
Aspius aspius 0,197 mg/kg in the muscle. The hypothesis has been pronounced that in<br />
the newly filled reservoir are suitable physico-chemical and biological conditions for<br />
- 168 -
XI. WWorkshop<br />
of Phyysical<br />
Chemists and Electrocheemists´11<br />
change<br />
of anoorganic<br />
me ercury to oorganic<br />
mer rcury and their ingreession<br />
to the<br />
food<br />
chain.<br />
Mercuryy<br />
levels in fish tissues are establish<br />
in time.<br />
The resuults<br />
of merc cury contennt<br />
in the predator p fish<br />
(perch, aasp,<br />
pikeperch<br />
and<br />
pikee)<br />
muscle and liver r are shoow<br />
in Gra aph 1. Af fter floodiing,<br />
the mercury m<br />
conntaminationn<br />
was for up p to 5timess<br />
higher tha an hygienic c limit is (00.5<br />
mg/kg). As time<br />
go oon<br />
(11 yearrs<br />
after), mercury m conntamination<br />
n was decli ine to levell<br />
about 0.2 mg/kg)<br />
andd<br />
stood dowwn.<br />
It pointe ed to that mmercury<br />
lev vel in fish tissues<br />
is staabilized<br />
and d do not<br />
exceeed<br />
hygiennic<br />
limit set by European<br />
Union.<br />
Fig. . 1 Mercuryy<br />
and methy ylmercury content in perch and asp.<br />
Fig. . 2 Mercuryy<br />
and methy ylmercury content in pike perch h and pike.<br />
- 169 -<br />
Brno
XI. Workshop of Physical Chemists and Electrochemists´11 Brno<br />
4. CONCLUSION<br />
Very high level of mercury contamination was found in the muscle and liver of<br />
the sampled fish in spite of any mercury source (like chemic factory). After flooding,<br />
there are a good and available conditions for microbial convertion (because of anoxic<br />
condition and decay of organic matter) of inorganic Hg to organic mercury which is<br />
accumulate into food chain. In the first years, the mercury level is high and then is<br />
gradually decline. Our results are agreeable with data from literature.<br />
5. AKNOWLEDGEMENT<br />
The work has been supported by project MSM 6215712402<br />
6. REFERENCES<br />
[1] Brinkmann, L., Rasmussen, J.B.: High levels of mercury in biota of a new Prairie irrigation<br />
reservoir with a simplified food web in Southen Alberta, Canada. Hydrobiologia, 64 (2010), 11-<br />
22.<br />
- 170 -
XI. Workshop of Physical Chemists and Electrochemists´11 Brno<br />
UTILIZATION OF TOTAL ANTIOXIDANT<br />
CAPACITY TO EVALUATE THE EFFECT OF<br />
MULTIWALL CARBON NANOTUBES AND<br />
MAGNETIC NANOPARTICLES ON<br />
SUSPENSION TOBACCO CULTURE<br />
Sona KRÍŽKOVA 1 , Olga KRYŠTOFOVÁ 1 , Zuzana HRDINOVÁ 1 , Jiří SOCHOR 1 , Libor<br />
VYSLOUŽIL 2 , Ondřej JASEK 2 , Vít KUDRLE 2 , Vojtěch ADAM 1 , René KIZEK 1<br />
1 Department of Chemistry and Biochemistry, Mendel University in Brno, Zemedelska 1, CZ-613 00<br />
Brno, Czech Republic<br />
2 Department of Physical Electronics, Faculty of Science, Masaryk University, Kotlarska 2, CZ-611 37<br />
Brno, Czech Republic<br />
Abstract<br />
Nanotechnology and nanoscience are new areas of research and human cognition.<br />
The effects of nanomaterials on humans and the environment are still poorly<br />
understood. Because of their much larger surface there is a possibility to occur toxic<br />
effects unknown in “normal” materials.<br />
The aim of this work was to use the set of the methods for antioxidants capacity<br />
determination to compare the effect of multiwall carbon nanotubes (MWCNTs) and<br />
magnetic microparticles (MNPs) in concentrations 0, 1 and 10 μg/ml on suspension<br />
tobacco culture. After 7-day cultivation, compared to controls, the weight of the cells<br />
exposed to 10μg/ml MWCNTs was 3× higher. MNPs did not influence the cells<br />
growth, but they induced free radicals and synthesis of antioxidative compounds,<br />
especially thiols. In cells exposed to MNPs the total antioxidant capacity was 30 %<br />
increased compared to controls, in cells exposed to MWCNTs a slight decrease was<br />
observed. This indicates possible changes in whole plants metabolism.<br />
1. INTRODUCTION<br />
Due to the increasing utilization of nanoparticles and nanomaterials it is<br />
necessary to obtain data about their influence of living organisms. According to actual<br />
knowledge, commonly used tests of toxicity provide misleading information.<br />
Therefore new methods to evaluate the toxicity of nanomaterials and nanoparticles<br />
are necessary.<br />
Nanoparticles can be released into soil, air or ground waters. Then they can be<br />
either degraded, biotransformed or accumulated in the organisms and consequently<br />
along the food chain [1]. Plants are involved in all abovementioned events and<br />
moreover they are potential producers of nanoparticles [2]. Nanotechnology can be<br />
applied also in production of fertilizers.<br />
- 171 -
XI. Workshop of Physical Chemists and Electrochemists´11 Brno<br />
It is known, that nanoparticles have an effect on plants. Their action is<br />
dependent on the material, shape and size of the nanoparticles. The same type of the<br />
nanoparticles can have an adverse effect of different plant species.<br />
Oxidation stress is one of the possible effects of the nanoparticles both in<br />
animals and plants. Determination of total antioxidant capacity is a relatively cheap<br />
and non time-consuming method of toxicity evaluation. Using of suspension plant<br />
cultures is an alternative to the long-term whole-plant experiments.<br />
The aim of this work was to use the set of the methods for antioxidants capacity<br />
determination to compare the effect of multiwall carbon nanotubes (MWCNTs) and<br />
magnetic microparticles (MNPs) on suspension tobacco culture.<br />
2. EXPERIMENT<br />
Tobacco cells in suspension culture were cultivated in Murashige-Skoog<br />
medium with concentration of 0, 1 and 10 μg/ml MWCNTS (diameter 50 nm) or<br />
MNPs (40% / 60% (magnetid Fe3O4/magnetid gama Fe2O3) for 7 days in 25°C with<br />
shaking. After the cultivation the cells were peleted and stored in -80°C. For analysis<br />
0.1 g of the pellet was used. The sample was disintegrated in liquid nitrogen using the<br />
semiautomatic homogenizer Schuett homgenplus (Schuett-biotec, Germany) and<br />
resuspended in 0.1 M phosphate buffer pH = 7.5. After the disintegration the sample<br />
was vortexed for 30 min and centrifuged (16000 RPM, 30 min). The supernatant was<br />
then used for all following analyses: total protein determination by pyrrogal red,<br />
activity of glutathione-S transferase, total thiol compounds determination by Ellman’s<br />
method, DPPH, ABTS, DPMD and Blue CrO5 test.<br />
3. RESULTS AND DISCUSSION<br />
After the 7-day cultivation the cells were peleted and weighed. The growth<br />
curve was plotted from weight of the pellet and NPs concentrations. The growth of<br />
the cells exposed to MWCNTS was stimulated markedly. Compared to controls the<br />
weight of the cells exposed to 1 μg/ml MWCNTS the weight of the cells was 2 ×<br />
higher and the weight of the cells exposed to 10μg/ml MWCNTS was 3× higher. At<br />
MNPs no influence on the cells growth was observed.<br />
In the cells the activity of the enzyme glutathione-S transferase was determined.<br />
This enzyme is involved in conjugation reaction in pollutants and ROS detoxication.<br />
This enzyme was markedly inhibited in cells exposed to MWCNTs, while in cells<br />
exposed to MNPs the activity of this enzyme was stimulated. Total thiol content,<br />
which is connected to the activity of GST was consistent with this observation, e. g. at<br />
carbon nanoparticels the content of total thiols was decreased and in ferric<br />
nanoparticles the total thiols content was increased.<br />
The total antioxidant capacity in cells exposed to ferric MNPs was 30 %<br />
increased and in cells exposed to carbon nanoparticles a slight decrease was observed.<br />
- 172 -
XI. Workshop of Physical Chemists and Electrochemists´11 Brno<br />
Total antioxinant activity [% of<br />
control]<br />
160<br />
140<br />
120<br />
100<br />
80<br />
60<br />
40<br />
20<br />
0<br />
MWCNTs MNPs<br />
0 1 10<br />
Concentration of nanoparticles [μg/ml]<br />
Fig.1 Comparison of total antioxidant activity in tobacco cells exposed to MWCNTs<br />
and MNPs<br />
Those data are consistent with previous results [3]. It is known, that both<br />
MWCNTs [4] and MNPs [5] induce free radicals. In cells exposed to MNPs the total<br />
antioxidant capacity was 30 % increased compared to controls, in cells exposed to<br />
MWCNTs a gradual decrease in total antioxidant capacity was observed.<br />
4. CONCLUSION<br />
From the obtained results flows, that the both MWCNTs and MNPs have a toxic<br />
effect on tobacco, but the mechanisms of the toxicity are different. After the<br />
exposition to MWCNTs the growth and metabolism of the cells was stimulated<br />
markedly, but detoxication pathways were inhibited. MNPs did not influence the cells<br />
growth, but they induced free radicals and synthesis of antioxidative compounds,<br />
especially thiols. The activity of glutathione-S transferase was also increased. This<br />
indicates possible changes in whole plants metabolism.<br />
5. ACKNOWLEDGEMENT<br />
The work has been supported by grant NanoBioTECell GA ČR P102/11/1068,<br />
MSM0021622411.<br />
6. REFERENCES<br />
[1] Navarro, E., Baun, A., Behra, R., et al.: Ecotoxicology 17 (2008), 5, 372-386<br />
[2] Thakkar, K.N., Mhatre, S.S., Parikh, R.Y.: Nanomedicine-nanotechnology biology and medicine,<br />
6 (2010), 2. 257-262<br />
[3] Xingmao, M.G-L., Yang Deng, C. Kolmakov, A.: Science of the total environment 408 (2010), 16,<br />
3053-3061<br />
[4] Tan, X., Lin, C., Fugetsu, B.: Carbon, 47 (2009), 15, 3479-3487<br />
[5] Wang, H.H.: Nanotoxicology 5 (2010), 1, 30-42<br />
- 173 -
XI. Workshop of Physical Chemists and Electrochemists´11 Brno<br />
EPR AND UV-VIS<br />
SPECTROELECTROCHEMICAL STUDIES<br />
OF NOVEL SYNTHESIZED COPPER,<br />
NICKEL AND COBALT-BASED COMPLEX<br />
DERIVATIVES<br />
Karol LUŠPAI 1 , Peter RAPTA 1 , Peter MACHATA 1 , Peter HERICH 1<br />
1 Institute of Physical Chemistry and Chemical Physics, Faculty of Chemical and Food Technology,<br />
Slovak University of Technology in Bratislava, Radlinského 9, SK-81237 Bratislava<br />
Abstract<br />
Using different spectroelectrochemical techniques the redox properties of the new<br />
dithiolate-based complex derivatives with Cu(III), Ni(III) and Co(III) as a central atom<br />
were determined. Changes in EPR and UV-VIS-NIR spectra during electrochemical<br />
reduction have been analysed. Electrochemical reversibility of studied derivatives was<br />
dependent on solvent used.<br />
1. INTRODUCTION<br />
In recent years dithiolate-based complex compounds have become interesting<br />
for research and development, because of their potential application in the role of new<br />
superconductors, pesticides, compounds with unusual magnetic properties, and biocatalysts<br />
in biochemistry [1].<br />
Some of these compounds were studied by computational methods. For example<br />
benzene-1,2-dithiolate complexes with Cu, Ni, Co were calculated by M. Breza et al..<br />
and stability of various charge and spin states was determined [2].<br />
2. EXPERIMENT<br />
Cyclovoltammetric measurements were performed using HEKA PG 284<br />
(Lambrecht, Germany) potentiostat/galvanostat using PotPulse 8.53 software package.<br />
A standard three electrode system was used. Platinum wire as working and counter<br />
electrode, and silver oxidized wire as pseudo-reference electrode was chosen.<br />
Measured potentials were recorded at 100 mV.s -1 potential rate. Concentration of<br />
sample was appx. 0.5 mM in solution of 0.2 M TBAPF6 supporting electrolyte. All<br />
samples were purged by argon, and measured under inert argon atmosphere. Because<br />
of using pseudo-reference electrode, internal standard (Fc + /Fc) was used.<br />
Spectroelectrochemical measurements were performed in spectroelectrochemical flat<br />
cell using Pt mesh as a working electrode. Pt wire served as a counter electrode and<br />
silver wire as a pseudo-reference electrode. This cell was inserted in optical EPR<br />
resonator and EPR spectra were recorded simultaneously during voltammetric cycle.<br />
Bruker EMX X-band EPR spectrometer (Bruker, Germany) and WinEPR 4.40<br />
- 174 -
XI. Workshop of Physical Chemists and Electrochemists´11 Brno<br />
software package was used. In-situ recorded UV-VIS spectra were recorded using<br />
diode-array PC2000 spectrometer (Ocean Optics, Inc.) equipped with deuteriumhalogen<br />
light source. For UV-VIS-NIR spectroelectrochemical measurements<br />
Shimadzu UV 3600 spectrophotometer was used. In this case the electrode system<br />
was immersed in 1 mm quartz cell.<br />
3. RESULTS AND DISCUSSION<br />
Electrochemical studies were performed using different solvents. Cyclic<br />
voltammetry shows one reversible or quasireversible cathodic peak associated<br />
probably with one-electron transfer for all investigated complexes. Half-wave<br />
potentials E1/2 vs. Fc + /Fc were -1.02 V for copper-, -0.95 V for nickel-, and -1.27 V for<br />
cobalt-complex. This peak is associated with electron transfer to M III central atom, and<br />
coupled with reduction to M II form.<br />
Current response (norm.)<br />
-1.4 -1.2 -1.0 -0.8 -0.6<br />
Potential / V vs. Fc + / Fc<br />
Fig. 1 Cyclic voltammograms of (MePh3P)[M(bdt)2] complexes ( M = Cu solid line; M<br />
= Ni dotted line; M = Co dashed line ) in dichloromethane<br />
Upon this reduction process UV-VIS-NIR spectra of (MePh3P)[Ni(bdt)2]<br />
complex in dimethylformamide shows a new band at 310 nm and absorbance decrease<br />
in bands at 361 and 876 nm. The existence of isosbestic point serves as an evidence,<br />
that the compound is reduced directly from an oxidized form to reduced without<br />
follow-up reactions, and it indicates also a good stability of its reduced form in<br />
dimethylformamide. However, a decrease of intensity of new bands<br />
is evident after longer time, as is shown in Fig. 2 (dark grey-solid and blacksolid).<br />
That means, the reduced form is stable, but slowly undergo the follow-up<br />
reactions also in dimethylformamide.<br />
The EPR spectra of (MePh3P)[Ni(bdt)2] complex show a broad singlet with<br />
isotropic g = 2.0089. During electrochemical reduction decrease of intensity was<br />
observed, that means, a reduced form of this complex is diamagnetic.<br />
- 175 -
XI. Workshop of Physical Chemists and Electrochemists´11 Brno<br />
0.30<br />
A<br />
0.25<br />
0.20<br />
0.15<br />
0.10<br />
0.05<br />
I EPR<br />
0.00<br />
300 400 500 600 700 800 900<br />
/ nm<br />
Fig. 2 UV-VIS-NIR spectroelectrochemistry of complex derivative (MePh3P)[Ni(bdt)2]<br />
in dimethylformamide (evolution of spectra during reduction corresponds the<br />
colour from gray-dashed to black-solid). The inset shows EPR spectrum of the<br />
sample before reduction in dimethylformamide<br />
Spectroelectrochemistry of (MePh3P)[Ni(bdt)2] complex in dichloromethane<br />
shows decrease of intensity of all of bands in electronic spectra, and no new bands are<br />
formed in observed spectral region. This indicates the low stability of its reduced form<br />
in dichloromethane.<br />
4. CONCLUSION<br />
Spectroelectrochemical investigation of dithiolate metalo-complex derivatives is<br />
presented in this work. Samples were studied both by cyclic voltammetry and EPR-<br />
UV-VIS-NIR spectroelectrochemistry. Results show that reduction of all investigated<br />
complexes is associated with the change of oxidation state of the central metal atom<br />
and stability of their reduced forms strongly dependents on solvent used.<br />
5. ACKNOWLEDGEMENT<br />
The financial support of the Slovak Grant Agency VEGA (contracts No.<br />
1/0679/11 and 1/0018/09) is gratefully acknowledged.<br />
6. REFERENCES<br />
[1] Mrkvová, K., Kameníček, J., Šindelář, Z., Kvítek L., Mrozinski J., Nahorska M., Žák Z.:<br />
Trans. Met. Chem., 29 (2003), 238<br />
[2] Šoralová, S., Breza, M., Gróf, M.: Polyhedron, 30 (2011), 307<br />
- 176 -<br />
100 G
XI. Workshop of Physical Chemists and Electrochemists´11 Brno<br />
VARIOUS MICROWAVE DIGESTION<br />
PROCEDURE OF SAMPLES FOR HEAVY<br />
METALS ELECTROCHEMICAL<br />
DETERMINATION<br />
Petr MAJZLÍK 1 , David HYNEK 1 , René KIZEK 1*<br />
1 Mendel University in Brno, Zemedelska 1, CZ-613 00 Brno, CZ (e-mail: kizek@sci.muni.cz);<br />
Abstract<br />
Electrochemical determination of heavy metals is very useful and important<br />
analytical method. Determination of these polutants is very important in environment<br />
too. Electrochemical determination of samples (dry matter) is primarily affected by<br />
sample praparation. Two ways of mineralisation (microwave digestion) first with<br />
HNO3 and second with mixture HNO3 + H2O2 are presented. Use of microwave system<br />
Multiwave 3000 for samples mineralisation is shown too.<br />
1. INTRODUCTION<br />
Electrochemical determination of heavy metals is very useful and important<br />
analytical method. Determination of these polutants is very important in environment<br />
too. Electrochemical determination of dry matter samples is primarily affected by<br />
sample praparation. Various ways of sample praparation can affect results from<br />
electrochemical determination of heavy metals. Preparation of samples by microwave<br />
digestion is very often use too. Very often there are used two basic mineralisation<br />
mixtures - HNO3 and HNO3 + H2O2.<br />
2. EXPERIMENT<br />
Mineralisation<br />
Microwave system Multiwave3000 (Anton-Paar GmbH) was used for<br />
mineralisation of samples. Two various mineralisation mixtures were used. Each of<br />
mixtures had unique composition and microwave program, see table 1 and 2.<br />
Table 1: Composition of mineralisation mixture<br />
Composition of<br />
mixture<br />
HNO3<br />
69%<br />
H202<br />
30%<br />
1 HNO3 1000µl 10mg<br />
2 HNO3 + H2O2 700µl 300µl 10mg<br />
- 177 -<br />
Ammount of sample (dry<br />
matter)
XI. Workshhop<br />
of Physical l Chemists and Electrochemists<br />
E<br />
s´11<br />
Table 22:<br />
Microwavve<br />
program m<br />
CCompositioon<br />
of<br />
mmixture<br />
1 HHNO3<br />
2 HHNO3<br />
+ H2O<br />
O2<br />
Microwavve<br />
program m<br />
power 1000W,<br />
ramp 10 min, hold<br />
99 minn,<br />
cooling 10<br />
min.<br />
power 125W,<br />
ramp p 8 min. – power 2200W,<br />
ram mp<br />
5min. – poower<br />
225W W, ramp 8 min. m – coolling<br />
10min.<br />
Fig.<br />
1: Multiwwave3000<br />
(A Anton-Paar r GmbH)<br />
10mg off<br />
sample were w put into<br />
bottle MMG5<br />
and filled f<br />
wit th 900μl cooncentrated<br />
d nitric acid<br />
(mixturee<br />
1) or mix xture<br />
HN NO3 + H2O22<br />
(mixture 2). The samples s weere<br />
placed into<br />
roto or 64MG5 and than the microw wave decoomposition<br />
was<br />
carried<br />
out. MMicrowave<br />
programs p ar re presenteed<br />
in Table 2.<br />
Electroochemical<br />
determin nation<br />
MMeasuring<br />
ssystem<br />
Met trohm was used for th he determin nation of hheavy<br />
meta als –<br />
Autosammpler<br />
813 Compact and a measuuring<br />
unit VA V Compu utrace 797. Samples were w<br />
prepareed<br />
in this mmanner:<br />
15 l of samplees<br />
were mix xed with 98 85μl of acettic<br />
buffer (p pH =<br />
5). Difeerential<br />
pullse<br />
voltamet try was useed<br />
for the measuremen<br />
m nt with theese<br />
paramet ters:<br />
pootencial<br />
of deposition -1,3V, timme<br />
of depos sition 240s, range of p<br />
1,3V too<br />
0,15V, pulse<br />
amplitu ude 0,025V, , pulse time e 0,04s, uni it step 0,00<br />
unit steep<br />
0,3s. A sstandard<br />
ce ell with thrree<br />
electrod des was use ed for the m<br />
hangingg<br />
mercury drop electr rode (HMDDE)<br />
with a drop d area of f 0.4 mm2 potencial fro om -<br />
05035V, tim me of<br />
measurmen nt. A<br />
wwas<br />
employ yed<br />
ass<br />
the workiing<br />
electrod de. An Ag/AAgCl/3M<br />
KCl K electrod de served aas<br />
the refere ence<br />
electrodde.<br />
Pt electtrode<br />
was used u as the aauxiliary<br />
el lectrode.<br />
3. RRESULTS<br />
AND DIS SCUSSIONN<br />
Comparison<br />
of two mineralisati m ion mixture es were exa amined at corn samples<br />
-<br />
roots aand<br />
stipes. These part ts of plantts<br />
were dri ied and dis ssolved in mineralisa ation<br />
mixturee<br />
1 or 2 (TTable<br />
1). Th he sampless<br />
were plac ced into rotor<br />
64MG55<br />
and than n the<br />
microwwave<br />
decommposition<br />
was w carried out. Comp parison of two t voltammograms<br />
sh hows<br />
Fig. 2. Diference between mineralisati m ion 1 and 2 is obvio ously. Proccess<br />
2 (HNO O3 +<br />
H2O2) hhas<br />
better resolution<br />
of o peaks andd<br />
no cumul lative behav viour at pottencial<br />
-1,4 4 to -<br />
0,8V. IIn<br />
general, behaviour r of curve 1 (HNO3) is so major,<br />
that finee<br />
resolution<br />
of<br />
voltamoogram<br />
2 (HHNO3<br />
+ H2 2O2) is hiddden<br />
and de eterminatio on of indivvidual<br />
met tal is<br />
forbiddden<br />
too.<br />
- 178 -<br />
Brno
XI. Workshop of Physical Chemists and Electrochemists´11 Brno<br />
I [nA]<br />
300<br />
250<br />
200<br />
150<br />
100<br />
50<br />
0<br />
-1.4 -1.2 -1 -0.8 -0.6<br />
Potencial [V]<br />
-0.4 -0.2 0 0.2<br />
Fig. 2: Voltamograms of two various ways of minearlisation.<br />
Electrochemical determination of heavy metals in standard (IAEA 413) was<br />
made too. Comparison of amount of metals in standard with electrochemical<br />
determination and reference sheet represent Fig. 3. As it seems, correlation between<br />
electrochemical determination connecting with mineralisation 2 and data in reference<br />
sheet of standard is very good (standard deviation is 0,0494). 100% repersent amount<br />
of metals introduced in data sheet.<br />
100%<br />
90%<br />
80%<br />
70%<br />
60%<br />
50%<br />
40%<br />
30%<br />
20%<br />
10%<br />
0%<br />
Zn Cd Pb Cu<br />
Fig. 3: Relative amount of heavy metals in standard IAEA 413; mineralisation 2<br />
- 179 -<br />
HNO3 + H2O2<br />
HNO3
XI. Workshhop<br />
of Physical l Chemists and Electrochemists<br />
E<br />
s´11<br />
CCalibration<br />
curves, see e Fig. 4, reppresent<br />
dep pendence of<br />
concentraation<br />
of me etals<br />
on amoount<br />
of IAEEA<br />
413. Al ll four curvves<br />
have go ood depend dence of linnearity<br />
(hig gher<br />
than 999%).<br />
Concentration of metals [uM]<br />
455<br />
400<br />
355<br />
300<br />
255<br />
200<br />
155<br />
100<br />
5<br />
Zn<br />
Cd<br />
Pb<br />
Cu<br />
0<br />
0 5 10<br />
Fig. 4: CCalibrationn<br />
curves of heavy h metaals<br />
in standa ard IAEA 413. 4<br />
15<br />
20 225<br />
30<br />
Amount t of IAEA 413 sttandard<br />
[mg]<br />
Fig 5: MMicrowave<br />
program – temperaturre<br />
depende ence – mine eralisation HHNO3.<br />
- 180 -<br />
35<br />
40<br />
Brno<br />
45
XI. Workshop of Physical Chemists and Electrochemists´11 Brno<br />
Fig 5 and Fig 6 show temperature dependence by microwave program for every<br />
mineralisation. Mineralisation 1 has constant linear behaviour from 1200 to 6700s by<br />
60°C. Temperature by mineralistaion 2 growing to 90°C at 1250s and than cooling is<br />
started. Mineralisation 2 is shorter three times by higher temperature, which has good<br />
influence for lifetime of bottles MG5.<br />
temperature (°C)<br />
100<br />
90<br />
80<br />
70<br />
60<br />
50<br />
40<br />
30<br />
20<br />
10<br />
0<br />
1 251 501 751 1001<br />
time (sec)<br />
1251 1501 1751<br />
Fig 6: Microwave program – temperature dependence – mineralisation HNO3 + H2O2.<br />
4. CONCLUSION<br />
Two various ways of mineralisation samples (dry matter) were published in this<br />
paper. First, mineralisation with conc. HNO3, second mineralisation with mix – HNO3<br />
+ H2O2. Both types of operations were effected by Microwave system Multiwave3000<br />
(Anton-Paar GmbH). Better from two ways of mineralisation is variation 2 (HNO3 +<br />
H2O2), because this variation has better peak resolution, time of procedur is shorter<br />
but samples is exposed higher temperature. Next improvement of mineralisation<br />
procedure is recommendated.<br />
5. ACKNOWLEDGEMENT<br />
The work has been supported by NANIMEL GA ČR 102/08/1546.<br />
6. REFERENCES<br />
Guerin T, Chekri R, Vastel C, Sirot V, Volatier JL, Leblanc JC, Noel L, Food Chemistry, 127, 3, 2011,<br />
932-934<br />
Joksimovic D, Tomic Ilija, Stankovic A, Jovic M, Stankovic S, Food Chemistry, 127, 2, 2011, 632-637<br />
Recknagel S, Richter A, Richter S, Waste management, 29, 3, 2009, 1213-1217<br />
- 181 -
XI. Workshop of Physical Chemists and Electrochemists´11 Brno<br />
ELECTROCHEMICAL DETERMINATION OF<br />
HEAVY METALS IN RAINWATER<br />
Petr MAJZLÍK 1 , David HYNEK 1 , René KIZEK 1*<br />
1 Mendel University in Brno, Zemedelska 1, CZ-613 00 Brno, CZ (e-mail: kizek@sci.muni.cz);<br />
Abstract<br />
Electrochemical determination of heavy metals in rain water is the aim of this<br />
paper. Determination of heavy metals in rainwater from weather-station Bořitov in<br />
course of one year was carried out. For electrochemical determination measuring<br />
system Metrohm (Autosampler 813 Compact and measuring unit VA Computrace<br />
797) was employed.<br />
1. INTRODUCTION<br />
Electrochemical determination of heavy metals in rain water is simple, practic<br />
and useful way how to check the amount of heavy metals in environment. Zinc,<br />
cadmium, lead and copper belong to the group of heavy metals. There are two insights<br />
into pollution of living environment by heavy metals. First represents occurrence of<br />
these metals in rocks, from which can be gradually released and entry the plants,<br />
respectively food chain. Second possibility of occurrence of heavy metals in living<br />
environment represents human itself due to anthropogenic activity (mining and<br />
processing of ore, chemical industry). Heavy metals represent significant problem,<br />
especially because of their toxicity, which may cause acute as well as chronic<br />
intoxication and lead to origination of malignant tumour disease. Due to these facts,<br />
improving of methods of their qualification and quantification using various<br />
measuring procedures is very advisable.<br />
2. EXPERIMENT<br />
Electrochemical determination<br />
Measuring system Metrohm was employed for the determination of heavy<br />
metals – Autosampler 813 Compact and measuring unit VA Computrace 797. Samples<br />
were prepared in this manner: 15 l of sample were mixed with 985 l of acetic buffer<br />
(pH = 5). Diferential pulse voltametry was used for the measurement with these<br />
parameters: potencial of deposition -1,3V, time of deposition 240s, range of potencial<br />
from -1,3V to 0,15V, pulse amplitude 0,025V, pulse time 0,04s, unit step 0,005035V,<br />
time of unit step 0,3s. A standard cell with three electrodes was used for the<br />
measurment. A hanging mercury drop electrode (HMDE) with a drop area of 0.4 mm 2<br />
was employed as the working electrode. An Ag/AgCl/3M KCl electrode served as the<br />
reference electrode. Pt electrode was used as the auxiliary electrode.<br />
- 182 -
XI. WWorkshop<br />
of Phyysical<br />
Chemists and Electrocheemists´11<br />
3. RESULTTS<br />
AND DISCUSSI<br />
D ION<br />
Measurrement<br />
of heavy h mettals<br />
by DPV V techniqu ue has beenn<br />
described<br />
many<br />
times<br />
over in literature; therefore, it is not necessary n to o representt<br />
accomplis shments<br />
andd<br />
negatives of this tec chnique. MMain<br />
aim of<br />
our work k consistedd<br />
in propos sing and<br />
reallization<br />
of aautomated<br />
measuring g procedure e for analysis<br />
of defineed<br />
small vo olume of<br />
sammple<br />
for dettermination<br />
n of above mmentioned<br />
heavy met tals in rainwwater.<br />
Prep paration<br />
of ssample<br />
prooceeded<br />
in accordancce<br />
with following<br />
pr rocedure: vvolume<br />
of 15 l of<br />
sammple<br />
for measurement<br />
of heavy mmetals<br />
(Zn, Cd, and Cu u) was placced<br />
into Eppendorf<br />
miccro<br />
test tube<br />
togethe er with 9885<br />
l of ace etate buffe er (pH 5.000).<br />
Sample es were<br />
subssequently<br />
placed into o Autosammpler<br />
813; in enclosed d software,<br />
list of measured m<br />
sammples<br />
was crreated.<br />
Fig. 1 demonstrate<br />
es typical vvoltammog<br />
gram of sim multaneous s determina ation of<br />
zincc,<br />
cadmiumm,<br />
lead and copper ionss.<br />
Dependeence<br />
of buff fer pH and d concentrat tion of hea avy metals iillustrates<br />
Fig. F 2. It<br />
is obbvious<br />
thatt<br />
the best detection d off<br />
heavy met tals is by pH H 5.00. Thaat<br />
is the rea ason for<br />
use of acetic buuffer<br />
pH 5. 00 for otheer<br />
measurem ments.<br />
Fig. . 1: Typicall<br />
voltammo ogram of siimultaneou<br />
us determin nation of zinnc,<br />
cadmiu um, lead<br />
and coppper<br />
ions.<br />
I (nA)<br />
33,5<br />
3<br />
22,5<br />
2<br />
1,5<br />
1<br />
00,5<br />
0<br />
4<br />
Cu Zn<br />
4,2<br />
4,4 4,6<br />
Acetic c buffer (pH)<br />
Fig. . 2: Dependdence<br />
of buf ffer pH andd<br />
system response<br />
Cd<br />
- 183 -<br />
Pb<br />
4,8<br />
5<br />
Brno
XI. Workshop of Physical Chemists and Electrochemists´11 Brno<br />
Rainwater samples were measured for present of heavy metals. Furthermore<br />
conductivity and pH were measured. Average characteristic values for each season in<br />
one year are presented in Table 1. Concentration of pollutants which are presented in<br />
table is increasing in summer months. Opposite in winter the concentration of<br />
pollutants is higher. Probably it is due to human activity, especially heating and<br />
pollutants emitted into air). Dependence of pH in one year is increasing from spring<br />
to winter as well as conductivity.<br />
Table 1: Comparison of various characterictic values in course of one year.<br />
1. spring<br />
(6,53)<br />
2. summer<br />
(6,37)<br />
3. autumn<br />
(6,90)<br />
4. winter<br />
(7,15)<br />
pH conductivity<br />
(µS/cm)<br />
spring<br />
(56,12)<br />
summer<br />
(63,38)<br />
autumn<br />
(71,74)<br />
winter<br />
(88,47)<br />
conc. Zn<br />
(µM)<br />
spring<br />
(28,05)<br />
summer<br />
(29,32)<br />
autumn<br />
(90,41)<br />
winter<br />
(98,80)<br />
- 184 -<br />
conc. Cd<br />
(µM)<br />
spring<br />
(0,54)<br />
summer<br />
(0,12)<br />
autumn<br />
(5,66)<br />
winter<br />
(6.00)<br />
conc. Pb<br />
(µM)<br />
spring<br />
(1,29)<br />
summer<br />
(1,44)<br />
autumn<br />
(4,55)<br />
winter<br />
(7,06)<br />
conc. Cu<br />
(µM)<br />
spring<br />
(21,58)<br />
summer<br />
(19,91)<br />
autumn<br />
(37,27)<br />
winter<br />
(51,06)<br />
4. CONCLUSION<br />
Monitoring of amount of heavy metals in rainwater is presented in this paper.<br />
Electrochemical detection of heavy metals represents analytical method with good<br />
reproducibility, effortless service and relatively rapid determination. It seems to be<br />
good analytical tool for periodic determination of heavy metals in rainwater.<br />
Monitoring of pollutants in rainwater is very useful tool for environment control.<br />
5. ACKNOWLEDGEMENT<br />
The work has been supported by NANIMEL GA ČR 102/08/1546.<br />
6. REFERENCES<br />
[1] Vacek J, Petrek J, Kizek R, et all.: Bioelectrochemistry, 63 (2004), 1-2, 347-351<br />
[2] Strouhal M, Kizek R, Vacek J, et all.: Bioelectrochemistry, 60 (2003), 1-2, 29-36<br />
[3] Adam V, Petrlova J, Potesil D, et all.: Electroanalysis, 17 (2005), 18, 1649-1657<br />
[4] Kovarova J, Kizek R, Adam V, et all.: Sensors, 9 (2009), 6, 4789-4803<br />
[5] Adam V, Sileny J, Hubalek J, et all.: Toxicology Letters, 180 (2008), Suppl.1, S227-S228<br />
[6] Adam V, Fabrik I, Kohoutkova V, et all.: International Journal of Electrochemical Science, 5<br />
(2010), 429-447<br />
[7] Krystofova O, Trnkova L, Adam V, et all.: Sensors, 10, 6, 5308-5328
XI. Workshop of Physical Chemists and Electrochemists´11 Brno<br />
ELECTROCHEMICAL DETERMINATION OF<br />
MT1 AND MT2 ISOFORMS<br />
Petr MAJZLÍK 1 , David HYNEK 1 , Tereza REICHLOVÁ 2 , René KIZEK 1*<br />
1 Mendel University in Brno, Zemedelska 1, CZ-613 00 Brno, CZ (e-mail: kizek@sci.muni.cz);<br />
2 Brno University of Technology, Faculty of electrical engineering and communication, Department of<br />
biomedical engineering<br />
Abstract<br />
Metallothioneins (MTs) are low molecular, cysteine-rich proteins that have naturallyoccurring<br />
Zn 2+ in both clusters. They may serve as a reservoir of metals for synthesis<br />
of apoenzymes and zinc-finger transcription regulators. New biological roles for these<br />
proteins have been identified including those needed in the carcinogenic process. In<br />
this study, electrochemical determination of metallothionein isoforms MT1 and MT2<br />
was carried out. Metallothionein analysis was carried out by adsorptive transfer<br />
stripping differential pulse voltammetry Brdicka reaction. Determination and<br />
resolution of isomers MT1 and MT2 with electrochemical determination is aim of this<br />
work.<br />
1. INTRODUCTION<br />
Metallothioneins (MTs) are metal-binding proteins 6–7 kDa in size. They are<br />
induced by heavy metals, and they actively regulate and detoxify metals in numerous<br />
cells and organs [1-4]. MTs are composed of four isoform classes: MT-I, -II, -III, and -<br />
IV. MT-I and MT-II are the main MT isoform classes expressed in many organs. MT-<br />
III is localized in the brain and MT-IV in the squamous epithelium. In addition, it is<br />
becoming clear that MTs are not only involved in metal regulation but also have<br />
radicalscavenging and reactive oxygen species (ROS)-quenching effects. MTs are<br />
reported to be induced by a wide spektrum of stressors such as steroids, carcinogens,<br />
chemical substances, ionizing radiation and UV radiation [5–9]. In this study,<br />
electrochemical determination of metallothionein isoforms MT1 and MT2 [10-13] was<br />
carried out. Metallothionein analysis was carried out by adsorptive transfer stripping<br />
differential pulse voltammetry Brdicka reaction [14-16].<br />
2. EXPERIMENT<br />
Electrochemical determination of Metallothionein<br />
Using our modified MT determination with Brdicka reaction four signals were<br />
measured (Fig. 1). It can be concluded that catalytic signals of hydrogen ions<br />
reduction are measured at potential about -1.5 V. Next signal which is appearing at<br />
potential about -1.3 V is result of reduction of RS2Co complex. There are shown<br />
catalytic signal at -1.5 V and less developed signal of RS2Co complex in<br />
voltammogram. Another signals are probable due to reduction of [Co(H2O)6] 2+ at -1.2<br />
- 185 -
XI. Workshhop<br />
of Physical l Chemists and Electrochemists<br />
E<br />
s´11<br />
V (marrked<br />
as Co1)<br />
and -0.8 V (Co2). CCo2<br />
signal with w decrea asing concenntration<br />
of f MT<br />
decreasses<br />
and mmoves<br />
to<br />
potentiial.<br />
Fig. 1: TTypical<br />
volltammogram<br />
ms of MT saample<br />
Electrochemmical<br />
measu urements wwere<br />
perfor rmed using g an AUTOOLAB<br />
anal lyser<br />
(EcoChhemie,<br />
The Netherlands)<br />
conneccted<br />
to VA-Stand<br />
663 (Metrohmm,<br />
Switzerla and),<br />
using a standard ccell<br />
with three<br />
electrrodes.<br />
The three-elect trode systeem<br />
consiste ed of<br />
hangingg<br />
mercury drop electr rode as worrking<br />
electr rode, an Ag g/AgCl/3 M KCl refere ence<br />
electrodde<br />
and a glassy car rbon auxilliary<br />
electr rode. For smoothingg<br />
and base eline<br />
correction<br />
the sofftware<br />
GPE ES 4.4 suppllied<br />
by Eco oChemie wa as employeed.<br />
The Brd dicka<br />
supportting<br />
electrrolyte<br />
cont taining 1 mmM<br />
Co(NH3)6Cl3<br />
and<br />
1 M ammmonia<br />
bu uffer<br />
(NH3(aqq)<br />
+ NH4Cll,<br />
pH = 9.6) was used; surface-act tive agent was w not addded.<br />
AdTS DPV D<br />
Brdickaa<br />
reaction parameters s were as ffollows:<br />
ini itial potent tial -0,7 V, , purgetime e 5s,<br />
duratioon<br />
240s, stteppotentia<br />
al 1,05mV,<br />
scan rat te 4,2mV/s s, modulattion<br />
amplit tude<br />
25,05mmV.<br />
Temperrature<br />
of the<br />
supportinng<br />
electroly yte was 4 °C C.<br />
MMethod<br />
for polarograp phic determmination<br />
of f proteins containing c –SH group p on<br />
mercurry<br />
electrodde<br />
was pub blished by Brdicka and a this method m wass<br />
improved d by<br />
Palečekk<br />
and otheers.<br />
Method d is based on catalytic<br />
reaction n of proteins<br />
in Brd dicka<br />
solutionn<br />
which<br />
[Co(NHH3)6]Cl3.<br />
is prepar red from ammonia buffer (N NH4OH + NH4Cl) and<br />
1<br />
negative<br />
2<br />
MT<br />
Adsorpttion<br />
of proteein<br />
Fig. 3: Scheme off<br />
adsorptive e stripping technique e (AdST). Working W ellectrode<br />
is first<br />
inserted innto<br />
small volume v of ssample.<br />
Me etallothione ein adsorbss<br />
on surfac ce of<br />
mercury ellectrode<br />
and<br />
it is separrated<br />
from other therm mostabel thhiols<br />
in sam mple.<br />
- 186 -<br />
3<br />
Washing W<br />
of<br />
4<br />
Electrochemmic<br />
al detectioon<br />
Brno
XI. Workshop of Physical Chemists and Electrochemists´11 Brno<br />
Then is electrode washed and finally is inserted into measuring vessel with<br />
supporting electrolyte.<br />
Materials<br />
MT-1 M5267-5MG, 014K7053 Sigma - Aldrich<br />
MT-2 M5392-5MG, 052K7002 Sigma - Aldrich<br />
ACS water Lot: S43109-287 Sigma - Aldrich<br />
miliQ water Millipore<br />
EDTA Lot: 042K0087 Sigma - Aldrich<br />
3. RESULTS AND DISCUSSION<br />
I [nA]<br />
300<br />
250<br />
200<br />
150<br />
100<br />
50<br />
0<br />
Fig. 4: Calibration curve of MT 1<br />
- 187 -<br />
y = 0.2677x - 10.204<br />
R 2 = 0.9909<br />
0 100 200 300 400 500 600 700 800 900 1000<br />
Concentration of MT 1 [nM]
XI. Workshhop<br />
of Physical l Chemists and Electrochemists<br />
E<br />
s´11<br />
I [nA]<br />
3300<br />
2250<br />
2200<br />
150<br />
100<br />
50<br />
0<br />
0 1000<br />
200<br />
Fig. 5: CCalibrationn<br />
curve of MT M 2<br />
300 4000<br />
500<br />
Concenntration<br />
of MT 2 [nM]<br />
Fig. 4 and 5 show ca alibration ccurves<br />
of both b isoform ms MT1 aand<br />
MT2. Both<br />
B<br />
calibrattion<br />
curves have linea ar behaviouur<br />
with depe endability higher h thann<br />
99%.<br />
Fig. 6: PPosition<br />
of Cat2 C peak ffor<br />
MT1 an nd MT2<br />
- 188 -<br />
600 700<br />
y = 0.2414x - 11.08<br />
R 2 86<br />
= 0.9931<br />
800 9900<br />
1000<br />
Brno
XI. Workshop of Physical Chemists and Electrochemists´11 Brno<br />
Differences in position of peaks Cat2 by MT1 and MT2 were discovered. Five<br />
series (each of ten steps) of measurement for MT1 and MT2 were determined.<br />
Average values of position peak Cat2 represent Fig. 6. Average value of peak position<br />
Cat2 for MT1 is -1,479V and for MT2 -1,472V. Peak position values for determination<br />
average values had standard deviation 0.005. The difference between both isoforms<br />
is 0.005V and this difference is apparent by larger number of measurement.<br />
4. CONCLUSION<br />
Electrochemical determination of MT1 and MT2 isoforms is aim of this work.<br />
Metallothionein analysis was carried out by adsorptive transfer stripping differential<br />
pulse voltammetry with Brdicka reaction. Comparison of peak position Cat2 for MT1<br />
and MT2 was made. Average value of peak position Cat2 for MT1 is -1,479V and for<br />
MT2 -1,472V. The difference between both isoforms is 0.005V.<br />
5. ACKNOWLEDGEMENT<br />
The work has been supported by NANIMEL GA ČR 102/08/1546.<br />
6. REFERENCES<br />
[1] J.H.R. Kagi, A. Schaffer, Biochemistry 27 (1988) 8509.<br />
[2] M. Margoshes, B.L.A. Vallee, J. Am. Chem. Soc. 79 (1957) 4813.<br />
[3] M. Studnickova, J. Turanek, H. Zabrsova, M. Krejci, M. Kysel, J. Electroanal.Chem. 421 (1997)<br />
25.<br />
[4] R.D. Palmiter, Proc. Natl. Acad. Sci. USA 91 (1994) 1219.<br />
[5] Angel P, Poting A, Mallick U, Rahmsdorf HJ, Schorpp M, Herrlich P. Mol Cell Biol 1986;6:1760–<br />
1766.<br />
[6] Bauman JW, Liu J, Liu YP, Klaassen CD. Toxicko Appl Pharmacol 1991;110:347–354.<br />
[7] Fornace AJ Jr, Schalch H, Alamo I Jr. Mol Cell Biol 1988;8:4716–4720.<br />
[8] R. Kizek, L. Trnkova, E. Palecek, Anal. Chem. 73 (2001) 4801.<br />
[9] R. Prusa, R. Kizek, J. Vacek, L. Trnkova, J. Zehnalek, Clin. Chem. 50 (2004) A28.<br />
[10] M. Strouhal, R. Kizek, J. Vacek, L. Trnkova, M. Nemec, Bioelectrochemistry 60 (2003) 29.<br />
[11] L. Trnkova, R. Kizek, J. Vacek, Bioelectrochemistry 56 (2002) 57.<br />
[12] R. Brdicka, Coll. Czech. Chem. Commun. 5 (1933) 148.<br />
[13] R. Brdicka, Coll. Czech. Chem. Commun. 5 (1933) 112.<br />
[14] R. Bdrdicka, Coll. Czech. Chem. Commun. 8 (1936) 366.<br />
- 189 -
XI. Workshop of Physical Chemists and Electrochemists´11 Brno<br />
INFLUENCE OF PtCl4 ON MAIZE AND PEA<br />
Hana MIKULÁŠKOVÁ 1 , Olga KRYŠTOFOVÁ 2 , David HYNEK 2 , Natalia CERNEI 2 ,<br />
Pavlína ŠOBROVÁ 2 , Miroslava BEKLOVÁ 1 , Vojtěch ADAM 2 , René KIZEK 2<br />
1 Department of Veterinary Ecology and Environmental Protection, University of Veterinary and<br />
Pharmaceutical Sciences, Palackeho 1-3, CZ-612 42 Brno, Czech Republic<br />
2 Department of Chemistry and Biochemistry, Mendel University in Brno, Zemedelska 1, CZ-613 00<br />
Brno, Czech Republic<br />
Abstract<br />
The aim of this work was to study the influence of platinum ions on the germination<br />
of selected plant species, which are an important part of the food chain of livestock<br />
and humans. Peas (Pisum sativum L.) and maize (Zea mays L.) were chosen for the<br />
experiment. Seeds of plants were exposed to different concentrations of platinum ions<br />
0, 5, 10, 25, 50, 100 μM for 8 and 12 days. In the end of the experiment, the changes in<br />
plant growth, content of zinc and enzyme activity of GST (glutathione S-transferase)<br />
were monitored. Measuring system consisting of potentiostat Autolab TypeIII<br />
(EcoChemie, Netherlands) connected with the measuring unit VA Stand 663<br />
(Metrohm, Switzerland) was used for determination of zinc, and spectrofotometric<br />
analyzer BS-200 (Mindray, China) for determination of GST activity.<br />
1. INTRODUCTION<br />
Environmental pollution by heavy metals is an increasing problem worldwide.<br />
Because of the accumulation effect of some heavy metals, especially through the food<br />
chain, their bioavailability needs to be monitored (Kouba et al., 2010). The present<br />
literature survey shows that the concentration of these metals has increased<br />
significantly in the last decades in diverse environmental matrices; like airborne<br />
particulate matter, soil, roadside dust and vegetation, river, coastal and oceanic<br />
environment (Appenroth, 2010; Nagajyoti et al., 2010). However, the increasing uses<br />
of platinum in vehicle exhaust catalysts, in addition to some other applications (e.g.<br />
industry, jewellery, anticancer drugs) cause their anthropogenic emission and spread<br />
in the environment and thus represent the risk in human health. The diseases<br />
described in human are respiratory and skin diseases, in some cases may support the<br />
possibility of cancer. Some Pt salts, like hexachloro platinate and tetrachloro platinite,<br />
are among the most potent allergens and sensitizers (Ravindra et al., 2004).<br />
2. EXPERIMENT<br />
Seeds of pea (Pisum sativum L.) and maize (Zea mays L.) were used to determine<br />
the effects of platinum (Pt). The seeds were exposed to PtCl4 at concentrations of 0, 5,<br />
10, 25, 50, and 100 μM. For each variant were selected 100 germinated seeds, which<br />
were placed on plates and covered with cellulose. The ends of cellulose were dipped<br />
in vessels with solution with different metal concentrations in volume 300 ml.<br />
Subsequently, the seeds sprouted in the culture box for 8 and 12 days in the dark at 25<br />
° C and humidity of 60%. In the 8 and 12 day of the experiment the harvested germs<br />
- 190 -
XI. WWorkshop<br />
of Phyysical<br />
Chemists and Electrocheemists´11<br />
werre<br />
carried oout<br />
and met trics parammeters<br />
(lengt th, weight, dry weightt)<br />
and biochemical<br />
marrkers<br />
(zinc, activity of f GST) of abboveground<br />
d and root parts p were oobserved.<br />
3. RESULTTS<br />
AND DISCUSSI<br />
D ION<br />
Influencee<br />
of platinu um in formm<br />
Pt<br />
seleected<br />
plantts<br />
species was obser<br />
incrreasing<br />
conncentration<br />
of PtCl4 in<br />
andd<br />
roots of ppeas<br />
and corn.<br />
The gro<br />
andd<br />
12 day 775%<br />
in the<br />
group w<br />
commparison<br />
wiith<br />
the con ntrol group<br />
deteermined<br />
zinnc<br />
content.<br />
In pea pla<br />
incrreasing<br />
conncentration<br />
of applied<br />
(Figg.<br />
1, b). A ssimilar<br />
tren nd is shown<br />
the experimennt<br />
observed increase in<br />
IV+ on growth<br />
of ro oot and abooveground<br />
parts of<br />
rved. It wa as found by b measurrement,<br />
that<br />
with<br />
ncrease the growth inh hibition of abovegroun nd parts<br />
owth inhib bition in 8 day of expperiment<br />
was<br />
60 %<br />
with highest<br />
concent tration (1000<br />
μM) of Pt<br />
(0 μM). In addition to o growth chharacteristi<br />
ants, we ob bserved an increase i of f zinc conte<br />
metal PtCl l4 and durat tion of expoosure<br />
to th<br />
n on maize (Fig. 1 c, d), d where wwe<br />
in the 12<br />
n zinc conte ent in comp parison witth<br />
control.<br />
V+ in<br />
ics were<br />
ent with<br />
his metal<br />
2 day of<br />
Moreoveer,<br />
enzyme marker GSST<br />
(glutath hione-S-transferase)<br />
wwas<br />
measur red. The<br />
obtaained<br />
resultts<br />
showed that t the GSST<br />
activity increase, i mainly m at thee<br />
second sa ampling,<br />
withh<br />
increasinng<br />
concentr ration of appplied<br />
meta al PtCl4. It was observved<br />
the inc crease of<br />
GSTT<br />
activity uup<br />
to five times<br />
of abooveground<br />
parts p and fo our at the rroot<br />
of the plant in<br />
commparison<br />
wwith<br />
the con ntrol groupp.<br />
The high hest GST activity<br />
was recorded in n plants<br />
exposed<br />
to conncentration<br />
ns of metalss<br />
100 μM. The T GST activity<br />
noticceable<br />
incre eased in<br />
maiize,<br />
mainlyy<br />
at the fir rst samplinng<br />
in comp parison with<br />
the secoond<br />
samplin ng. The<br />
incrrease<br />
in GSST<br />
activity y in the firrst<br />
sampling<br />
was thre ee times hiigher<br />
comp pared to<br />
conntrol.<br />
In the<br />
case of the t second sampling, the activit ty of GST was at all applied<br />
conncentrationss<br />
of metal equivalent. e<br />
Figuure<br />
1: influuence<br />
of Pt tCl4 on zinnc<br />
content in pea in abovegroun a nd (a) and root (b)<br />
parts off<br />
plants and d maize in aabovegroun<br />
nd (c) and root<br />
(d) partt<br />
- 191 -<br />
Brno
XI. Workshop of Physical Chemists and Electrochemists´11 Brno<br />
4. CONCLUSION<br />
Heavy metals belong in present to the major environmental pollutants. The<br />
increasing uses of platinum in vehicle exhaust catalysts, in addition to some other<br />
applications cause their anthropogenic emission and spread in the environment and<br />
thus represent the risk in human health. The bioavailability of platinum PtCl4, which<br />
was used in our experiment, was demonstrated. Our results show, that the influence<br />
of platinum on the growth of pea and maize are comparable<br />
5. ACKNOWLEDGEMENT<br />
The work has been supported by IGA 83/2011/FVHE, IGA MENDELU 2/2011<br />
and MSM 6215712402<br />
6. REFERENCES<br />
[1] Appenroth, K. J.: Acta Physiologiae Plantarum 32 (2010) 615-619.<br />
[2] Kouba, A., M. Buric, and P. Kozak.: Water Air and Soil Pollution 211 (2010) 5-16.<br />
[3] Nagajyoti, P. C., K. D. Lee, and T. V. M.: Environmental Chemistry Letters 8 (2010) 199-216.<br />
[4] Ravindra, K., L. Bencs, and R. Van Grieken.: Science of the Total Environment 318 (2004) 1-43.<br />
- 192 -
XI. Workshop of Physical Chemists and Electrochemists´11 Brno<br />
PLATINUM GROUPS ELEMENTS AND<br />
THEIR INFLUENCE ON PEA SEEDLINGS<br />
Hana MIKULÁŠKOVÁ 1 , Olga KRYŠTOFOVÁ 2 , David HYNEK 2 , Natalia CERNEI 2 ,<br />
Pavlína ŠOBROVÁ 2 , Miroslava BEKLOVÁ 1 , Vojtěch ADAM 2 , René KIZEK 2<br />
1 Department of Veterinary Ecology and Environmental Protection, University of Veterinary and<br />
Pharmaceutical Sciences, Palackeho 1-3, CZ-612 42 Brno, Czech Republic<br />
2 Department of Chemistry and Biochemistry, Mendel University in Brno, Zemedelska 1, CZ-613 00<br />
Brno, Czech Republic<br />
Abstract<br />
In the last ten years there has been noted the significant incensement in<br />
concentrations of platinum group elements in the environment. The main emission<br />
sources of platinum group elements to the environment are automotive catalysts,<br />
industrial ones and hospital wastes. Platinum content of road dusts can be soluble;<br />
consequently, it enters the waters, sediments, soil and finally, the food chain. Our<br />
work was aimed at investigation of influence of platinum and palladium on the seeds<br />
of pea (Pisum sativum L.) that were exposed to PtCl4 PdCl2 in concentrations 0, 5, 10,<br />
25, 50, 100 μM. In the 12th day-long experiment, we evaluated the inhibition effects<br />
of platinum (Pt and Pd) on the growth of plants in their early stages of growth.<br />
Moreover, we monitored the influence of platinum on chosen biochemical markers<br />
(content of protein and zinc).<br />
1. INTRODUCTION<br />
Platinum group metals (PGE), (Pt, Pd, Rh and more rarely Ir, Os and Ru) can be<br />
naturally found only at very low concentration in the earth crust. The best-known<br />
representative of this group, platinum, was used in ancient Egypt, for the manufacture<br />
of jewelry by the natives. Another platinum metals Rh, Pd, Ir, Os, Ru were discovered<br />
at 18th century. Worldwide production of PGEs has been steadily increasing since<br />
1970 (WHO, 1991). Nowadays, these metals found their application in the large field<br />
of industry. In chemical industry are PGE used as catalysts for chemical synthesis or<br />
for production of chemical-resistant glass. In medicine Pt complexes has been<br />
observed as highly effective anti-tumour or ‘anti-neoplastic’ drugs for treating<br />
testicular tumours, ovarian carcinomas, bladder tumours and tumours of the head and<br />
neck [1]. PGE also are abundantly used in jewellery. PGE contamination initially<br />
occurs in airborne particulate matter (PM), roadside dust, soil, sludge and water, etc.;<br />
which finally results in bioaccumulation of these elements in the living organisms<br />
through diverse pathways [2]. Generally, PGEs are referred to behave in an inert<br />
manner and to be immobile. However, there is an evidence of spread and<br />
bioaccumulation of these elements in the environment. Platinum content of road<br />
dusts can be soluble; consequently, it enters the waters, sediments, soil and finally, the<br />
food chain [3]. The effect of chronic occupational exposure to Pt compounds is welldocumented,<br />
and certain Pt species are known to exhibit allergenic potential.<br />
- 193 -
XI. Workshop of Physical Chemists and Electrochemists´11 Brno<br />
However, the toxicity of biologically available anthropogenic Pt is not clear. Hence,<br />
there is a need to study the effect on human health of long-term chronic exposure to<br />
low levels of Pt compounds [4].<br />
2. EXPERIMENT<br />
In our experiment we determined the effects of platinum metals on pea seeds<br />
(Pisum sativum L.). Our work was aimed at investigation of influence of platinum and<br />
palladium on the seeds of pea (Pisum sativum L.) that were exposed to PtCl4 PdCl2 in<br />
concentrations 0, 5, 10, 25, 50, 100 μM. For each variant were selected 100 germinated<br />
seeds, which were placed on plates and covered with cellulose. The ends of cellulose<br />
were dipped in vessels with solution with different metal concentrations in volume<br />
300 ml. Subsequently, the seeds sprouted in the culture box for 8 and 12 days in the<br />
dark at 25 ° C and humidity of 60%. In the 8 and 12 day of the experiment the<br />
harvested germs were carried out and metrics parameters (length and biomass<br />
weight), total content of protein and electrochemical determination of zinc content<br />
were determined.<br />
3. RESULTS AND DISCUSSION<br />
The literature shows that the amount of platinum metals in the bodies of plants<br />
and animals in is in the order in ng/g [4-7]. Therefore, we firstly studied the influence<br />
of PtCl4 and PdCl2 on growth of pea seeds. The obtained results show that the<br />
application of metals caused significant growth inhibition in root and aboveground<br />
parts of pea in 8th and 12th day of experiment with increasing concentrations of<br />
applied metal. The highest growth inhibition compared to control was observed at<br />
concentrations 50 and 100 μM. The growth inhibition was in the second sampling<br />
triple in aboveground and four in the root part at platinum and to five times the<br />
aboveground part and the root of seven times at the Palladium. These trends were<br />
similar in the weight of biomass determination. Based on these initial results we can<br />
conclude that the PdCl2 has stronger inhibitive effect than PtCl4.<br />
In addition, selected interested stress markers were studied in our experiment.<br />
One of them is the protein content in plants. Proteins are generally involved in the<br />
regulation of stress factors caused by foreign substances. In our experiment, Pt 4+ and<br />
Pd 2+ ion as foreign substances were used. We found that PtCl4 and PdCl2 reduced<br />
protein synthesis at all concentrations applied in aboveground and root parts of pea<br />
seeds in 8th and 12th day of experiment. The highest inhibition of protein synthesis<br />
was observed at concentrations 100 μM. (Fig.1)<br />
Moreover, we evaluated total zinc content, which is an important chemical<br />
compound in enzyme activation and protein synthesis. We found that with the<br />
increasing concentration of applied metal occurred to increasing content of zinc in<br />
comparison with the control group in the case of PtCl4. Conversely, the pea seeds<br />
exposed to PdCl2, demonstrated reduction of zinc after exposition of increasing metal<br />
concentration in 12 day in comparison with the control group.<br />
- 194 -
XI. WWorkshop<br />
of Phyysical<br />
Chemists and Electrocheemists´11<br />
Figuure<br />
1: influuence<br />
of PtC Cl4 on proteein<br />
content<br />
in pea in abovegrounnd<br />
(a) and root (b)<br />
parts off<br />
plants and d PdCl2 on pprotein<br />
con ntent in pea a in abovegground<br />
(a) and a root<br />
(b) partts<br />
of plants<br />
4. CONCLLUSION<br />
Due to ssignificant<br />
environmeental<br />
degrad dation associated<br />
withh<br />
high traf ffic, it is<br />
necessary<br />
havve<br />
a deeper r interest iin<br />
the fate of polluta ants producced<br />
by traf ffic and<br />
poteential<br />
healtth<br />
and envi ironmental risks associated<br />
with them.<br />
In the caase<br />
of plati inum (PtCll4)<br />
and palla adium (PdC Cl2), whichh<br />
were used d in the<br />
experiment,<br />
thhe<br />
influenc ce on seleccted<br />
bioche emical mark kers (proteein<br />
and zin nc) were<br />
demmonstrated.<br />
5.<br />
6.<br />
[1]<br />
[2]<br />
[3]<br />
[4]<br />
[5]<br />
[6]<br />
[7]<br />
[8]<br />
ACKNOOWLEDGE<br />
EMENT<br />
The workk<br />
has been supported by IGA 83/ /2011/FVHE<br />
and MSMM<br />
62157124 402<br />
REFEREENCES<br />
WHO.Envvir<br />
onmental Health Critteria<br />
125–Pla atinum. Geneva:<br />
World Health Orga anization,<br />
Internationnal<br />
Programm me on Chemiccal<br />
Safety, 19 991.<br />
K. Kummeerer,<br />
E. Helme ers, Science oof<br />
the Total Environment<br />
193 1 (1997) 1779.<br />
S. Rauch, GG.M.<br />
Morriso on, Elements 4 (2008) 259.<br />
M. Moldovvan,<br />
Anal. Bio oanal. Chem. 388 (2007) 537.<br />
K. Ravindrra,<br />
L. Bencs, R. R Van Griekeen,<br />
Sci. Total Environ. 318 8 (2004) 1.<br />
R. Djingovva,<br />
P. Kovacheva,<br />
G. Wagnner,<br />
B. Marke ert, Science of f the Total Ennvironment<br />
308 3 (2003)<br />
235.<br />
K.H. Ek, SS.<br />
Rauch, G.M M. Morrison, P. Lindberg,<br />
Science of the t Total Env nvironment 334<br />
(2004)<br />
149.<br />
S.H. Pan, G. Zhang, Y.L. Y Sun, P. CChakraborty,<br />
Science of the t Total Envvironment<br />
40 07 (2009)<br />
4248.<br />
- 195 -<br />
Brno
XI. Workshop of Physical Chemists and Electrochemists´11 Brno<br />
UTILIZATION OF ELECTROCHEMICAL<br />
METHODS IN STUDIES OF<br />
TRANSPORTING PROCESSES ACROSS<br />
THE PHOSPHOLIPID BILAYERS<br />
Tomáš NAVRÁTIL 1 , Ivana ŠESTÁKOVÁ 1 , Vladimír MAREČEK 1<br />
1 J. Heyrovský Institute of Physical Chemistry of AS CR, v.v.i., Dolejškova 3, 182 23 Prague, Czech<br />
Republic, E-mail: navratil@jh-inst.cas.cz<br />
Abstract<br />
This contribution deals with studying and characterization of transporting processes<br />
of heavy metals (lead and cadmium) in the form of their free ions and of their<br />
complexes with small organic ligands across biological membranes. These membranes<br />
are represented by model phospholipid bilayers, formed on the surface a suitable flat<br />
support material or in its pores. Phosphatidyl choline and phosphatidyl ethanolamine<br />
were used as the membrane building elements. Voltammetry and electrochemical<br />
impedance spectrometry (EIS) have been used for characterization of the transporting<br />
processes.<br />
1. INTRODUCTION<br />
To secure normal functioning of living (plant or animal) cells, it is necessary to<br />
realize transport of various inorganic and organic compounds (nutrients, etc.), across<br />
the cell membrane (composed from phospholipids and other parts) into or out of the<br />
cells or various sub-cellular structures. Not only the useful and usual metabolic<br />
compounds are transported into the cells across the membranes; unfortunately, the<br />
above mentioned undesired ions, compounds and particles, which are connected with<br />
the pollution of the environment, also participate in the transporting processes [1,2].<br />
The principles, on which the transporting processes are based, have been studied for<br />
many years in many laboratories all over the world [3-5].<br />
Lipid bilayers (LBs) (or phospholipid bilayers (PLBs)) are thin, flat membranes<br />
consisting of two layers of lipid molecules, with their hydrophobic parts, usually fatty<br />
acid tails, directed toward the centre of the membrane, and with hydrophilic parts<br />
located at the inner and outer borders [6-9]. There are many different principles, on<br />
which the molecules, ions, or the particles are transported across them. Gases like<br />
oxygen, CO2 and nitrogen – small molecules hardly interacting with solvents – diffuse<br />
easily across the hydrophobic part of the membrane [5]. Lipid molecules, e.g.,<br />
steroidal hormones, permeate the bilayer easily [5]. Compounds insoluble in fats are<br />
transported across amphipathic proteins and can be dipped into equally oriented lipid<br />
bilayer. The proteins form channels for ions and small molecules and serve for<br />
transport of bigger molecules, which would not be otherwise able to pass across the<br />
- 196 -
XI. Workshop of Physical Chemists and Electrochemists´11 Brno<br />
bilayer [1]. Transport can be passive or supplied by some external energy. There are<br />
some other utilized principles of transport; we can mention endocytosis and<br />
exocytosis (e.g., in cases of larger objects and particles, such as bacteria, viruses),<br />
electroporation etc. [1,5].<br />
On the other hand, the (mostly negative) role of heavy metals in living cells has<br />
been studied very intensively. The principles of their fate and transport inside such<br />
cells are very well known too (e.g., under participation of phytochelatins and<br />
metallothioneins [10-14]). Nevertheless, the principles of their transport across the<br />
cell membranes have remained unelucidated and this contribution should contribute<br />
to their explaination.<br />
2. EXPERIMENT<br />
The experiments described in this contribution were realized using porous<br />
membranes constructed of two types of phospholipids: 1,2-dipalmitoyl-sn-glycero-3phosphocholine<br />
(lecithin, DPPC, GPCho (16:0/16:0), CAS No. 63-89-8) (Avanti Polar<br />
Lipids, Alabaster, USA), and 1,2-dipalmitoyl-sn-glycero-3-phosphoethanolamine<br />
(DPPE, GPEtn(16:0/16:0), CAS No. 923-61-5) (Sigma-Aldrich, Prague, Czech<br />
Republic). The PLBs were formed by self-assembling in the holes of the Isopore<br />
Membrane Filters (Millipore, USA) polycarbonate, hydrophilic 8.0 μm, and the<br />
supporting membrane thickness amounted to 7-22 m. The area of one pore<br />
amounted to 50 m 2 , the experimentally found porosity of the membranes was about<br />
25-45 %.<br />
The other type of supported membranes was prepared on the surface of agar<br />
electrode, which was prepared from a Teflon tube (diameter 1 mm) filled with agar.<br />
Contact was realized by a silver wire covered by silver chloride.<br />
The way used to preparation of supported PLBs (SPBLs) on porous membranes<br />
was described in detail, e.g., in [1,7]. We mention the basic points here: A<br />
phospholipid solution (20 mg.mL -l in n-heptane) was applied to both sides of the<br />
porous polycarbonate membrane and the solvent was evaporated on the air. The<br />
ionophores were added to the phospholipid solutions before their application on the<br />
membrane surfaces. To prevent contamination in the experiments, all the parts<br />
(polycarbonate membrane, cup, upper and lower part) were exchanged for new ones<br />
prior to each experiment [15].<br />
Two types of electrical equivalent circuits were utilized to characterize the<br />
formed SPLBs bilayers and the corresponding transport processes. The simpler one<br />
(composed of one resistor in serial combination with parallel combination of a resistor<br />
and a capacitor) was applicable for characterization of the free polycarbonate<br />
membranes. The other one was more suitable for characterization of SPLBs formed on<br />
the polycarbonate membrane pores. This circuit was similar to the simpler one, but<br />
additionally, a parallel combination of one capacitor and one resistor was added to the<br />
first capacitor (series-connected) [15].<br />
- 197 -
XI. Workshop of Physical Chemists and Electrochemists´11 Brno<br />
3. RESULTS AND DISCUSSION<br />
The transporting processes of heavy metals – lead and cadmium - across the<br />
model SPLB will be characterized in this contribution. The described experiments<br />
were realized using model membranes, however, the conditions of the experiments<br />
were very similar to those in real nature. The investigated cations were transported<br />
across the membrane using ion channels, which were formed by addition of<br />
ionophores calcimycin and valinomycin to the phospholipid solution. We investigated<br />
the roles and effects of presence of some other cations (K + , Ca 2+ , etc.) and of some<br />
small organic molecules on the transport.<br />
4. CONCLUSION<br />
In correspondence with the earlier published results [1,3,4,6,7] and with the<br />
results published in this contribution, it can be concluded that the model membranes<br />
in the form of SPLBs can be used for simulation of real cell membranes. The SPLB can<br />
be considered as completely formed in about 30-60 minutes after application of<br />
phospholipids on the support holder. In case of agar support are the times a bit<br />
shorter. The values of its capacitances increase after the SPLB exposure to the aqueous<br />
phase till steady state is reached. Application of voltage equal or higher than ±0.5 V<br />
can destroy the consistency of the SPBL irreversibly. The results achieved using DPPC<br />
are almost equivalent to those achieved using DPPE. The results from both tested cell<br />
types (“U-cell” and “Insert”) differ only negligibly and from the statistical point of<br />
view they are equivalent.<br />
It was proved that the transporting processes are relatively complicated, because<br />
they can be affected by many parameters (e.g., pH, applied voltage, composition of the<br />
intracellular and extracellular solutions, and presence of other cations). The presence<br />
Ca2+ cations plays very important role in case of the incorporation calcimycin<br />
ionophore channels.<br />
5. ACKNOWLEDGEMENT<br />
The work has been supported by the GA AV CR by the project No.<br />
IAA400400806 and by the GA ČR by the project No. P206/11/1638.<br />
6. REFERENCES<br />
[1] Navratil, T.; Sestakova, I.; Jaklova Dytrtova, J.; Jakl, M.; Marecek, V.: WSEAS Transactions on<br />
Environment and Development, 6 (2010), 3, pp. 208-19.<br />
[2] Navratil, T.; Sestakova, I.; Jaklova Dytrtova, J.; Jakl, M.; Marecek, V. In 7th WSEAS International<br />
Conference on Environment, Ecosystems and Development; Otesteanu, M.; Celikyay, S.;<br />
Mastorakis, N.; Lache, S.; Benra, F. K., Eds.; World Scientific and Engineering Acad. and Soc.:<br />
Puerto de la Cruz, SPAIN, 2009, pp. 212-7.<br />
[3] Navratil, T.; Sestakova, I.; Stulik, K.; Marecek, V.: Electroanalysis, 22 (2010), 17-18, pp. 2043-50.<br />
[4] Sestakova, I.; Jaklova Dytrtova, J.; Jakl, M.; Navratil, T. In Development, Energy, Environment,<br />
Economics (DEEE '10); Mladenov, V.; Psarris, K.; Mastorakis, N.; Caballero, A.; Vachtsevanos,<br />
G., Eds.: Puerto de la Cruz, 2010, pp. 186-91.<br />
[5] Murray, R. K.; Granner, K. D.; Mayes, P. A.; Rodwell, V. W. Harper's Biochemistry; Appleton<br />
and Lange: Stamford, 1996, 873.<br />
- 198 -
XI. Workshop of Physical Chemists and Electrochemists´11 Brno<br />
[6] Navratil, T.; Sestakova, I.; Marecek, V. In Modern Electrochemical Methods XXIX; Barek, J.;<br />
Navratil, T., Eds.; BEST Servis: Jetrichovice, 2009, pp. 74-6.<br />
[7] Navratil, T.; Sestakova, I.; Marecek, V.; Stulik, K. In Modern Electrochemical Methods XXX;<br />
Barek, J.; Navratil, T., Eds.; BEST Servis: Jetrichovice, 2010, pp. 119-23.<br />
[8] Tien, H. T. Bilayer Lipid Membranes; Marcel Dekker, Inc.: New York, 1974.<br />
[9] Tien, H. T.; Salamon, Z.; Guo, D. L.; Ottovaleitmannova, A. In Active Materials and Adaptive<br />
Structures; Knowles, G. J., Ed.; Iop Publishing Ltd: Bristol, 1992, pp. 27-32.<br />
[10] Serrano, N.; Sestakova, I.; Diaz-Cruz, J. M.; Arino, C.: Journal of Electroanalytical Chemistry,<br />
591 (2006), 1, pp. 105-17.<br />
[11] Dorcak, V.; Sestakova, I.: Bioelectrochemistry, 68 (2006), 1, pp. 14-21.<br />
[12] Fojta, M.; Fojtova, M.; Havran, L.; Pivonkova, H.; Dorcak, V.; Sestakova, I.: Analytica Chimica<br />
Acta, 558 (2006), 1-2, pp. 171-8.<br />
[13] Yosypchuk, B.; Sestakova, I.; Novotny, L.: Talanta, 59 (2003), 6, pp. 1253-8.<br />
[14] Sestakova, I.; Navratil, T.: Bioinorganic Chemistry and Applications, 3 (2005), 1-2, pp. 43-53.<br />
[15] Navratil, T.; Sestakova, I.; Marecek, V. In Development, Energy, Environment, Economics<br />
(DEEE '10); Mladenov, V.; Psarris, K.; Mastorakis, N.; Caballero, A.; Vachtsevanos, G., Eds.:<br />
Puerto de la Cruz, 2010, pp. 192-7.<br />
- 199 -
XI. Workshop of Physical Chemists and Electrochemists´11 Brno<br />
OPTICAL CHARACTERIZATION OF<br />
ORGANIC SEMI-CONDUCTORS<br />
Imad OUZZANE 1 , Martin ŠEDINA 1 , Patricie HEINRICHOVÁ 1 , Martin VALA 1 ,<br />
Martin WEITER 1 .<br />
1 Brno University of Technology, Faculty of Chemistry, Purkyňova 118, Brno, Czech Republic,<br />
ouzzane@fch.vutbr.cz<br />
Abstract<br />
Several derivatives of diphenyl-diketo-pyrrolopyrrole and metal complex<br />
phtalocyanines where newly synthesized and proposed to be used in optical and<br />
optoelectronic devices. Our task was to afford valuable measuring methods for their<br />
intrinsic optical investigation and to compare the compounds properties according to<br />
their inner structure. For this optical characterization purposes, optical process were<br />
investigated like: Time resolved fluorescence, amplified spontaneous emission, one<br />
and two photon absorption and fluorescence quenching.<br />
1. INTRODUCTION<br />
Organic semiconductors are nowadays very attractive molecules to work with in<br />
industry as well as in research as their chemical advantages (flexibility, solubility,<br />
recyclability, and affordable materials etc.) are to be combined with their<br />
advantageous physical characteristics. Diphenyl-diketo-pyrrolopyrrole or DPP<br />
derivatives [1-3], phtalocyanines [4,5] like other newly synthesized possible<br />
chromophores are of a great interest for scientific community. Their synthetically<br />
changeable pendant substituents play a role on their optical properties and<br />
characteristics and this is the main task of our work as we draw out therefore and<br />
according to the results new model molecules to be synthesized towards optical or<br />
electrical needs. Indeed, as modern measuring and analyzing apparatus are getting<br />
more performing, we have the possibility to study and know better, optical as well as<br />
electronic characteristics of the relevant organic compounds. Here we will present<br />
some specific optical characteristics like two photon absorption, amplified<br />
spontaneous emission and fluorescence quenching of the proposed newly synthesized<br />
organic compounds.<br />
2. EXPERIMENT<br />
For the one and two photon emission spectra of DPP derivatives experiment, we<br />
prepared different concentrated solutions of DPP solubilized in different organic<br />
solvents. The exciting wavelength used for two photon excitation was the<br />
fundamental wavelength from a picosecond laser at 1064nm. The beam was then<br />
concentrated trough a focalizing lens to the very middle of the sample and the<br />
emission signal was then collected via hyperbolic mirrors that focused emitted<br />
photons to the spectrograph and ICCD camera input slit.<br />
- 200 -
XI. Workshop of Physical Chemists and Electrochemists´11 Brno<br />
For the amplified spontaneous emission [6,7] experiment we had to prepare thin<br />
layers of common transparent polymer doped with DPP derivatives. As for and to do<br />
so, we diluted a maximum amount of DPP with the housing polymer in a minimum<br />
amount of solubilizing solvent. The thin layer were then prepared by spin coating and<br />
then measured with an exciting angle of 90 degrees formed between the incident<br />
beam (3rd harmonics at 355nm) and the planar thin film serving as a waveguide.<br />
For the dynamic and static quenching [8] of phtalocynines, compounds were<br />
prepared in solution with a growing concentration of quencher C60.<br />
3. RESULTS AND DISCUSSION<br />
The emission spectra after one and two photon excitation and amplified<br />
spontaneous emission of DPP derivatives are shown in Figure 1. The results obtained<br />
clearly show that the quadrupolar donor-acceptor-donor character of the substituted<br />
DPP led to the observable fluorescence signal after two photon absorption. The nonlinear<br />
optical behavior was therefore achieved by this modification.<br />
The ASE signal (Figure 1 right) is obtained by illuminating a narrow stripe of the<br />
thin film (serving as waveguide) with laser pulse. In the longer direction of the<br />
waveguide, the light emission is synchronized, causing lasing action. With the<br />
substituted donating groups R1R2 derivative (see Figure 1 left) we could obtain<br />
significantly reasonable spectral narrowing (the FWHM was found to be around 12<br />
nm).<br />
The fluorescence quenching experiments were used to evaluate the extent of<br />
charge transfer from the electron donor (pthalocyanine in this case) and electron<br />
acceptor (C60 in this study). The outcomes can serve as a guide in order to predict the<br />
ability of the system to convert light into electricity in bulk heterojunction organic<br />
solar cells. The experiments are demonstrated in Figure 2. We achieved strong<br />
fluorescence quenching comparable with the conventional P3HT:PCBM organic solar<br />
cells.<br />
R 1<br />
O<br />
R3 N N<br />
O<br />
R 4<br />
A, Pl EMM (-)<br />
1<br />
0.9<br />
0.8<br />
0.7<br />
0.6<br />
0.5<br />
0.4<br />
0.3<br />
0.2<br />
0.1<br />
2PE<br />
1PE<br />
Abs<br />
0<br />
400 450 500 550 600 650 700 750<br />
wavelength (nm)<br />
R 2<br />
Fig.1 (Left) General formula of the basic diketo-pyrrolo-pyrrole used as parent<br />
molecule in this study. (Middle) Absorption, one photon and two photon<br />
fluorescence of substituted DPP with donating groups R1R2. (Right) One<br />
photon fluorescence and amplified spontaneous emission signal of the<br />
substituted DPP.<br />
- 201 -<br />
Normalized Intensity<br />
1,0<br />
0,8<br />
0,6<br />
0,4<br />
0,2<br />
0,0<br />
-0,2<br />
300 400 500 600 700 800 900 1000<br />
Wavelength<br />
DPP Input 4<br />
DPP Input 40
XI. Workshop of Physical Chemists and Electrochemists´11 Brno<br />
Fluorescence (arb.u.)<br />
4<br />
2<br />
650 700 750 800<br />
Wavelength (nm)<br />
- 202 -<br />
F 0 /F<br />
3<br />
2<br />
1<br />
experimental data<br />
after calibration<br />
0 1 2 3<br />
[C ]x10 60 5 (mol/l)<br />
Fig.2 (left) Fluorescence quenching of phtalocynines compounds (Pc): The<br />
fluorescence decrease with increasing concentration of quencher (C60) and the<br />
Stern-Volmer plot of mixture of Pc and water-soluble derivative of C60<br />
obtained from the fluorescence emission (right) before (circles) and after<br />
correction on the re-absorption effect (squares).<br />
4. CONCLUSION<br />
We have modified several organic molecules in order to obtain their non-linear<br />
optical behavior, amplified spontaneous emission and to use them in organic solar<br />
cells. The NLO properties were demonstrated for donating groups substituted in R1R2<br />
position of DPP. The lasing action was also achieved for this particular substituted<br />
derivative. Furthermore, the utilization of fluorescence quenching method to predict<br />
solar conversion efficiency was demonstrated.<br />
5. ACKNOWLEDGEMENT<br />
The work has been supported by MŠMT (OP VaVpI) via project Centres for<br />
materials research at FCH BUT No. CZ.1.05/2.1.00/01.0012.<br />
6. REFERENCES<br />
[1] M. Vala, M. Weiter, J. Vynuchal, P. Toman, S. Lunak Jr., J. Fluoresc (2008) 18:1181-1186.<br />
[2] M. Vala, J. Vynuchal, P. Toman, M. Weiter, S. Lunak Jr., Dyes and Pig. 84 (2010) 176-182.<br />
[3] S. Lunak Jr., J. Vynuchal, M. Vala, L. Havel, R. Hrdina.<br />
[4] Nalwa, H. S.; Shirk, J. S. In Phtalocyanines, Properties and Applications, Leznoff, C. C., Lever, A.<br />
B. P., Eds.; New York, 1996; Vol. 4, pp 83-181 and references therein.<br />
[5] K. Rieko, K. Masahiro, Mol. Cryst., 1998, Vol. 315, pp. 169-174.<br />
[6] G. H. Gelinck, J. M. Warman, M. Remmers, D. Neher, Chemical Physics Letters 265 (1997) 320-<br />
326.<br />
[7] M. McGehee, R. Gupta, S. Veenstra, E. K. Miller, M. A. Diaz-Garcia, and A. J. Heeger, Physical<br />
Review B, Volume58, Number 11.<br />
[8] Principles of Fluorescence Spectroscopy, Third Edition, Joseph R. Lakowicz
XI. Workshop of Physical Chemists and Electrochemists´11 Brno<br />
ELECTROCHEMISTRY OF<br />
BIOMACROMOLECULES. TRENDS IN<br />
PROTEIN ANALYSIS<br />
Emil PALEČEK 1 , Veronika OSTATNÁ 1 , Hana ČERNOCKÁ 1 , Mojmír TREFULKA 1 ,<br />
Martin BARTOŠÍK 1<br />
1 Institute of Biophysics, Academy of Sciences of the Czech Republic, v.v.i., Královopolská 135, 612 65<br />
Brno, Czech Republic<br />
Abstract<br />
In recent decades electrochemistry of proteins has dealt mainly with conjugated<br />
proteins containing non-protein redox centers, being thus limited to a small fraction<br />
of proteins investigated by proteomics. Recently we have shown that using the<br />
constant current chronopotentiometric stripping (CPS) in combination with bare<br />
mercury electrodes practically all proteins produce the so-called peak H, which is due<br />
to the catalytic hydrogen evolution reaction. Peak H differs from the previously<br />
studied electrochemical responses of proteins (i) by its ability to detect proteins down<br />
to nanomolar and subnanomolar concentrations (ii) by high sensitivity to changes in<br />
protein structures; (iii) by small requirement for the sample volumes - in ex situ<br />
experiments, few l drops of protein solution are sufficient for the analysis, allowing<br />
protein determination at femtomole or attomole levels. DTT-modified electrodes were<br />
recently applied for studies of wt and mutant p53 proteins.<br />
1. ELECTROCHEMICAL ANALYSIS IN GENOMICS AND PROTEOMICS<br />
Recent advances in genomics, proteomics and glycomics require large amounts<br />
of data regarding human genomes, protein expression, posttranslational modification<br />
of proteins, DNA and RNA, etc. Among the current techniques used in genomics,<br />
electrochemical (EC) sensing of DNA is gaining ground while EC analyses of proteins<br />
and carbohydrates for proteomics or glycomics, respectively have developed rather<br />
slowly.<br />
2. ELECTROCHEMISTRY OF PROTEINS<br />
In recent decades electrochemistry of proteins focused on conjugated proteins<br />
containing non-protein redox centers [1,2]. This interesting part of<br />
bioelectrochemistry has been limited to a small fraction of thousands proteins studied<br />
by proteomics.<br />
2.1 Constant current chronopotentiometric stripping with mercury<br />
electrodes<br />
The first paper on electrochemistry of proteins was published more than 80<br />
years ago (3). It was based on the ability of proteins to catalyze hydrogen evolution at<br />
the dropping mercury electrode (DME) yielding the d.c. polarographic “presodium<br />
- 203 -
XI. Workshop of Physical Chemists and Electrochemists´11 Brno<br />
wave”. This wave appeared too close to the background discharge and was thus poorly<br />
developed and considered of little use in protein analysis. The history of this discovery<br />
was already reviewed (e.g. 4 and references therein).<br />
Recently we have shown that using the constant current chronopotentiometric<br />
stripping (CPS) in combination with bare mercury electrodes practically all proteins<br />
produce the so-called peak H, which is due to the catalytic hydrogen evolution<br />
reaction (CHER) [5, 6]. Peak H differs from the previously studied electrochemical<br />
responses of proteins (i) by its ability to detect proteins down to nanomolar and<br />
subnanomolar concentrations; (ii) by high sensitivity to changes in protein structures;<br />
(iii) by small requirement for the sample volumes - in ex situ experiments, few l<br />
drops of protein solution are sufficient for the analysis, allowing protein<br />
determination at femtomole or lower levels.<br />
2.1.1 Denaturation of proteins at mercury surfaces can be avoided<br />
Until recently an opinion prevailed in the literature that proteins are denatured<br />
when adsorbed at bare mercury and other metal surfaces [7]. We have shown that<br />
proteins are not denatured when adsorbed at bare HMDE at open current potential<br />
but that their denaturation may occur when the electrode is charged to potentials<br />
negative to the potential of zero charge (p.z.c.) [6, 8, 9]. Such surface denaturation can<br />
be avoided if high speed of the electrode charging to negative potentials and proper<br />
ionic conditions are used [8]. For example, we have found that bovine serum albumin<br />
(BSA) and other proteins behaved in CPS experiments as native in 50 mM but not in<br />
200 mM sodium phosphate, pH 7 (Fig. 1A,B). We used CPS to study aggregation of -<br />
synuclein (the protein important in Parkinson’s disease), and detected changes in the<br />
interfacial behavior of this protein preceding the fibril formation [10].<br />
CPS analysis of proteins at DTT-modified Hg electrodes<br />
Dithiothreitol (DTT)-mercury and DTT-solid amalgam electrodes were proposed<br />
for protein microanalysis by means of CPS (11). At the DTT-modified hanging<br />
mercury drop electrode (DTT-HMDE) proteins produced CPS peak H, due to the<br />
CHER. Self-assembled monolayers (SAMs) of DTT at the electrode protected surfaceattached<br />
proteins from the electric field-driven denaturation, but did not interfere<br />
with the CHER. Using CPS peak H denatured (using urea or guanidium chloride) and<br />
native forms of BSA and of other proteins were easily distinguished. In contrast, in<br />
usual voltammetric measurements (scan rates between 50 mV and 1 V/s) the adsorbed<br />
BSA behaved as fully or partially denatured. In CPS, which uses highly negative<br />
stripping currents causing high current densities (~-7.5 mA/cm 2 at Istr -30 mA),<br />
changes in potential are very fast (e.g. ~250 V/s) and the protein denaturation at<br />
negatively charged surfaces (occurring in the voltammetric experiments) is prevented.<br />
BSA-modified DTT-HMDE was exposed to different potentials, EB, for 60 s, followed<br />
by CPS measurement. Three EB regions were found, in which either BSA remained<br />
native (A, -0.1 to -0.3 V), was denatured (B, -0.35 V to -1.4 V) or underwent<br />
desorption (C, at potentials more negative than -1.4 V). At potentials more positive<br />
than the reduction potential of the DTT Hg-S bond, the densely packed DTT SAM<br />
- 204 -
XI. Workshop of Physical Chemists and Electrochemists´11 Brno<br />
was impermeable to [Ru(NH3)6] 3+ . At more negative potentials the DTT SAM was<br />
disturbed but under conditions of CPS this SAM still protected the protein from the<br />
denaturation. Thiol-modified Hg electrodes in combination with CPS appear<br />
attractive as a new tool for protein analysis in biomedicine and proteomics.<br />
2.1.3 Peak H responds to changes in p53 resulting from structural changes<br />
in mutants<br />
CPS peak H obtained with DTT-HMDE has been applied in studies of tumor<br />
suppressor wild type (wt) and mutant p53 proteins [12]. CPS responses of wt and<br />
mutant p53 showed correlation with structural and stability data and provided<br />
additional insights into the differential dynamic behavior of the proteins immobilized<br />
at electrically charged surfaces. The loss of zinc ion either due to mutation in R175H<br />
or to treatment of wt p53 with a chelating agent were monitored. It is expected that<br />
this CPS method can be useful in screening of p53-specific drugs for future cancer<br />
treatment.<br />
2.1.4 Solid amalgam electrodes for protein analysis<br />
Sensing of proteins is based on their ability to catalyze hydrogen evolution at Hg<br />
electrodes. Liquid mercury electrodes are excellent tools for basic electrochemical<br />
research but their application in sensors and arrays for highly parallel analysis is<br />
rather inconvenient. We showed that some solid mercury amalgam electrodes (SAE)<br />
can be used in the analysis of proteins and oligo- and polysaccharides. Recently<br />
developed silver SAE arrays [13] in diameter of 400 mm and thickness of < 1 mm are<br />
as little toxic as dental amalgams but compared to the tooth filling, the amount of Hg<br />
in the whole array is negligible. Our preliminary results suggest that these arrays can<br />
be modified with DTT and other thiols representing an alternative to the DTT-<br />
HMDE. Thus SAEs, with the unique potential window of Hg electrodes allowing<br />
studies at highly negative potentials necessary for CHER, open the door for protein<br />
analysis in biomedicine and proteomics using biosensors and arrays.<br />
3. CONCLUSION<br />
Electroactivity of proteins and nucleic acids has been known for more than 80<br />
(3,4) and 50 years, respectively, while until recently poly- and oligosaccharides were<br />
considered as non-electroactive and attracted little attention of electrochemists.<br />
Recently we have demonstrated electroactivity in some polysaccharides (14). We have<br />
also shown that using Os(VI) complexes electroactive labels can be easily introduced<br />
in various poly- and oligosaccharides (15-17). CPS analysis of proteins with liquid and<br />
solid Hg electrodes opens the door for application of electrochemical methods in<br />
biomedicine and proteomics. Chemical modification of these electrodes makes them<br />
particularly attractive for protein structure analysis.<br />
In this lecture I wish to present our recent results dealing with CPS analysis of<br />
proteins obtained with bare and DTT-modified Hg electrodes and briefly summarize<br />
our studies based on chemical modification and EC analysis of poly- and<br />
oligosaccharides and ribose residues in RNA shown in companion posters and papers<br />
(15-18).<br />
- 205 -
XI. Workshop of Physical Chemists and Electrochemists´11 Brno<br />
4. ACKNOWLEDGEMENT<br />
Support from the GACR P301/11/2055, Res. Centre LC06035 and the IBP<br />
Research Plans Nos. AV0Z50040507 and AV0Z50040702 is acknowledged.<br />
5. REFERENCES<br />
[1] O. Hammerich and J. Ulstrup, Bioinorganic Electrochemistry, Dordrecht: Springer, 2008.<br />
[2] E. Palecek, F. Scheller and J. Wang, Electrochemistry of nucleic acids and proteins. Towards<br />
electrochemical sensors for genomics and proteomics, 1 ed., Vol. 1. Amsterdam: Elsevier, 2005.<br />
[3] J. Heyrovsky and J. Babicka, "Polarographic studies with the dropping mercury cathode. Part XIII.<br />
Effect of albumins", Coll. Czech. Chem. Commun., Vol. 2, p. 370, 1930.<br />
[4] E. Palecek, M. Heyrovsky, B. Janik, D. Kalab, Z. Pechan, "From dc polarographic presodium wave of<br />
proteins to electrochemistry of biomacromolecules," Coll. Czech. Chem. Commun., Vol. 74, pp.<br />
1739-1755, 2009.<br />
[5] E. Palecek, "Electroactivity of proteins. Possibilities in biomedicine and proteomics," in<br />
Electrochemistry of Nucleic Acids and Proteins. Towards Electrochemical Sensors for Genomics<br />
and Proteomics, E. Palecek, F. W. Scheller and J. Wang, Eds. Amsterdam: Elsevier, 2005, pp.<br />
690-750.<br />
[6] E. Palecek and V. Ostatna, "Electroactivity of nonconjugated proteins and peptides. Towards<br />
electroanalysis of all proteins," Electroanalysis, Vol. 19, pp. 2383-2403, 2007.<br />
[7] F. A. Armstrong, "Voltammetry of proteins," in Bioelectrochemistry, Vol. 9, G. S. Wilson, Ed.<br />
Weinheim: Wiley-VCH, 2002, pp. 11-29.<br />
[8] E. Palecek and V. Ostatna, "Ionic strength-dependent structural transition of proteins at electrode<br />
surfaces," Chem. Commun., pp. 1685-1687, 2009.<br />
[9] E. Palecek and V. Ostatna, "Potential-dependent surface denaturation of BSA in acid media,"<br />
Analyst, Vol. 134, pp. 2076-2080, 2009.<br />
[10] E. Palecek, V. Ostatna, M. Masarik, C. W. Bertoncini and T. M. Jovin, "Changes in interfacial<br />
properties of -synuclein preceding its aggregation," Analyst, Vol. 133, pp. 76-84, 2008.<br />
[11] V. Ostatna, H. Cernocka and E. Palecek, "Protein Structure-Sensitive Electrocatalysis at<br />
Dithiothreitol-Modified Electrodes," J. Am. Chem. Soc., Vol. 132, pp. 9408-9413, 2010.<br />
[12] E Paleček, V Ostatná, H Černocká, A C. Joerger, A R. Fersht, Electrocatalytic monitoring of<br />
metal binding and mutation-induced conformational changes in p53 at picomole level. J.<br />
Am. Chem Soc. 2011, in press.<br />
[13] P. Juskova, V. Ostatna, E. Palecek and F. Foret, "Fabrication and Characterization of Solid<br />
Mercury Amalgam Electrodes for Protein Analysis," Anal. Chem., Vol. 82, pp. 2690-2695,<br />
2010.<br />
[14] S. Strmečki, M. Plavšić, B. Ćosović, V. Ostatná and E. Palecek, "Constant current<br />
chronopotentiometric stripping of sulphated polysaccharides," Electrochem. Commun., Vol.<br />
11, pp. 2032-2035. 2009.<br />
[15] M. Trefulka and E. Palecek, "Voltammetry of Os(VI)-modified polysaccharides at carbon<br />
electrodes," Electroanalysis, Vol. 21, pp. 1763 – 1766, 2009.<br />
[16] M. Trefulka and E. Paleček, "Voltammetry of Os(VI)-Modified Polysaccharides,"<br />
Electroanalysis, Vol. 22, pp. 1837-1845, 2010.<br />
[17] E. Paleček and M. Trefulka, "Electrocatalytic detection of polysaccharides at picomolar<br />
concentrations," Analyst, Vol. 136, pp. 321-326, 2011.<br />
[18] M. Trefulka, M. Bartošík, E. Paleček, "Facile end-labeling of RNA with electroactive Os(VI)<br />
complexes," Electrochem. Commun., Vol. 12, pp. 1760-1763, 2010.<br />
- 206 -
XI. Workshop of Physical Chemists and Electrochemists´11 Brno<br />
THE STUDY OF 6 –<br />
BENZYLAMINOPURINE AND ITS<br />
DERIVATIVES BY ELECTROCHEMICAL<br />
AND SPECTRAL METHODS<br />
Iveta PILAŘOVÁ 1 , Sylvie HOLUBOVÁ 1 , Zdeňka BALCAROVÁ 1 , Núria SERRANO 2 ,<br />
Libuše TRNKOVÁ 1<br />
1 Department of Chemistry, Faculty of Science, Masaryk University, Kotlářská 2, 611 37 Brno, Czech<br />
Republic<br />
2 Departament de Química Analítica, Facultat de Química, Universitat de Barcelona, Martí i Franquès 1-<br />
11, E – 08028 – Barcelona, Spain<br />
Abstract<br />
Electrochemical and spectral behaviors of 6 – benzylaminopurine (6 – BAP) and its<br />
chlorine and methoxy derivatives have been studied by voltammetry, potentiometry<br />
and spectrophotometry. Using linear sweep voltammetry (LSV) in connection with a<br />
mercury electrode the reduction peaks of BAPs were observed. On the other hand,<br />
using elimination voltammetry with linear scan (EVLS) the differences in the<br />
reduction processes of derivatives studied were found. The EVLS confirmed the<br />
electron transfer in an adsorbed state. The pH value of water-methanol solutions was<br />
chosen according to the protonation constants of BAPs determined by both<br />
potentiometric and UV-Vis spectrophotometric titrations. The effect of methanol<br />
content and temperature on pKa values of 6-BAP was monitored.<br />
1. INTRODUCTION<br />
Cytokinins (CKs) are phytohormones which play very important role in the<br />
development and growth processes of plants. Together with auxins are involved in the<br />
regulation of cell division 1 . One of the most important aromatic cytokinins, 6 –<br />
benzylaminopurine (6 – BAP), has been recently investigated electrochemically on a<br />
mercury electrode 2 . Nowadays, the attention is focused on its methoxy and chlorine<br />
derivatives due to their antitumor activity. These derivatives can be considered as<br />
potential cytostatics 3-6 .<br />
The aim of our research was the studying of electrochemical and spectral<br />
behavior of 6 – BAP and its methoxy and chlorine derivatives. We used voltammetric<br />
methods (linear sweep and elimination voltammetry on a mercury electrode) allowing<br />
determining the reduction potentials of benzylaminopurines and predicting their<br />
electrode process mechanisms. To investigate of the electrode process, elimination<br />
voltammetry with linear scan (EVLS) is suitable. It is able to eliminate some selected<br />
current components (diffusion, charging or charging) and conserve the other ones<br />
from the total voltammetric current. The procedure is represented by EVLS current<br />
function as a linear combination of total currents measured at different scan rates. The<br />
- 207 -
XI. Workshop of Physical Chemists and Electrochemists´11 Brno<br />
best EVLS sensitivity is achieved by the function eliminating kinetic and charging<br />
current components {f (I) = 17.485 I - 11.657 I1/2 - 5.8584 I2 } for the reduction or<br />
oxidation process proceeding in an adsorbed state 7-10 . For the study of redox behavior<br />
of 6-BAP and its derivatives on mercury electrode it is important to know their<br />
protonation equilibria and due to this fact we determined the protonation constants<br />
(pKa) using potentiometric and spectral methods (UV-Vis).<br />
2. EXPERIMENT<br />
Using linear sweep voltammetry (LSV) the reduction behavior of 6 -<br />
benzylaminopurine and its chlorine and methoxy derivatives has been investigated.<br />
The measurements were performed using the analyzer Autolab 20 EcoChemie<br />
connected with the VA Stand 663 and controlled by GPES manager software. The<br />
main part of this apparatus was electrochemical vessel equipped with three electrodes,<br />
in which all voltammetric measurements were carried out. The mercury drop<br />
electrode with effective area 0.4 mm 2 performed the function of working electrode, an<br />
argent chloride electrode (Ag/AgCl/3MKCl) and a platinum wire were the reference<br />
and counter electrode, respectively. The samples of analyzed derivatives (most often<br />
1·10 -5 M) were prepared in the phosphate – acetate buffer with pH ranging from 4.53<br />
to 6.69 and with addition of 10 (v/v) percentages of CH3OH. The ionic strength was<br />
set to 0.1 M by NaCl. For the study of concentration dependences of 6-BAP, the<br />
concentration range from 1·10 -5 to 0.5· 10 -4 M of 6-BAP in phosphate - acetate buffer<br />
(pH 2.8) with 10(v/v) percentages of CH3OH and with ionic strength 0.1 M (NaCl) was<br />
used. Experimental conditions of LSV were following: the scan potential was from -<br />
1.1 V to -1.7 V, the time of conditioning of electrode was 2 seconds, the potential step<br />
was 2 mV. The LSV curves were measured at different scan rates from 100 to 800<br />
mV/s. All voltammetric measurements were performed in inert atmosphere (argon)<br />
and at room temperature. Three of these curves with integer 2 (1/2, 1, and 2 multiple<br />
of reference scan rate) were taken for EVLS procedure.<br />
The potentiometric titrations were carried out using an automatic titration<br />
apparatus Titrando 835 controlled with Tiamo 1.2 software. The potential change<br />
during the titration was measured with the combined ISE electrode LL Ecotrode plus.<br />
All measurements were carried out in a tempered 50 mL tube in inert argon<br />
atmosphere. The potentiometric titrations were proceeded using the standard titration<br />
solution of 0.1 M NaOH, prepared in CH3OH (from 5 to 20 v/v percentages of<br />
CH3OH), in the temperature range from 15 to 37 °C. The ionic strength was set to I =<br />
0.1 M with NaCl. The concentration of analyzed samples was 1·10 -4 M.<br />
The spectrophotometric titration was acidimetric titration of alkaline sample<br />
(pH 11, I=0.1 M) by acidic sample (pH 2, I=0.1M) in 1 cm quartz cuvette. The starting<br />
volume was 1.5 mL and after each addition of the acidic sample the absorption<br />
spectrum (UV-Vis) using spectrophotometer UNICAM UV 4, connected with Vision<br />
32 software, was measured. After measuring of each spectrum, the actual pH value<br />
using LL Biotrode and pH meter CyberScan PCD 6500 was determined. The<br />
spectrophotometric titrations were performed in 10 (v/v) percentages of CH3OH. The<br />
- 208 -
XI. WWorkshop<br />
of Phyysical<br />
Chemists and Electrocheemists´11<br />
sammples<br />
of 6-BBAP<br />
and its derivativess<br />
were prep pared with concentrattion<br />
of 3.66 6·10<br />
Spectroscopic<br />
data were e exportedd<br />
to EQUI ISPEC (MA ATLAB) an and the va<br />
prottonation<br />
coonstants<br />
(pK Ka) were caalculated.<br />
-5 M.<br />
alues of<br />
3. RESULTTS<br />
AND DISCUSSI<br />
D ION<br />
6-BAP annd<br />
its deriv vatives (Cl-and<br />
-OCH3 3) were stud died by botth<br />
equilibri ium and<br />
dynnamic<br />
electtrochemica<br />
al methodss<br />
(potentiometry<br />
and d voltamme metry) and by UV<br />
absoorption<br />
speectra.<br />
While<br />
potentiommetric<br />
and spectral ex xperiments provided the t data<br />
for the deterrmination<br />
of pKa, vvoltammetri<br />
ic experim ment (LSV and EVLS)<br />
gave<br />
eviddence<br />
abouut<br />
the electr ron transferr<br />
in the pro ocess of redu uction.<br />
LSVV<br />
AND EVLLS<br />
VOLTAM MMETRY<br />
The LSVV<br />
experiment<br />
was perrformed<br />
in phosphoric<br />
– acetic buffer (pH H 4.1) in<br />
10% % (v/v) CH33OH.<br />
The pH<br />
value waas<br />
chosen according<br />
to o pKa valuees<br />
ensuring the fact<br />
thatt<br />
derivativees<br />
are in protonated<br />
foorms<br />
requir red for thei ir reductionn.<br />
Reductio on BAPs<br />
signnals<br />
were oobserved<br />
at t the potenntial<br />
app. -1300<br />
mV. Figs. 1 andd<br />
2 show LSV L and<br />
EVLLS<br />
curves oof<br />
2-, 3-, an nd 4- Cl BAAPs,<br />
Figs.3 and a 4 show w LSV and EEVLS<br />
curves<br />
of 2-,<br />
3-, aand<br />
4- OCHH3<br />
BAPs. Both<br />
types oof<br />
derivativ ves yield EV VLS peak–coounterpeak<br />
k signals<br />
indiicating<br />
the electrode process p in aan<br />
adsorbed<br />
state. Mo oreover, in the case of f 2- and<br />
4-mmethoxy<br />
deerivatives<br />
we w can obbserve<br />
the second sm mall peak in more negative n<br />
poteentials.<br />
Thiis<br />
new proc cess will be studied in our further r research.<br />
Fig. .1: LSV of cchlorine<br />
der rivatives off<br />
6 – BAP<br />
Fig. .2: EVLS oof<br />
chlorine e derivativves<br />
of 6 –<br />
in 10% (v/v) CH3O OH (pH 4.1)<br />
- 209 -<br />
BAP in 10% 1 (v/v)<br />
Brno<br />
CH3OH (p pH 4.1)
XI. Workshhop<br />
of Physical l Chemists and Electrochemists<br />
E<br />
s´11<br />
Fig.3: LLSV<br />
of methhoxy<br />
deriva atives of 6 – BAP<br />
Fig.4: EEVLS<br />
of mmethoxy<br />
de erivatives of 6 – BA AP in 10% % (v/v) CHH3OH<br />
(pH 4.1)<br />
in 10% (v/vv)<br />
CH3OH (pH ( 4.1)<br />
POTENNTIOMETRRIC<br />
TITRAT TION<br />
The<br />
protonaation<br />
consta ants pKa1 annd<br />
pKa2 of 6-BAP 6 were<br />
influenceed<br />
by methanol<br />
contentt<br />
and tempperature<br />
(T Tab.1) and with incre easing of th hese parammeters<br />
both pKa<br />
values decrease. TThe<br />
tempe erature deppendence<br />
of o pKa allow wed the thhermodyna<br />
amic<br />
evaluattion<br />
of prottonation-de<br />
eprotonatioon<br />
equilibri ium. Therm modynamicc<br />
functions ∆H,<br />
∆S and ∆G in the dependenc ce on the mmethanol<br />
co ontent are presented p inn<br />
Tab.2. While W<br />
the vallues<br />
∆G aree<br />
practicall ly same witth<br />
v/v perc centages of f methanoll,<br />
enthalpy and<br />
entropyy<br />
of the deeprotonatio<br />
on process oof<br />
BAP, in ndicating an n exothermmic<br />
process, , are<br />
changed<br />
with diffferent<br />
cont tent of metthanol.<br />
Acc cording calc culated valuues<br />
of enth halpy<br />
and enttropy<br />
is alsoo<br />
evident th hat increasiing<br />
content t of methan nol causes aan<br />
increasin ng of<br />
disordeered<br />
protonnation<br />
state and the neegative<br />
valu ues of entropy<br />
are obtaained<br />
(Table<br />
2).<br />
Tab. 1: : The influuence<br />
of pK Ka values oon<br />
the tem mperature for f 6 – BAAP<br />
in diffe erent<br />
content of CH3OH at I = 0.1 M<br />
t<br />
[°C]<br />
15<br />
20<br />
25<br />
30<br />
37<br />
pKa1<br />
4.16 ±<br />
0.03<br />
4.10 ±<br />
0.03<br />
4.08 ±<br />
0.03<br />
4.02 ±<br />
0.02<br />
3.98 ±<br />
0.03<br />
5% CH3OH<br />
pKa2 2 pKKa1<br />
10.96 ± 4.002<br />
±<br />
0.06 0. .03<br />
10.80 ± 3.996<br />
±<br />
0.06 0. .02<br />
10.75 ± 3.888<br />
±<br />
0.08 0. .04<br />
10.70 ± 3.880<br />
±<br />
0.07 0. .01<br />
10.57 ± 3.771<br />
±<br />
0.07 0. .02<br />
10% CH3O OH<br />
- 210 -<br />
pKa2<br />
10 0.76±0.0<br />
8<br />
10 0.71±0.0<br />
8<br />
10 0.63±0.0<br />
7<br />
10 0.59±0.0<br />
6<br />
10 0.49±0.0<br />
8<br />
pKa1<br />
3.98 ±<br />
0.01<br />
3.93 ±<br />
0.02<br />
3.83 ±<br />
0.02<br />
3.77 ±<br />
0.03<br />
3.67 ±<br />
0.02<br />
20% % CH3OH<br />
pKa2 2<br />
10.55 ±<br />
0.07 7<br />
10.44 ±<br />
0.06 6<br />
10.36 ±<br />
0.08 8<br />
10.33 ±<br />
0.07 7<br />
10.22 ±<br />
0.07 7<br />
Brno
XI. Workshop of Physical Chemists and Electrochemists´11 Brno<br />
Tab.2: Thermodynamic parameters of 6 – BAP at I = 0.1 M<br />
∆Hexp<br />
[kJ.mol -<br />
1 ]<br />
∆Sexp<br />
[J.K -1 .mol -<br />
1 ]<br />
∆Gexp<br />
[kJ.mol -<br />
1 ]<br />
SPECTROPHOTOMETRIC TITRATION<br />
The protonation constants pKa1 and pKa2 of 6-BAP and its derivatives<br />
determined by means of spectrophotometric titration and presented in Table 3 are in<br />
good accordance with pKa1 and pKa2 determined by means of potentiometric<br />
titrations. The table illustrates not only the effect of Cl or OCH3 substituent but also<br />
the effect of its position.<br />
Tab.3: pKa values calculated from measured UV – Vis spectra<br />
compound pKa1 pKa2<br />
BAP 4.22 ± 0.07 9.84 ± 0.05<br />
2´- Cl BAP 4.13 ± 0.05 9.84 ± 0.04<br />
3´- Cl BAP 4.06 ± 0.06 9.80 ± 0.04<br />
4´- Cl BAP 4.14 ± 0.05 9.83 ± 0.04<br />
2´- OCH3 BAP 4.56 ± 0.06 9.98 ± 0.04<br />
3´- OCH3 BAP 4.33 ± 0.05 9.83 ± 0.04<br />
4´- OCH3 BAP 4.51 ± 0.05 9.87 ± 0.03<br />
The spectral data processing is illustrated by the experiment of 2‘- Cl-BAP<br />
(Figs.5 and 6). Fig.5 shows the spectra recorded during the titration of sample and<br />
Fig.6 shows its concentration profile calculated by EQUISPEC in MATLAB<br />
environment.<br />
Absorbance [a.u.]<br />
1<br />
0.9<br />
0.8<br />
0.7<br />
0.6<br />
0.5<br />
0.4<br />
0.3<br />
0.2<br />
0.1<br />
4. CONCLUSION<br />
For the study of electrochemical and spectral behavior of 6 – BAP and its<br />
methoxy and chlorine derivatives voltammetry, potentiometry and<br />
spectrophotometry have been used. In linear sweep voltammetry (LSV) in connection<br />
- 211 -<br />
v/v<br />
percentages<br />
of CH3OH<br />
-13.89 31.33 -23.23 5<br />
-24.67 -8.53 -22.13 10<br />
-24.69 -9.33 -21.91 20<br />
Spectrum<br />
0<br />
220 230 240 250 260 270 280 290 300 310 320<br />
Wavelength [nm]<br />
Relative concentration<br />
3.5<br />
3<br />
2.5<br />
2<br />
1.5<br />
1<br />
0.5<br />
x 10-5<br />
4<br />
Concentration profile<br />
0<br />
3 4 5 6 7 8 9 10<br />
pH
XI. Workshop of Physical Chemists and Electrochemists´11 Brno<br />
with a mercury electrode the reduction peaks of BAPs were observed. The pH value<br />
of water-methanol solutions was chosen according to the protonation constants of<br />
BAPs determined by both potentiometric and UV-Vis spectrophotometric titrations.<br />
Using elimination voltammetry with linear scan (EVLS) the differences in the<br />
reduction processes of derivatives in adsorbed state were found. In the case of the<br />
methoxy derivatives of 6 – BAP LSV curves (measured at pH 4.1) indicate a new<br />
process which is visible only at 2‘-OCH3 BAP and at 4‘ – OCH3 BAP. The EVLS<br />
confirmed the electron transfer in an adsorbed state (peak – counter peak form). The<br />
effect of methanol content and temperature on pKa values of 6-BAP was monitored.<br />
According to the dependence of the content of methanol on pKa is evident that with<br />
increasing of the molar fraction of methanol in solution leads to decreasing of pKa<br />
values. Based on the dependence of pKa on the temperature it was possible to<br />
determine the thermodynamic parameters (enthalpy and entropy). It was found that<br />
ΔS becomes more negative values with increasing content of methanol. Protonation<br />
constants determined by potentiometric titrations were compared with pKa values<br />
calculated from UV – Vis spectra.<br />
5. ACKNOWLEDGEMENT<br />
This work has been supported by projects INCHEMBIOL MSM0021622412,<br />
BIO-ANAL-MED LC06035 and MUNI/A/0992/2009 by the Ministry of Education,<br />
Youth and Sports of the Czech Republic.<br />
6. REFERENCES<br />
[1] Tarkowski, P.; Dolezal, K.; Strnad, M. Chem. Listy (2004), 98, 834.<br />
[2] Tarkowska, D.; Kotoucek, M.; Dolezal, K. Collect. Czech. Chem. Commun. (2003), 68, 1076.<br />
[3] Klanicova, A.; Travnicek, Z.; Vanco, J.; Popa, I.; Sindelar, Z. Polyhedron, 29, 2582.<br />
[4] Malon, M.; Travnicek, Z.; Marek, R.; Strnad, M. J. Inorg. Biochem. (2005), 99, 2127.<br />
[5] Malon, M.; Travnicek, Z.; Marysko, M.; Marek, J.; Dolezal, K.; Rolcik, J.; Strnad, M. Transit. Met.<br />
Chem. (2002), 27, 580.<br />
[6] Malon, M.; Travnicek, Z.; Marysko, M.; Zboril, R.; Maslan, M.; Marek, J.; Dolezal, K.; Rolcik, J.;<br />
Krystof, V.; Strnad, M. Inorg. Chim. Acta (2001), 323, 119.<br />
[7] Trnkova, L. Chem. Listy (2001), 95, 518.<br />
[8] Trnkova, L.; Jelen, F.; Petrlova, J.; Adam, V.; Potesil, D.; Kizek, R. Sensors (2005), 5, 448.<br />
[9] Trnkova, L.; Jelen, F.; Postbieglova, I. Electroanalysis (2003), 15, 1529.<br />
[10] Trnkova, L.; Kizek, R.; Dracka, O. Electroanalysis (2000), 12, 905.<br />
- 212 -
XI. Workshop of Physical Chemists and Electrochemists´11 Brno<br />
SPRAY-COATED WORKING ELECTRODES<br />
FOR ELECTROCHEMICAL SENSORS<br />
Jan PRÁŠEK 1 , Petra BUSINOVÁ 1 , Jana CHOMOUCKÁ 1<br />
1 Dept. of Microelectronics, Brno University of Technology, Technicka 10, 616 00 Brno, Czech Republic<br />
Abstract<br />
This paper is related to an area of electrochemical analytical systems. The problematic<br />
of three electrode planar systems miniaturization is discussed. Standard working<br />
electrode of three electrode thick film sensor have been modified using carbon<br />
nanotubes and deposited on the alumina substrate using spray-coating technique.<br />
Fabricated electrode was compared with commercial planar electrode and standard<br />
glassy carbon electrode resulting in better detection limit and sensitivity.<br />
1. INTRODUCTION<br />
Recently, the small analytical systems for electrochemical analyses are in the<br />
point of investigation [1]. Small, usually planar three-electrode systems are used<br />
instead of standard electrodes. The size of electrode area varies from units of square<br />
millimetres in case of thin film electrodes systems to tens of square millimetres in case<br />
of other electrodes systems (e.g. thick film electrodes on alumina substrate). In<br />
electrochemical analysis, the electrode systems miniaturization brings many problems<br />
as it was studied in [2]. The main problem is reduction of output signal which is equal<br />
to active size of working electrode due to active electrode area reduction. One<br />
possibility, how to solve this problem is to increase the active size of the electrode<br />
preserving the geometrical size of the working electrode (WE). It could be achieved<br />
by creation of nanostructures on electrode surface [3-5] which could increase the<br />
active electrode size several times. Electrochemical sensors with such nanostructures<br />
could be also used as a base for intelligent sensors [6].<br />
In this work we fabricated carbon nanotubes (CNTs) based spray-coated<br />
working microelectrodes for electrochemical sensors. Fabricated electrodes were<br />
examined optically using scanning electron microscopy and electrochemically on the<br />
detection of heavy metal ions in acetate buffer solution using differential pulse<br />
voltammetry (DPV). Obtained results were compared with standard glassy carbon<br />
electrode and commercial CNTs based electrochemical sensor.<br />
2. EXPERIMENT<br />
Working microelectrodes were fabricated using standard thick-film technology<br />
process on the alumina substrate. Thick-film pastes used for contact and covering<br />
layers were ESL 9562-G and ESL 4917 both from ESL Electroscience, UK. The<br />
working electrode was fabricated by spray-coating deposition using multiwalled<br />
carbon nanotubes (MWCNTs) powder as the filling material (parameters: OD=40-70<br />
nm, ID=5-40 nm, length=0.5 2 μm) and N-Methyl-Pyrrolidone (NMP) as a carrier and<br />
- 213 -
XI. Workshhop<br />
of Physical l Chemists and Electrochemists<br />
E<br />
s´11<br />
bindingg<br />
material. Sample of o fabricateed<br />
electrod de is show wn in the<br />
microgrraph<br />
of fabricated<br />
elec ctrode is shhown<br />
in the e figure 2.<br />
AAll<br />
of used chemicals were purcchased<br />
from<br />
Sigma Aldrich A (Stt.<br />
Louis, USA), U<br />
unless noted othherwise.<br />
Differential<br />
pulse volt tammetry (DPV) in range of the<br />
potentiial<br />
from -1 to 0 V wit th scan ratee<br />
of 50 mV V/sec was performed<br />
uusing<br />
PalmS Sens<br />
handheeld<br />
potenntiostat/galvanostat<br />
(Palm Instrument ts BV, Netherlan nds).<br />
Electroochemical<br />
eexperiments<br />
were carr rried out in n a 5 mL voltammetriic<br />
cell at room<br />
temperrature<br />
(25°CC),<br />
using a three-elecctrode<br />
conf figuration system s withh<br />
the stand dard<br />
Ag/AgCCl<br />
referencce<br />
electrode e type 6.07726.100<br />
and d platinum m auxiliary electrode type t<br />
6.0343. 000 (both ffrom<br />
Metro ohm, CH).<br />
Fig.1 FFabricated<br />
sample of the t MWNTTs<br />
Fig g.2 SEM mic crograph off<br />
fabricated d<br />
based<br />
sppray-coated<br />
d working electrode el<br />
electrode e<br />
3. RRESULTS<br />
AND DIS SCUSSIONN<br />
MMWNTs<br />
baased<br />
solutio on was useed<br />
for wor rking elect trodes of eelectrochem<br />
mical<br />
sensorss<br />
fabricationn.<br />
SEM ima age of the ffabricated<br />
electrode are a shown iin<br />
the figur re 2.<br />
From thhe<br />
SEM figgures<br />
of spr ray-coated eelectrode<br />
is s clear that the homoggenous<br />
laye er of<br />
openedd<br />
MWCNTss<br />
was achieved.<br />
It parttially<br />
satisf fied our pre esumption oof<br />
suitabilit ty of<br />
NMP uutilization<br />
aas<br />
the bindin ng materiall.<br />
The<br />
electroddes<br />
were ele ectrochemiically<br />
meas sured in ace etate bufferr<br />
solution using u<br />
differenntial<br />
pulse vvoltammetry.<br />
Lead ions<br />
were used<br />
as the detected<br />
maatter.<br />
Sampl le of<br />
DPV reesponse<br />
of fabricated electrode tto<br />
lead ions s is shown in the figuure<br />
3. From m the<br />
figure 3 is clear that the current c ressponse<br />
to lead l ions addition a is good and the<br />
electrodde<br />
could bee<br />
used for lead l ions deetection<br />
wi ith good lin nearity as iis<br />
shown in n the<br />
inset inn<br />
the figure 3.<br />
Foor<br />
better eevaluation,<br />
the fabriccated<br />
MW WNTs based d working electrode was<br />
comparred<br />
with staandard<br />
glas ssy carbon ( (GC) electr rode type 6.1204.300<br />
( (Metrohm, CH)<br />
and woorking<br />
elecctrode<br />
from m commerrcial<br />
sensor r DS 110CNT<br />
(DropSSens,<br />
ES). The<br />
calibrattion<br />
curvess<br />
compariso on for Pb ioons<br />
of all measured m electrodes<br />
iss<br />
shown in n the<br />
figure 44.<br />
- 214 -<br />
Brno<br />
figure 1. SEM S
XI. WWorkshop<br />
of Phyysical<br />
Chemists and Electrocheemists´11<br />
From thhe<br />
figure 4 is clear thhat<br />
with considering c of the ressults<br />
recou unted to<br />
currrent<br />
densitty<br />
for bette er evaluatioon<br />
of differ rently sized d electrodees,<br />
the resp ponse of<br />
fabrricated<br />
elecctrode<br />
to le ead ions is almost two o times hig gher than thhe<br />
response<br />
of GC<br />
elecctrode<br />
and little bit higher<br />
than the respon nse of comm mercial DSS<br />
110CNT working w<br />
elecctrode.<br />
Thee<br />
linearity of o our electtrode<br />
is als so better th han in case of commer rcial DS<br />
1100CNT<br />
working<br />
electrod de.<br />
Another experimen nt confirmeed<br />
that our r electrode without anny<br />
modific cation is<br />
ablee<br />
to detect tthe<br />
concentrations<br />
froom<br />
1 mol/ /L of lead io ons.<br />
Fi Fig.1 DPV respponse<br />
of prepa pared electrodde<br />
to Pb Fig.1 Fi Calibratio on curves commparison<br />
of fa abricated<br />
ions ( (inset: calibrat ation curve)<br />
MWNTs M based d electrode, sttandard<br />
GC electrode e<br />
an nd MWNTs based b WE froom<br />
DS 110CN NT sensor<br />
on the lead ionss<br />
detection<br />
4. CONCLLUSION<br />
In this work, the ere was faabricated<br />
spray-coate s ed MWNTTs<br />
based working w<br />
elecctrode<br />
for tthick-film<br />
electrochem<br />
e mical senso ors as a mix xture of CNNTs<br />
with NMP<br />
and<br />
commpared<br />
withh<br />
standard GC electroode<br />
and WE W from com mmercial ssensor<br />
DS 210CNT 2<br />
on eelectrochemmical<br />
detection<br />
of leadd<br />
ions in a three t electr rode systemm.<br />
Obtainedd<br />
results sh hown in chhapter<br />
3 con nfirmed th he suitabilitty<br />
of our el lectrode<br />
for electrochemmical<br />
analy ysis. Considdering<br />
the results r reco ounted to cuurrent<br />
dens sity, the<br />
respponse<br />
of faabricated<br />
electrode<br />
too<br />
lead ions s is almost two timess<br />
higher th han the<br />
respponse<br />
of GGC<br />
electrode<br />
and littlee<br />
bit highe er than the e response of commer rcial DS<br />
1100CNT<br />
working<br />
electrode.<br />
The linnearity<br />
of ou ur electrode e is also bettter<br />
than in n case of<br />
commmercial<br />
DDS<br />
110CN NT workinng<br />
electro ode. We were ablee<br />
to dete ect the<br />
conncentrationss<br />
from 1 m mol/L of leaad<br />
ions with hout any electrode<br />
moodification.<br />
Finally ccould<br />
be con ncluded thaat<br />
the fabri icated electrodes<br />
couldd<br />
be used as<br />
a good<br />
basee<br />
for other experimen nts with eleectrodes<br />
modification<br />
to be suitaable<br />
for bio osensing<br />
appplications.<br />
5. ACKNOOWLEDGE<br />
EMENT<br />
Funding for this wo ork was proovided<br />
by the t Grant agency a of thhe<br />
Czech Republic R<br />
undder<br />
the conntracts<br />
GA ACR 102/088/1546,<br />
and d Czech Ministry M of Education n in the<br />
framme<br />
of Reseaarch<br />
Plan MSM M 00216630503<br />
MIK KROSYN.<br />
- 215 -<br />
Brno
XI. Workshop of Physical Chemists and Electrochemists´11 Brno<br />
6. 6.REFERENCES<br />
[1] Prasek, J., et al.: Sensors, Vol. 6, No. 11, 2006, pp. 1498-1512<br />
[2] Krejci, J., et al.: Microelectronics International, Vol. 21, No. 3, 2004, pp. 20-24<br />
[3] Prasek J., et al.: 5th IEEE Sensors Conference, 2006, pp. 1257-1260<br />
[4] Klosova, K, et al.: Phys. stat. sol. A, Vol. 205, No. 6, 2007, pp. 1435-1438<br />
[5] Prasek, J., et al.: 33rd International Spring Seminar on Electronics Technology, 2010, pp. 1-4<br />
[6] Fujcik, L., et al.: Microelectronics International, Vol. 27, No. 1, 2010, pp. 3-10<br />
- 216 -
XI. Workshop of Physical Chemists and Electrochemists´11 Brno<br />
IMPROVEMENT OF SENSING PROPERIES<br />
OF THE THICK-FILM ELECTROCHEMICAL<br />
SENSORS BY SPECIFICATION<br />
MEASUREMENT WITH THE ROTATING<br />
VESSEL CELL<br />
Zdenek PYTLÍČEK 1 , Jan PRÁŠEK 1<br />
1 Dept. of Microelectronics, Brno University of Technology, Technicka 10, 616 00 Brno, Czech Republic<br />
Abstract<br />
This paper solves sensing properties optimization of thick-film electrochemical<br />
sensors for detection of substances in aqueous solutions using new electrochemical<br />
analytical device. The device uses rotating vessel cell for defined and reproducible<br />
measurement. The sensing properties have been examined using cyclic voltammetry<br />
method in a standard electrochemical solution of potassium ferro-ferricyanide.<br />
Distribution of response and noise in dependence on sensor position in vessel cell<br />
have been obtained and studied. Finally a possible sensor’s shapes influence to sensor<br />
response improvement is mentioned and discussed.<br />
1. INTRODUCTION<br />
Electrochemical analysis of species that are dissolved in water solutions is one of<br />
the cheapest analyses in this field. Generally the electrochemical analysis is provided<br />
by laboratory potentiostats with use of various electrochemical arrangements.<br />
Commonly used arrangements are unstirred cells, rotating disk electrodes, channel<br />
cells or wall-jet arrangements. All of mentioned electrochemical arrangements are<br />
designed to be used with solid electrodes, which is in contradiction with standard<br />
electrochemical analysis that commonly uses mercury drop electrode due to its very<br />
good sensing properties. The commercial standard solid electrodes are usually of high<br />
dimensions and cannot be used in small systems. The miniaturized solid electrodes in<br />
a form of more electrodes sensor system can be fabricated using thick-film technology<br />
(TFT). Such thick-film electrochemical systems (sensors) could be used as a base for<br />
another electrodes enhancement using nanotechnologies [1-3] or in complex sensors<br />
[4]. This work solves the optimization of new electrochemical analytical arrangement<br />
with rotating vessel [5] that was designed especially for use with thick-film<br />
electrochemical sensors. The device was designed to ensure reproducible mass<br />
transport of the solution to the electrodes. The optimization of the sensor and its<br />
position in the rotating vessel with respect to signal noise ratio was studied in this<br />
work.<br />
- 217 -
XI. Workshhop<br />
of Physical l Chemists and Electrochemists<br />
E<br />
s´11<br />
2. EXPERIMEENT<br />
Inn<br />
our previous<br />
work [5] was shhown<br />
that the new electrochem<br />
e mical analy ytical<br />
arrangeement<br />
is working<br />
wel ll and can bbe<br />
used for r electrochemical<br />
anaalysis.<br />
Princ ciple<br />
and firsst<br />
steps of ssensing<br />
pro operties of the sensor evaluation n using thiss<br />
device and<br />
its<br />
comparrison<br />
with other syste ems have bbeen<br />
alread dy described<br />
[5]. It wwas<br />
shown, that<br />
there iss<br />
a possibility<br />
to vary output currrent<br />
respo onse of the sensor in ddependence<br />
e on<br />
sensor position inn<br />
the vessel l that can bbe<br />
changed d in three axes<br />
accordiing<br />
to Figu ure 1<br />
(left). TThis<br />
new electrochemi<br />
ical analytiical<br />
devices is designed d especiallyy<br />
for work with w<br />
thick-fiilm<br />
sensorss<br />
fabricated on aluminna<br />
substrate shown in the t Figure 1 (right).<br />
Fig. 1 RRotating<br />
veessel<br />
cell with w possiblle<br />
changes (left) and real TFT ssensor<br />
used d for<br />
measuremeents<br />
(right)<br />
AAll<br />
measureements<br />
have<br />
been carrried<br />
out us sing cyclic voltammettry<br />
in rang ge of<br />
the pottential<br />
fromm<br />
-100 to 350 3 mV. MMeasuremen<br />
nt with sca an rate of 225<br />
mV/sec was<br />
performmed<br />
using tthe<br />
Voltala ab PST050 (Radiomete er analytica al, Denmarrk).<br />
The de evice<br />
was connnected<br />
to a personal l computerr<br />
for measu urement me ethod setupp<br />
and respo onse<br />
evaluattion.<br />
As aan<br />
electro ochemical standard solution a 5 mmool/L<br />
potass sium<br />
ferrocyyanide<br />
K4Fee(CN6)<br />
and 5 mmol/L ppotassium<br />
ferricyanide<br />
f e K3Fe(CN66)<br />
was prepared<br />
using 18<br />
M deioonized<br />
and redistilled water take en from Dir rect-Q Watter<br />
Purifica ation<br />
System (Milliporee).<br />
All used d chemicalls<br />
were fro om Sigma Aldrich A (Stt.<br />
Louis, USA). U<br />
Electroochemical<br />
eexperiment<br />
ts were caarried<br />
out in rotatin ng vessel ccell<br />
(18 ml m of<br />
solutionn)<br />
at room temperatur re (25 °C), uusing<br />
a thre ee-electrode<br />
system coonfiguration<br />
n.<br />
3. 3.RESULTSS<br />
AND DISCUSSIO<br />
D ON<br />
Fiirst<br />
measurrements<br />
we ere done too<br />
know the level of th he noise duuring<br />
chang ge of<br />
rotationn<br />
speed. Thhe<br />
rotation speed was cchanged<br />
fro om 0 to 450 0 rpm. The dependenc ce of<br />
output current reesponse<br />
an nd its corrresponding<br />
noise leve el measureed<br />
at poten ntial<br />
aroundd<br />
300 mV onn<br />
the chang ge of rotatioon<br />
speed is shown in the t Figure 2 a).<br />
Seecond<br />
measurements<br />
were donee<br />
with two different position p of f the sensor r. In<br />
the firsst<br />
one the ssensor<br />
elect trode systeem<br />
was orie ented outside<br />
and thee<br />
second on ne to<br />
the cenntre<br />
of the vvessel.<br />
All of measureements<br />
wer re done at the t tree levvels<br />
of z axi is (0,<br />
1, 2 mmm).<br />
En exammple<br />
of best<br />
results obbtained<br />
for first positio on of the seensor<br />
electr rode<br />
system is shown inn<br />
the Figur re 2 b) and FFigure<br />
2 c). .<br />
- 218 -<br />
referennce<br />
electrode (A Ag)<br />
workinng<br />
electrode (Au u)<br />
Brno
XI. WWorkshop<br />
of Phyysical<br />
Chemists and Electrocheemists´11<br />
c)<br />
Fig. . 2 Dependeence<br />
of out tput currennt<br />
response and its corr respondingg<br />
noise leve el on the<br />
change of rotation<br />
speed (aa),<br />
Sensor oriented o ou utside of tthe<br />
rotating g vessel<br />
currentt<br />
response for the z = 0 an nd rotation n speed 1125<br />
rpm (b) ( and<br />
correspponding<br />
noi ise level (c) )<br />
The last experimen nt was donne<br />
with mo odified sensor<br />
edges ( (see Fig. 3 left) to<br />
ensuure<br />
better mass flow w along thhe<br />
electrod des with minimum m tturbulences<br />
s. From<br />
commparison<br />
off<br />
unchanged d and modiified<br />
sensor r response (see Fig. 3 right) is cl lear that<br />
withh<br />
use of mmodified<br />
sen nsor was acchieved<br />
hig gher curren nt response but the no oise was<br />
alsoo<br />
increased.<br />
It conclud des that thhe<br />
presump ption of lov ver noise leevel<br />
with modified m<br />
senssor<br />
was nott<br />
confirmed d.<br />
Fig. . 3 Modifiication<br />
of edges of ssensor<br />
(left ft) and com mparison oof<br />
unchang ged and<br />
modifieed<br />
sensor re esponse (rigght)<br />
4. CONCLLUSION<br />
There wwas<br />
made new n electroochemical<br />
analytical device opptimization<br />
in this<br />
worrk.<br />
For the experimen nts the rotattion<br />
speed of o the vesse el 125 rpm was chosen n due to<br />
- 219 -<br />
a)<br />
b)<br />
Brno
XI. Workshop of Physical Chemists and Electrochemists´11 Brno<br />
high output current response with low level of noise at this value. During the<br />
investigation of the best sensor positions in the vessel were studied two different<br />
orientations of the sensor. In both cases was found that the best results were achieved<br />
when the sensor was put in its deepest position (z axis = 0). From the comparison of<br />
both sensors orientation is clear that better results in all xy range can be achieved<br />
with sensor oriented outside of the vessel, although the position with best ration<br />
signal/noise was found in sensor electrodes to the centre orientation. The last<br />
experiment was done with modified sensor edges to ensure better mass flow along the<br />
electrodes with minimum turbulences. From comparison of unchanged and modified<br />
sensor is clear that with use of modified sensor was achieved higher current response<br />
but the noise was also increased. It concludes that the presumption of lover noise level<br />
with modified sensor was not confirmed.<br />
5. ACKNOWLEDGEMENT<br />
Funding for this work was provided by the Czech grant agency under the<br />
contract GACR 102/08/1546 and Czech Ministry of Education in the frame of<br />
Research Plan MSM 0021630503 MIKROSYN.<br />
6. REFERENCES<br />
[1] Prasek J., et al.: IEEE Sensors, Vol. 1-3, 2006, pp. 1257-1260<br />
[2] Prasek J., et al.:, 33rd International Spring Seminar on Electronics Technology, 2010, pp. 1-4<br />
[3] Majzlik P., et al.: Listy cukrovarnicke a reparske, Vol. 126, No. 11, 2010, pp. 413-414<br />
[4] Fujcik L., et al.: Microelectronics International, Vol. 27, No. 1, 2010, pp. 3-10<br />
[5] Prasek J, et al. Proceedings of the IEEE Sensors, Vol. 1-3, 2004, pp. 749-752<br />
- 220 -
XI. Workshop of Physical Chemists and Electrochemists´11 Brno<br />
FLUORO/NITRO DERIVATIVES OF<br />
QUINOLONES: THEORETICAL AND<br />
SPECTROSCOPIC STUDY<br />
Ján RIMARČÍK 1 , Kraiwan PUNYAIN 2 , Erik KLEIN 1 , Vladimír LUKEŠ 1 , Dana<br />
DVORANOVÁ 1 , Anne-Marie KELTERER 2 , Vlasta BREZOVÁ 1<br />
1 Slovak University of Technology, Radlinského 9, SK-812 37 Bratislava, Slovak Republic<br />
2 Graz University of Technology, Stremayrgasse 9/I, A-8010 Graz, Austria<br />
Abstract<br />
In this work, we have studied fluoro and/or nitro substituted oxoquinolines<br />
theoretically as well as spectroscopically. Characterization of these novel potential<br />
drugs was oriented on oxo/hydroxy conformation stabilities, UV/vis and IR spectra,<br />
and EPR study of the radical species obtained upon photoinduced electron transfer<br />
from photoexcited TiO2 particles.<br />
1. INTRODUCTION<br />
1,4-Dihydro-4-oxoquinoline derivatives (4-quinolones) substituted at 4pyridone<br />
or benzene rings represent molecules possessing a variety of biological<br />
activities including antimicrobial, antiviral, antimycotic, antiprotozoal and<br />
antimalarial effects. Nowadays, the fluoro-substituted 1,4-dihydro-4-oxoquinoline-3carboxylic<br />
acids (fluoroquinolones) play a specific role in medicine.<br />
This study is oriented on the theoretical and spectroscopic characterization of<br />
conformation stabilities of new potential quinolone drugs [1]. The optimized<br />
geometrical parameters of ethyl 1,4-dihydro-4-oxoquinoline-3-carboxylate (Q) and its<br />
6-fluoro and 8-nitro derivatives (FQ, QN, FQN, see Fig. 1) in the gas phase, polar<br />
(acetonitrile and dimethylsulfoxide) and non-polar (toluene) organic aprotic solvents<br />
have been studied [2].<br />
The presence of nitro-substitution has an influence on the redox properties of<br />
quinolones, and allows generation and observation of corresponding radical anions<br />
(QN – and FQN –) using EPR. Theoretical study of the radical species obtained upon<br />
photoinduced electron transfer from photoexcited TiO2 particles to nitroquinolones<br />
represents another aim of this work.<br />
Quinolone R R'<br />
Q H H<br />
FQ F H<br />
QN H NO2<br />
FQN F NO2<br />
- 221 -
XI. Workshop of Physical Chemists and Electrochemists´11 Brno<br />
Fig.1 Structure, atom numbering and denotation of studied quinolones<br />
2. COMPUTATIONAL DETAILS<br />
DFT/B3LYP/6-31+G(d) calculations were performed using Gaussian 03 program<br />
package [3]. Solvent contribution was calculated employing the polarizable<br />
continuum model within IEF-PCM method [4]. Theoretical spectra of studied<br />
quinolones were constructed from the first 25 vertical excitations (TD-DFT) and their<br />
transition dipole moments using the Orca_Asa program [5]. Experimental details are<br />
summarized in ref 2 and references therein.<br />
3. RESULTS AND DISCUSSION<br />
The free rotation of COOEt group at C3 atom exhibits various structures<br />
determined by the value of torsion angle . This dihedral angle defined between the<br />
carbonyl group of COOEt and the C3–C4 bond within the pyridone moiety (see Fig. 1),<br />
provides two planar or roughly planar stable conformers with = 0 or 180 degrees,<br />
respectively. In the case of nitro-substituted hydroxy-tautomers (QN, FQN), NO2<br />
group is twisted out of the plane of quinolone moieties, and the existence of two<br />
stable conformers may be considered. However, both conformers exhibit almost the<br />
same properties. The gas-phase B3LYP/6-31+G(d) calculations with the inclusion of<br />
the Zero Point Energy (ZPE) corrections indicate that the hydroxy-form is clearly<br />
preferred in the case of Q and FQ quinolones. The presence of hydrogen<br />
intramolecular interaction between the OH group and oxygen atom of the<br />
neighboring COOEt substituent stabilizes this structure. In the case of the QN and<br />
FQN quinolones, the presence of electron withdrawing NO2 group is responsible for<br />
the stabilization of the oxo-tautomeric form via the intramolecular interaction<br />
between N1–H…O2N groups. However, the potential population of both tautomers in<br />
the gas phase should be assumed, due to the low values of relative B3LYP+ZPE<br />
energies of 7 and 4 kJ mol –1 for QN and FQN, considering most stable hydroxy-form<br />
and the most stable oxo-form.<br />
The geometrical changes induced by the fluorine and nitro groups are also<br />
reflected in the vertically excited singlet electronic states of studied quinolones. In the<br />
case of oxo-forms of the studied quinolones, in all environments, the first selected<br />
excitation energies lie in the range from 2.76 eV to 4.21 eV. In the hydroxy-forms, the<br />
first selected excitation energies appear in narrower interval from 3.22 eV to 3.99 eV.<br />
The mutual comparison of excitation energies obtained using the IEF-PCM<br />
model shows that the obtained energies are shifted up to 0.57 eV (QN in DMSO,<br />
second significant transition) with respect to the gas phase. The presence of the<br />
solvent causes small changes in oscillator strengths, too. In general, hydroxy forms of<br />
nitro-substituted quinolones, QN and FQN, show the highest sensitivity of excitation<br />
energies with respect to the solvent used. Despite the certain shifts of the calculated<br />
TD-DFT B3LYP(IEF-PCM=ACN)/6-31+G(d) convoluted absorption bands, the<br />
- 222 -
XI. WWorkshop<br />
of Phyysical<br />
Chemists and Electrocheemists´11<br />
simuulated<br />
UV/ /vis spectra a obtained iin<br />
ACN are e in good ac ccordance wwith<br />
the do ominant<br />
pressence<br />
of oxxo-tautomer<br />
rs of all studdied<br />
quinol lones.<br />
In orderr<br />
to under rstand thee<br />
effect of f the centr ral 4-pyriddone<br />
unit on the<br />
absoorption<br />
speectra,<br />
it is useful to eexamine<br />
th he relevant t frontier mmolecular<br />
orbitals, o<br />
whiich<br />
play a ddominant<br />
role r in electtronic<br />
transitions<br />
of the<br />
quinoloones<br />
Q and FQN in<br />
oxoo-forms.<br />
Thhe<br />
calculate ed first elecctron<br />
transi itions at 4. 21 eV for Q and 2.81 1 eV for<br />
FQNN<br />
are basedd<br />
on the ele ectron excittation<br />
from m the highest<br />
occupiedd<br />
molecular r orbital<br />
(HOOMO)<br />
to thhe<br />
lowest un noccupied mmolecular<br />
orbital o (LUMO).<br />
The UVVA<br />
photoexc citation of f nitroquin nolones QN<br />
titannia<br />
suspennsion<br />
resul lted in thee<br />
formatio on of EPR<br />
maxximal<br />
spin density at<br />
nitro subbstituent<br />
on o benzene<br />
proppose<br />
that ssuitable<br />
red dox potentiial<br />
values of o 8-nitroqu<br />
trannsfer<br />
of electrons<br />
(pho otogenerateed<br />
upon Ti iO2 irradiat<br />
prodducing<br />
thee<br />
correspon nding radiccal<br />
anions QN<br />
deteected<br />
radiccal<br />
anion st tructures oobtained<br />
fro<br />
andd<br />
FQN quinnolones<br />
were<br />
also studdied<br />
at the<br />
calcculated<br />
B33LYP(IEF-P<br />
PCM=DMSOO)/6-31+G(<br />
seleected<br />
atomss<br />
were calculated<br />
and d visualizati<br />
2. Itt<br />
can be coonsidered<br />
that<br />
spin deensities<br />
for<br />
are spread maiinly<br />
over NO2 N group aand<br />
benzene<br />
N and FQN<br />
R signals c<br />
e moiety o<br />
uinolone de<br />
tion) to qui<br />
– and FQN<br />
om the ph<br />
B3LYP/6-<br />
(d) hyperf<br />
ion of spin<br />
r both radic<br />
e ring.<br />
N in a de-aerated<br />
characterize ed with<br />
of quinolone.<br />
We<br />
erivatives enable e a<br />
inolone mo olecules,<br />
– . Thhe<br />
experim mentally<br />
otoinducedd<br />
reduction n of QN<br />
31+G(d) levvel<br />
of theo ory. The<br />
fine coupliing<br />
consta ants for<br />
densities iss<br />
presented d in Fig.<br />
cal anions aare<br />
analogo ous, and<br />
[QN(ox xo)] –<br />
Fig. .2 Plots of f B3LYP(IE EF-PCM=DMMSO)/6-31<br />
1+G(d) spin n densities of most probable p<br />
radical products monitorred<br />
upon UVA photoinduceed<br />
reduct tion of<br />
nitroquuinolones<br />
(Q QN, FQN) iin<br />
TiO2 susp pension<br />
4. CONCLLUSION<br />
Results oof<br />
calculations<br />
confirmmed<br />
for all l derivative es the domiinance<br />
of the t oxo-<br />
tauttomers<br />
in ppolar<br />
solven nts, contraryy<br />
to toluen ne and the hypothetica h al gas phase e, where<br />
the hydroxy-fforms<br />
are preferred p foor<br />
Q and FQ.<br />
The sim mulated TDD-DFT<br />
B3LY YP(IEF-<br />
PCMM=ACN)/6-31+G(d)<br />
UV/vis U speectra<br />
for oxo-tautom mers in AACN<br />
are in<br />
good<br />
accoordance<br />
wiith<br />
the expe erimental oones,<br />
despit te certain shifts<br />
of inddividual<br />
abs sorption<br />
bannds.<br />
Derivativves<br />
with ni itro substittution<br />
at 8-position<br />
ar re able to uundergo<br />
re eduction<br />
usinng<br />
photoexxcited<br />
TiO2 as a sourcee<br />
of electro ons to the correspondi c ding radical anions,<br />
monnitored<br />
by in situ EPR<br />
spectrosccopy.<br />
The correspond ding radicaal<br />
anions QN Q<br />
– and<br />
- 223 -<br />
[F FQN(oxo)] ] –<br />
Brno
XI. Workshhop<br />
of Physical l Chemists and Electrochemists<br />
E<br />
s´11<br />
FQN – were also studied th heoreticallyy.<br />
The hyp perfine cou upling consstants<br />
obtained<br />
from exxperimentaal<br />
EPR spec ctra are in ccorrelation<br />
with evalu uated quanttum<br />
theoretical<br />
data.<br />
5. AACKNOWLLEDGEME<br />
ENT<br />
This<br />
study wwas<br />
financia ally supportted<br />
by Scientific<br />
Gran nt Agency (VVEGA<br />
Proj jects<br />
1/0137/ /09, 1/10722/11,<br />
1/022 25/08 and 1/0018/09 9) and Res search andd<br />
Developm ment<br />
Agencyy<br />
of the Sloovak<br />
Repub blic (contraccts<br />
Nos. AP PVV-0055- 07, LPP 02230-09,<br />
SK-AT-<br />
0002-088<br />
and SK-AT-0016-0<br />
08) and byy<br />
the Aus strian Acad demic Excchange<br />
Ser rvice<br />
programm<br />
Wissennschaftlich-<br />
-Technischee<br />
Zusamm menarbeit Austria-Sllovakia<br />
un nder<br />
contracct<br />
No. ÖADD<br />
WTZ 11/2 2009.<br />
6. RREFERENCCES<br />
[1] Riimarčík,<br />
J., LLukeš,<br />
V., Klein, K E., Kellterer,<br />
A.-M. ,Milata, V., Vrecková, ZZ.,<br />
Brezová, V.: V J.<br />
Phhotochem.<br />
Phhotobiol.<br />
A Chem.,<br />
211 (20010),<br />
47.<br />
[2] Riimarčík,<br />
J., PPunyain,<br />
K., Lukeš, V., KKlein,<br />
E., Dv voranová, D. , Kelterer, AA.-M.,<br />
Milata a, V.,<br />
Liietava,<br />
J., Brezzová,<br />
V.: J. Mol. M Struc. (20011),<br />
doi:10.10 016/j.molstru uc.2011.02.0555.<br />
[3] Poople,<br />
J. A., et al., GAUSSIA AN 03, Revisiion<br />
A.1, Gaussian,<br />
Inc., Pit ttsburgh, PA, 2003.<br />
[4] Bööes,<br />
E.S., Livootto,<br />
P.R., Sta assen, H., Cheem.<br />
Phys. 331 (2006), 142.<br />
[5] Peetrenko,<br />
T., NNeese,<br />
F.: ORC CA ASA, Verrsion<br />
2.6.35, University U of Bonn, Germaany,<br />
2008<br />
- 224 -<br />
Brno
XI. Workshop of Physical Chemists and Electrochemists´11 Brno<br />
THIOPHENOLS: ENERGETICS OF S–H<br />
BOND CLEAVAGE<br />
Lenka ROTTMANNOVÁ 1 , Ján RIMARČÍK 1 , Adam VAGÁNEK 1 , Erik KLEIN 1 ,<br />
Vladimír LUKEŠ 1<br />
1 Institute of Physical Chemistry and Chemical Physics, Slovak University of Technology, Radlinského<br />
9, SK-812 37 Bratislava, Slovak Republic<br />
Abstract<br />
In this contribution, we have investigated thermodynamics of S–H bonds cleavage in<br />
meta-substituted thiophenols in the gas-phase and in two solvents. Reaction<br />
enthalpies for each mechanism were studied using density functional theory (B3LYP<br />
functional) with 6-311++G** basis set.<br />
1. INTRODUCTION<br />
Sulfur-centered radicals play an important role in organic synthesis,<br />
biochemistry and atmospheric chemistry. Therefore, this study is devoted to S–H<br />
bond cleavage in thiophenols. Hydrogen atom transfer (HAT) represents the generally<br />
accepted mechanism of antioxidant action. The reaction enthalpy of this mechanism is<br />
known as bond dissociation enthalpy (BDE).<br />
ArSH ArS + H BDE (1)<br />
First step of single-electron transfer – proton transfer (SET-PT) mechanism is<br />
governed by ionization potential (IP) of molecule. The second step of this mechanism<br />
is proton dissociation enthalpy (PDE)<br />
ArSH ArS + + e – IP (2)<br />
ArSH + ArS + H + PDE (3)<br />
Sequential proton loss electron transfer (SPLET) mechanism is also two-step<br />
mechanism of ArS radical formation. The reaction enthalpy of the first step of SPLET<br />
is described by proton affinity (PA) of formed anion. In the second step, the reaction<br />
enthalpy represents electron transfer enthalpy (ETE)<br />
ArSH ArS – + H + PA (4)<br />
ArS – ArS + e – ETE (5)<br />
The main aim of this work was to compute reaction enthalpies for homolytic<br />
and heterolytic S–H bond cleavage for selected compounds in order to identify<br />
thermodynamically preferred mechanism in studied environments. We have studied<br />
S-H bond dissociation enthalpies (BDE) related to equation 1, ionization potentials<br />
(IP) related to equation 2 and proton affinities (PA) related to equation 4. Two<br />
solvents with various polarities: benzene (C6H6) and water, were chosen. All<br />
enthalpies were calculated for 298.15 K.<br />
We have studied mono-substituted thiophenols with various groups in meta<br />
position (Fig. 1).<br />
- 225 -
XI. Workshop of Physical Chemists and Electrochemists´11 Brno<br />
X<br />
Fig.1 Studied thiophenols, X = NMe2, NH2, OH, MeO, tBu, Me, Ph, F, Cl, Br, MeCO,<br />
CF3, CN, MeSO2, NO2.<br />
2. COMPUTATIONAL DETAILS<br />
All calculations were performed using Gaussian 03 program package [1].<br />
Geometries of each compound, radical or ionic structure was optimized using DFT<br />
method with B3LYP functional without any constraints using 6-311++G** basis set.<br />
The optimized structures were confirmed to be real minima by frequency analysis.<br />
Solvent contribution to the total enthalpies was calculated employing integral<br />
equation formalism IEF-PCM method. This approach was used for the parent<br />
molecules and radicals, radical cations and anions. All IEF-PCM calculations were<br />
performed using default settings of Gaussian 03 program.<br />
3. RESULTS AND DISCUSSION<br />
From the calculated total enthalpies we have determined following quantities<br />
BDE = H(ArS ) + H(H ) – H(ArSH) (6)<br />
IP = H(ArSH + ) + H(e – ) – H(ArSH) (7)<br />
PA = H(ArS – ) + H(H + ) – H(ArSH) (8)<br />
Tab. 1: S–H bond dissociation enthalpies, ionization potentials and proton affinities in<br />
kJ mol –1<br />
Substituent BDE IP PA<br />
Gas<br />
a<br />
C6H6 H2O b Gas<br />
c<br />
C6H6 H2O d Gas<br />
e<br />
C6H6 H2O f<br />
316 325 322 786 661 468 1412 402 174<br />
m-NH2 314 322 316 719 598 408 1420 409 178<br />
m-NMe2 313 322 316 683 578 402 1420 412 178<br />
m-tBu 315 323 319 758 648 462 1413 406 176<br />
m-Me 315 324 320 769 651 462 1415 405 175<br />
m-Ph 316 325 322 747 642 463 1401 399 173<br />
m-OH 315 324 321 771 647 456 1404 398 173<br />
m-MeO 314 323 320 751 639 456 1410 401 173<br />
m-F 319 329 327 809 681 484 1391 387 167<br />
m-Cl 319 329 327 803 679 484 1386 384 166<br />
m-MeCO 316 327 326 800 681 485 1382 382 167<br />
m-Br 319 329 327 799 677 483 1383 383 166<br />
m-CF3 321 331 329 833 697 493 1374 378 165<br />
m-CN 322 333 331 837 705 498 1362 370 162<br />
m-MeSO2 322 333 332 823 701 500 1362 370 160<br />
m-NO2 323 334 333 845 713 505 1357 366 159<br />
a<br />
solvH(H • ) = 6.4 kJ mol –1 [2], b<br />
kJ mol –1 [4],<br />
d<br />
hydrH(e – ) = –105 kJ mol –1 [4], e<br />
–1022 kJ mol –1 [4]<br />
- 226 -<br />
SH<br />
hydrH(H • ) = –4 kJ mol –1 [3], c<br />
solvH(H + ) = –894 kJ mol –1 [4], f<br />
solvH(e – ) = –7<br />
hydrH(H + ) =
XI. Workshop of Physical Chemists and Electrochemists´11 Brno<br />
In general, free energy is the criterion of the thermodynamically preferred<br />
mechanism. However, in the case of studied reactions the absolute values of the<br />
entropic term –TrS reach only few units or tens of kJ mol –1 and all free energies, rG<br />
= rH – TrS, are only slightly shifted in comparison to corresponding enthalpies<br />
[4,5,6]. Therefore, values of BDE, PA and IP (Tab. 1) are able to indicate<br />
thermodynamically preferred mechanism. Due to the large differences, exceeding<br />
several hundreds of kJ mol –1 , HAT mechanism is thermodynamically preferred in gasphase,<br />
where BDEs are significantly lower than ionization potentials. Proton transfer<br />
described by proton affinity is by ca one order higher than BDE. In benzene,<br />
hydrogen transfer mechanism remains preferred. In solution-phase, ionization<br />
potentials reached the highest values. In water, proton affinities are considerably<br />
lower than BDEs, therefore SPLET should be thermodynamically favored mechanism.<br />
Differences between BDEs and PAs in water grow with the increase in electronwithdrawing<br />
effect of substituents.<br />
4. CONCLUSION<br />
For studied mono-substituted thiophenols we found that solvents are able to<br />
change the thermodynamically favored pathway of ArS formation. We can conclude<br />
that in studied environments reaction enthalpies grow in this order:<br />
gas-phase: BDE < IP < PA<br />
benzene: BDE < PA < IP<br />
water: PA < BDE < IP<br />
5. ACKNOWLEDGEMENT<br />
This work has been supported by Scientific Grant Agency (VEGA Projects<br />
1/0137/09, 1/1072/11 and 1/0127/09).<br />
6. REFERENCES<br />
[1] Pople J. A. et al.: GAUSSIAN 03, Revision A.1, Gaussian, Inc., Pittsburgh, PA, 2003.<br />
[2] M. M. Bizarro, B. J. Costa Cabral, R.M.B dos Santos, J. A. Martinho Simões, Pure Appl. Chem. 71<br />
(1999) 1249.<br />
[3] W. D. Parker, J. Am. Chem. Soc. 114 (1992) 7458.<br />
[4] J. Rimarčík, V. Lukeš, E. Klein, M. Ilčin, J. Mol. Struct. (Theochem) 952 (2010) 25.<br />
[5] M.J.S. Dewar, The Molecular Orbital Theory of Organic Chemistry, McGraw-Hill, New York,<br />
1990.<br />
[6] J. Rimarčík, V. Lukeš, E. Klein, L. Rottmannová, Computational and Theoretical Chemistry,<br />
submitted.<br />
- 227 -
XI. Workshop of Physical Chemists and Electrochemists´11 Brno<br />
ANALYSIS OF METALLOTHIONEIN<br />
ISOFORMS BY CAPILLARY<br />
ELECTROPHORESIS<br />
Markéta RYVOLOVÁ 1 , Tereza HÁJKOVÁ 2 , Petr MAJZLÍK 1,2 , Jaromír HUBÁLEK 2,3 ,<br />
Vojtěch ADAM 1,3 , Ivo PROVAZNÍK 4 , René KIZEK 1,3<br />
1 Department of Chemistry and Biochemistry, Faculty of Agronomy, Mendel University in Brno,<br />
Zemedelska 1, CZ-613 00 Brno, Czech Republic<br />
2 Department of Microelectronics Faculty of Electrical Engineering and Communication, Brno<br />
University of Technology, Kolejni 4, CZ-612 00 Brno, Czech Republic<br />
3 Central European Institute of Technology, Brno University of Technology, Technicka 3058/10, CZ-616<br />
00 Brno, Czech Republic<br />
4 Department of Biomedical Engineering, Faculty of Electrical Engineering and Communication, Brno<br />
University of Technology, Kolejni 4, CZ-612 00 Brno, Czech Republic<br />
Abstract<br />
Prostate cancer (CaP) is the second most frequently diagnosed cancer in developed<br />
countries and the third most common cancer causing death in men. Number of<br />
compounds is tested as potential CaP markers to improve the reliability of commonly<br />
used tests. Metallothionein (MT), due to its properties including high cysteine<br />
content, high heavy metal affinity and thermostability, is extensively studied as a<br />
potential cancer marker. Two major isoforms (MT-1, MT-2) have been identified in<br />
mammals and diagnostic potential of their ratio is investigated.<br />
Capillary electrophoresis is a separation effective tool enabling separation and<br />
identification of MT isoforms in mixtures. However the complexity of real samples<br />
requires sample pre-treatment to obtain valuable results and minimize the<br />
interferences of other compounds. Thermal denaturation of the sample is one of the<br />
simplest and often used methods for elimination of interfering components taking<br />
advantage of the MT’s thermostability. The effect of thermal denaturation on the<br />
separation of MT isoforms was studied in this work.<br />
1. INTRODUCTION<br />
Metallothioneins belong to a class of low molecular mass proteins characterized<br />
by high cysteine content and the lack of aromatic amino acids. 1 MTs are single-chain<br />
proteins with amino acid number oscillating between app. 20 and more than 100<br />
residues according to organisms. Almost one third of this number is cysteine<br />
occurring in conserved sequences cys-x-cys, cys-x-y-cys a cys-cys where x and y<br />
represent other amino acid. 2<br />
MT binds metals such as zinc, cadmium, copper and mercury with high affinity<br />
and its functions include the homeostasis essential metals and detoxification of toxic<br />
metal ions and its compounds. Probably the most widely studied group of MTs is the<br />
mammalian subfamily. There are 4 mammalian MT isoforms (MT1 – MT4) known<br />
- 228 -
XI. Workshop of Physical Chemists and Electrochemists´11 Brno<br />
and 13 MT-like human proteins were identified. MT1 and MT2 are present in almost<br />
all soft tissues, MT3 is specific for brain, heart and kidney tissues and MT4 was found<br />
in epithelial cells. Differences of constituent forms come mainly from posttranslational<br />
modifications, small changes in primary structure, type of incorporated<br />
metal ion and speed of degradation.<br />
Capillary electrophoresis (CE) is nowadays well established and very powerful<br />
separation tool for analysis of complex biological samples. The extreme separation<br />
power combined with short time of analysis and low sample requirements are main<br />
advantages of this effective analytical technique. CE is suitable for the separation of<br />
low Mr molecules and therefore it is optimal for MT analysis as well as for<br />
identification of MT isoforms.<br />
The diagnostic potential of MT isoforms is also investigated. It was found in a<br />
work of Kawata et al. 3 that MT1/MT2 ratio may improve the diagnosis of chronic<br />
hepatic disorder. CE was used in this work as an efficient separation method. Sample<br />
of MT isoforms extracted from liver tissue was pre-treated by 2 minute thermal<br />
denturation (100°C). However due to the high concentration of MT in tissues, no<br />
problems with denaturation were observed. The aim of this work is to investigate the<br />
impact of the denaturation on the CE signal of MT1 and MT2 in various<br />
concentrations, especially in blood stream, where the concentration of MT is in the<br />
range of 0.01 mg/ml.<br />
2. EXPERIMENT<br />
MT1 and MT2 standards were purchased by Sigma Aldrich and subsequently<br />
dissolved in deionized water to the required concentration. Thermal denaturation was<br />
performed at 99°C for 20 minutes.<br />
Capillary electrophoresis system Backman PACE 5510 (USA) equipped with UV<br />
absorbance detector was used in this work. Signal of analytes was measured at 214<br />
nm. An un-coated fused silica capillary (Polymicro Technologies, USA) with total<br />
length of 47 cm, effective length of 40 cm and internal diameter of 50 μm was<br />
employed. Sample was injected hydrodynamicaly by pressure of 3.4 kPa applied for 20<br />
s. Separation voltage was set to 10 kV. Borate buffer (20 mM, pH 9.5) was used as a<br />
background electrolyte (BGE).<br />
3. RESULTS AND DISCUSSION<br />
Separation of MT isoforms (MT1 and MT2) by CE was optimized including<br />
electrolyte composition and pH, capillary length, and separation voltage. Typical<br />
electropherogram is shown in Fig. 1. Well resolved signals of MT1 and MT2 are<br />
present with migration times of 6.8 and 7.2 minutes.<br />
- 229 -
XI. Workshhop<br />
of Physical l Chemists and Electrochemists<br />
E<br />
s´11<br />
Fig.1: TTypical<br />
elecctropherogram<br />
of MTT1<br />
and MT T2 separatio on. Conditiions:<br />
BGE – 20<br />
mM boratee<br />
buffer pH 9.5, voltagge<br />
- +10 kV,<br />
injection - 20s, 3.4 kkPa,<br />
detection<br />
–<br />
214 nm<br />
CCalibration<br />
curves obt tained for each isofor<br />
(Fig. 2) ) and limitss<br />
of detecti ion were oof<br />
1×10<br />
and MTT2,<br />
respectiively.<br />
-7 rm exhibit<br />
M and 8×10- ted a very good linea arity<br />
-8 M determmined<br />
for MT1 M<br />
( (a)<br />
Fig. 2: Calibrationn<br />
curves for r (a) MT1 aand<br />
(b) MT T2 obtained d by CE. CConditions<br />
as a in<br />
Fig. 1.<br />
To<br />
analyse comple re eal samplee<br />
mixtures ussually sample prre-treatmen<br />
nt is<br />
requireed.<br />
One of ssuch<br />
pre-tre eatment meethods<br />
is th hermal dena aturation. IIn<br />
this case is it<br />
- 230 -<br />
(b) (<br />
Brno
XI. WWorkshop<br />
of Phyysical<br />
Chemists and Electrocheemists´11<br />
takiing<br />
advantaage<br />
of therm mal stabilityy<br />
of MT in comparison<br />
to other pproteins.<br />
However H<br />
the influence oof<br />
this proc cedure on tthe<br />
MT ana alysis has to o be verifieed.<br />
Moreove er, even<br />
thouugh<br />
the CEE<br />
separation n is bassed mostly on the charge of the anaalyte<br />
the molecular<br />
struucture<br />
has somewhat impact as well. For this reason n, the impaact<br />
of the thermal<br />
dennaturation<br />
was invest tigated. It was foun nd that in concentraation<br />
highe er than<br />
1 mmg/ml<br />
the ddenaturatio<br />
on has no iinfluence<br />
and a signals s of MT1 aand<br />
MT2 are a well<br />
resoolved<br />
in denatured<br />
as a well as in not de enatured is soform mixxture<br />
(Fig. 3a, b).<br />
Howwever<br />
in concentratio<br />
ons lower than 1 mg g/ml, signifi icant changges<br />
in sign nal were<br />
obseerved.<br />
As sshown<br />
in Fig. F 3c, in nnon-denetu<br />
ured mixtur re with conncentration<br />
n of 0.08<br />
mg/ /ml a good separation of isoforms<br />
is present t. The samp ple of the saame<br />
concen ntration<br />
unddergoing<br />
deenaturation<br />
n (20 min, 999°C)<br />
exhib bits a major r peak withh<br />
migration time of<br />
about<br />
6 minuttes<br />
(Fig.3d) ) relating too<br />
the MT however h does<br />
not reppresent<br />
any y of the<br />
isofforms<br />
and aas<br />
well can not be useed<br />
for MT quantificati q ion. The na natre of this s peak is<br />
stilll<br />
not clear aand<br />
require es further innvestigation<br />
n.<br />
(a)<br />
(b)<br />
- 231 -<br />
Brno
XI. Workshhop<br />
of Physical l Chemists and Electrochemists<br />
E<br />
s´11<br />
(c)<br />
Fig. 3: CE of MTT1<br />
and MT2 2 mixture separated under u optim mized condditions.<br />
(a) not<br />
denatured, c = 2.5 mg g/ml; (b) deenatured,<br />
c = 2.5 mg/m ml; (c) not denatured,<br />
c =<br />
0.08 mg/mll;<br />
(d) denatured,<br />
c = 0. .08 mg/ml.<br />
4. CCONCLUSION<br />
MMT<br />
isoforms<br />
were effi iciently sepparated<br />
by CE with good<br />
sensitiivity<br />
as we ell as<br />
linearitty.<br />
Sample pre-treatm ment plays a significa ant role in analysis off<br />
real com mplex<br />
mixturees.<br />
Thermaal<br />
denaturat tion is one of the sim mplest pre-tr reatment mmethods<br />
and<br />
its<br />
influennce<br />
on the pprotein<br />
mix xture was iinvestigated<br />
d in this stu udy. Signifiicant<br />
impac ct of<br />
denaturration<br />
was observed in n MT sampples<br />
with co oncentration n below 1 mmg/ml.<br />
5. AACKNOWLLEDGEME<br />
ENT<br />
The<br />
work has been supportedd<br />
by Nano oBioTECell GA CR<br />
NANIMMEL<br />
GA CRR<br />
102/08/15 546 and RECAMT<br />
GA A AV IAA40 01990701<br />
6. RREFERENCCES<br />
[1] HHamer<br />
D. H.: MMarine<br />
Environmental<br />
Ressearch,<br />
24, 17 71 (1988).<br />
[2] KKagi<br />
J. H. R. : Methods in i Enzymoology,<br />
205, 613 6 (1991).<br />
[3] KKawata<br />
T., Nakamura S., Nakayyama<br />
A., Fu ukuda H., Ebara M., Nagamine e T.,<br />
MMinami<br />
T., SSakurai<br />
H.: Biological & Pharmac ceutical Bulletin,<br />
29, 4403<br />
(2006).<br />
- 232 -<br />
(d) )<br />
Brno<br />
P102/11/1068,
XI. Workshop of Physical Chemists and Electrochemists´11 Brno<br />
ANALYSIS OF SARCOSINE BY CAPILLARY<br />
ELECTROPHORESIS<br />
Markéta RYVOLOVÁ 1 , Natalia CERNEI 1 , Michal MASAŘÍK 2 , René KIZEK 1,3<br />
1 Department of Chemistry and Biochemistry, Faculty of Agronomy, Mendel University in Brno,<br />
Zemedelska 1, CZ-613 00 Brno, Czech Republic<br />
2 Department of Pathological Physiology, Faculty of Medicine, Masaryk University, Kamenice 5, CZ-<br />
625 00 Brno, Czech Republic<br />
3 Central European Institute of Technology, Brno University of Technology, Technicka 3058/10, CZ-616<br />
00 Brno, Czech Republic<br />
Abstract<br />
Sarcosine (Src) is investigated as a potentially valuable molecule in diagnostics of<br />
prostate cancer. This potential induced an extensive research of its properties,<br />
biological functions and connections to certain diseases. In this work, capillary<br />
electrophoresis is used for determination of sarcosine as a complex with copper ions<br />
present in background electrolyte. Subsequently, the method was used for<br />
determination of sarcosine in lysates of prostate cancer cells treated with various<br />
concentrations of Zn ions.<br />
1. INTRODUCTION<br />
Src is an N-methyl derivative glycine. In some studies it was found that content<br />
of Src increases significantly in CaP patients 1-3 and therefore it is currently studied for<br />
the potential role in prostate cancer (CaP) diagnostics. This hypothesis induced an<br />
interest in the precise and sensitive determination of Src is various body fluids such as<br />
blood serum and/or urine. For this reason, a range of analytical methods were<br />
evaluated. Due to its basic properties capillary electrophoresis (CE) was also<br />
considered as a suitable analytical method. CE enables determination of a wide range<br />
of analytes including small molecules such as sarcosine and due to its high separation<br />
power it is optimal for analysis of complex matrices including body fluids. In this<br />
work, CE method for Src analysis employing the interaction of Cu ions with<br />
molecules having un-bonded electron pair was evaluated and applied for<br />
determination of Src in cell lysates of prostate tissue cells.<br />
2. EXPERIMENT<br />
All analyses were carried out using CE instrument by Beckman Coulter (P/ACE<br />
5500). Separations were performed in an uncoated fused silica capillary with an<br />
internal diameter of 50 m and external diameter of 375 m. The total length of the<br />
capillary was 47 cm and the effective length was 40 cm. In the case of the real samples<br />
the length was extended to 57 cm and 50 cm for the total and effective length,<br />
respectively. The capillary was flushed with 0.1 M NaOH for 5 minutes and with<br />
background electrolyte for 10 minutes prior to the first use. Conditioning with 0.1 M<br />
- 233 -
XI. Workshop of Physical Chemists and Electrochemists´11 Brno<br />
NaOH for 0.5 minute and 2 minutes with BGE was done before every run to obtain<br />
clean capillary surface and thus reproducible separation.<br />
The composition of the background electrolyte (BGE) was adopted from the<br />
work of Jiang et al. 4 where 50 mM CuSO4 in 0.05% HAc (v/v) was found to be an<br />
optimal BGE for the separation of amino acids in combination with the absorbance<br />
detection at 254 nm. The sample was injected hadrodynamicaly by applying of 3.4 kPa<br />
for period of 30 s and the separation voltage was set to 15 kV.<br />
Prostate cells were grown in media with 50, 150 and 300 M Zn 2+ and after<br />
harvesting mechanically manually homogenized in 50 μl of phosphate buffer (pH 7.4)<br />
for 3 minutes. Subsequently PBS up to 200 μl was added and thermal denaturation was<br />
carried out (99 °C for 15 minutes). The solution was centrifuged (14000 rpm for 30<br />
minutes at 4°C). These lysates were diluted by distilled water (1:1) and used for CE<br />
analysis.<br />
3. RESULTS AND DISCUSSION<br />
As discussed in the publication by Jiang et al. 4 during the separation Cu 2+ ions<br />
are able to create complexes based on coordination interactions with the analytes<br />
containing free electron pair. This method enables not only the direct absorbance<br />
detection of certain analytes including amino acids, but also online preconcentration<br />
of the analyte by coordination sweeping method.<br />
To optimize and characterize the method, separation of model mixture of six<br />
amino acids (His, Ser, Phe, Gln and Pro) as well as sarcosine (Src) as an isomer of<br />
alanine was performed (Fig. 1).<br />
A (AU)<br />
0,025<br />
0,02<br />
0,015<br />
0,01<br />
0,005<br />
his<br />
ser<br />
0<br />
10 15 20<br />
t (min)<br />
Fig.1: Electropherogram of standard amino acid mixture. Conditions: BGE – 50 mM<br />
CuSO4 in 0.05% HAc (v/v) pH 3.8, detection at 254 nm, voltage - +15 kV<br />
Also the applicability of the method for sarcosine analysis was verified and<br />
analytical figures of merit were determined (Tab. 1). It was proved that the method is<br />
suitable for analysis of Src in presence of other amino acids and the signal of Src<br />
- 234 -<br />
phe<br />
gln<br />
pro<br />
src
XI. Workshop of Physical Chemists and Electrochemists´11 Brno<br />
increases with the concentration. Calibration curve with a very good linearity (R 2 =<br />
0.9968) was obtained (Fig. 2).<br />
Tab. 1: Analytical figures of merit for CE analysis of Src<br />
LOD<br />
(M)<br />
3x10 -<br />
6<br />
A (AU)<br />
0,014<br />
0,012<br />
0,01<br />
0,008<br />
0,006<br />
0,004<br />
0,002<br />
RSD<br />
signal (n=3)<br />
11 %<br />
LOQ<br />
(M)<br />
8x10 -<br />
6<br />
- 235 -<br />
linear<br />
range<br />
LOQ - 6x10 -<br />
3<br />
RSD<br />
mig. time (n=3)<br />
0,2 %<br />
Fig. 2: Calibration curve of sarcosine obtained by CE. Conditions as in Fig. 1<br />
Subsequently the optimized method was utilized to analyze samples of prostate<br />
cell lysates. From the obtained results can be seen that the Src signal is well resolved<br />
and no directly interfering peaks are present. The identification of the Src peak was<br />
done by both, comparison with migration time of a standard solution as well as by<br />
standard addition method to take into account the matrix effect. The typical<br />
electropherogram of cell lysate sample is shown in Fig. 3.<br />
A (AU)<br />
0,0035<br />
0,003<br />
0,0025<br />
0,002<br />
0,0015<br />
0,001<br />
0,0005<br />
Fig. 3: Electropherogram of cell lysates. Conditions as in Fig. 1<br />
y = 2,1814x<br />
R² = 0,9968<br />
0<br />
0,000 0,001 0,002 0,003 0,004 0,005 0,006 0,007<br />
c (M)<br />
Src<br />
0<br />
10 15 20<br />
t (min)<br />
25 30
XI. Workshhop<br />
of Physical l Chemists and Electrochemists<br />
E<br />
s´11<br />
The<br />
influencce<br />
of conce entration oof<br />
Zn ions in i growing medium oon<br />
the Src level l<br />
was alsoo<br />
investigatted.<br />
For thi is reason, ceells<br />
culture ed in media a containingg<br />
different Zn<br />
concenntrations<br />
weere<br />
analyze ed. The commparison<br />
of o three dif fferent cell lysates sam<br />
shows tthe<br />
decreasse<br />
of the Src S signal (FFig.<br />
4). Flu uorescence microscopyy<br />
of intact<br />
proved that increasing<br />
con ncentrationn<br />
of Zn io ons decreas se the viabbility<br />
of c<br />
Therefoore<br />
the Src level is also o decreasinng.<br />
2+<br />
mple<br />
cell<br />
cells.<br />
Fig. 4: Src level inn<br />
cell lysat te sample ttreated<br />
with h three con ncentrationns<br />
(50, 150 and<br />
300 μM) off<br />
Zn ions<br />
4. CCONCLUSION<br />
Itt<br />
was foundd<br />
that CE is s suitable foor<br />
analysis of Src. Sarc cosine amoount<br />
in pros state<br />
cell lysaates<br />
was deetermined<br />
by b the methhod<br />
employ ying compl lexation of Cu ions. It was<br />
also fouund<br />
that ZZn<br />
ions ha ave an infl fluence on the viabil lity of prosstate<br />
cells and<br />
therefoore<br />
on the aamount<br />
of sarcosine<br />
deetermined.<br />
5. AACKNOWLLEDGEME<br />
ENT<br />
The<br />
work has been supported by GACR R 301/09/P P436, IGA<br />
NANOSSEMED<br />
GAA<br />
AV KAN2 208130801 and IGA MENDELU M 1/2011<br />
6. RREFERENCCES<br />
1. Kuuehn<br />
B. M.: JJama-Journal<br />
of the Ameriican<br />
Medical Association, A 301, 3 1008 (20009).<br />
2. Jeentzmik<br />
F., Sttephan<br />
C., Miller M K., Schrrader<br />
M., Erb bersdobler A., , Kristiansen G., Lein M., Jung<br />
K.:<br />
European UUrology,<br />
58, 12<br />
(2010).<br />
3. Coouzin<br />
J.: Sciennce,<br />
323, 865 (2009).<br />
4. Jiaang<br />
X. M., Xia<br />
Z. N., Wei W. W L., Gou QQ.:<br />
Journal of Separation S Sc cience, 32, 19227<br />
(2009).<br />
- 236 -<br />
Brno<br />
MZ 1020 00-3,
XI. Workshop of Physical Chemists and Electrochemists´11 Brno<br />
LAB-ON-CHIP: STATE OF THE ART<br />
Markéta RYVOLOVÁ 1 , Jaromír HUBÁLEK 2,3 , René KIZEK 1,3<br />
1 Department of Chemistry and Biochemistry, Faculty of Agronomy, Mendel University in Brno,<br />
Zemedelska 1, CZ-613 00 Brno, Czech Republic<br />
2 Department of Microelectronics, Faculty of Electrical Engineering and Communication, Brno<br />
University of Technology, Kolejni 4, CZ-612 00 Brno, Czech Republic<br />
3 Central European Institute of Technology, Brno University of Technology, Technicka 3058/10, CZ-616<br />
00 Brno, Czech Republic<br />
Abstract<br />
Precise, sensitive and reliable determination of analytes in a wide range of natural<br />
matrixes is one of the main goals of natural sciences. In the real world, an analyte of<br />
interest (whether it is a small organic molecule or a much larger biopolymer) is<br />
usually present as a minor component in a complex mixture. This means that<br />
discrimination of the analyte from potential interferences is usually the critical step in<br />
the complete analysis process. 1<br />
Lab-on-chip systems, which are also known as micro total analysis systems (μTAS),<br />
can be defined as integrated micro electromechanical devices enable to carry out all<br />
stages of analytical process. They allow miniaturization and integration of complex<br />
functions that can automate repetitive laboratory tasks. The portability as well as<br />
compactness of these devices even support the rising trends of in situ analysis. 2 μTAS<br />
influences an extremely diverse range of analytical applications and on the other hand<br />
its own progress is enabled by numerous engineering disciplines. The lab-no-chip<br />
concept is closely connected to the manipulation with liquids at extremely low<br />
volumes – known as “microfluidics”. The history of microfluidics dates back to the<br />
early 1950s, when efforts to dispense small amounts of liquids in the nano and<br />
subnanolitre ranges were made for providing the basics of today’s ink-jet technology. 3<br />
μTAS concept itself was proposed in by Manz et al. 4 in the work from 1990, where a<br />
silicon chip analyze incorporating sample pretreatment, separation and detection was<br />
integrated. Since then the race for lower detection limits, lower sample and chemical<br />
consumption, higher throughput as well as lower costs is running. In last two decades<br />
numerous research groups invested their time and effort in developing new<br />
microfluidic components for liquid transport and low volume measurements, mixer,<br />
valves, concentrators and/or separators for analytes within miniaturized quantities of<br />
fluids. 3<br />
Moving the analysis to the micro-world brings specific obstacles that do not exist in<br />
macro-world and need to be effectively tackled. Therefore even closer connection<br />
between disciplines has developed. Currently, progress in nanotechnologies moves the<br />
miniaturization even further focusing on molecular machines and “nanobots”. This<br />
lecture is giving an overview of lab-on-chip state of art, highlighting some<br />
outstanding geometrical arrangements, manufacturing processes and/or applications.<br />
- 237 -
XI. Workshop of Physical Chemists and Electrochemists´11 Brno<br />
7. ACKNOWLEDGEMENT<br />
The work has been supported by CEITEC CZ.1.05/1.1.00/02.0068,<br />
NANOSEMED GA AV KAN208130801<br />
8. REFERENCES<br />
1. Jakeway S. C., de Mello A. J., Russell E. L.: Fresenius Journal of Analytical Chemistry, 366, 525<br />
(2000).<br />
2. Lim Y. C., Kouzani A. Z., Duan W.: Microsystem Technologies-Micro-and Nanosystems-<br />
Information Storage and Processing Systems, 16, 1995 (2010).<br />
3. Haeberle S., Zengerle R.: Lab on a Chip, 7, 1094 (2007).<br />
4. Manz A., Graber N., Widmer H. M.: Sensors and Actuators B-Chemical, 1, 244 (1990).<br />
- 238 -
XI. Workshop of Physical Chemists and Electrochemists´11 Brno<br />
THIN FILM HYDROGEN SENSOR BASED<br />
ON DIKETOPYRROLO-PYRROLES<br />
ANALOGUES<br />
Ota SALYK 1 , Jan VYŇUCHAL 2<br />
1 Brno University of Technology, Faculty of Chemistry, Purkyňova 118, 612 00 Brno, Czech Republic<br />
2 Synthesia a.s., Pardubice, Semtín 103, CZ-532 17 Pardubice, Czech Republic<br />
Abstract<br />
3,6-Diphenyl-2,5-dihydro-pyrrolo[3,4-c]pyrrole-1,4-dione (BPPB) and its analogues<br />
diketo-pyrrolo-pyrroles (DPPs) are industrially important organic pigments. DPPs<br />
have also attracted attention as materials useful for organic electronics because of<br />
conjugated chain inside the molecule enabling charge transport. Nitrogen atom in<br />
pyridyl substituent can create hydrogen bond and accept proton, which enhances<br />
molecule dipole momentum and N-doping of the substance resulting in conductivity<br />
increase. 3,6-bis-(4'-pyridyl)-2,5-dihydro-pyrrolo[3,4-c]pyrrole-1,4-dione<br />
(4PyPP4Py) and several other analogues of DPPs were investigated by IR and Raman<br />
spectroscopy, thermogravimetric analysis and other physical methods. X-ray<br />
difractometry was applied for elucidation of crystallographic polymorphism and<br />
hydrogen bridge bonds. 100 nm thin film structures with Pd interlayer were<br />
deposited by vacuum evaporation on substrates with platinum interdigital system of<br />
electrodes. Pd enabled hydrogen dissociation for DPPs doping. Hydrogen induced<br />
conductivity was measured; response and recovery time as well as temperature and<br />
oxygen free H2 mixture environment were tested. The conductivity increase of up to 5<br />
orders with hydrogen concentration up to 100 % was observed. Despite slow<br />
degradation in operation the system can be utilized in hydrogen sensor devices.<br />
1. INTRODUCTION<br />
With the advent of fuel cells based upon H2, H2 gas sensors have attracted<br />
attention, because hydrogen is the smallest atom and, thus, can leak easily. We have<br />
been so far involved in the research and development of a H2 gas sensor utilizing a<br />
high proton affinity of new materials with pyridyl substituents of phenyl in diketopyrrolo-pyrroles<br />
(DPPs). DPPs (Fig. 1) 0 are industrially important organic pigments<br />
used not only for paint industries but as in the imaging areas. DPPs have also attracted<br />
attention as a material useful for EL and colour filters for LCD applications and in<br />
photovoltaics. Recently an application in gas sensing devices was suggested by<br />
Mizuguchi et al. 0 who also explained the principle of proton bond effect on<br />
conductivity increase.<br />
- 239 -
XI. Workshop of Physical Chemists and Electrochemists´11 Brno<br />
X 2<br />
Y 2<br />
O<br />
O<br />
H N N H<br />
Y 1<br />
X 1<br />
BPPB X1=X2=Y1=Y2=CH<br />
2PyPPB X1=N, X2=Y1=Y2=CH<br />
2PyPP2Py X1= X2=N, Y1=Y2=CH<br />
4PyPPB<br />
4PyPP4Py<br />
(DPPP)<br />
X1=X2 = CH,<br />
Y1= N,<br />
Y2=CH<br />
X1= X2=CH, Y1=Y2=N<br />
Fig. 1 4PyPP4Py or 3,6-bis-(4´-pyridyl)-2,5-dihydropyrrolo[3,4-c]pyrrole-1,4-dione<br />
(DPPP - DiPyridyldiketoPyrrolo-Pyrrole)<br />
and the family of some DPP<br />
analogues 0.<br />
- 240 -<br />
Pt 1000 thermometer<br />
interdigital electrode system<br />
heater 8±1 <br />
Fig. 2 Commercial sensor<br />
platform KBI2 (Tesla Blatná)<br />
2. EXPERIMENT<br />
Corundum based sensor platform with interdigital system of electrodes (IDE)<br />
contains 10533 parallel squares between platinum contacts on a square flat 2x2 mm<br />
inside (Fig. 2). It is surrounded by heater of 8 and Pt 1000 thin film resistor for<br />
temperature measurement. It contains 79 contact strips 15 μm in width.<br />
The evaporated substance was available in powder form only poorly soluble in<br />
organic solvents, but they exhibit good thermal resistance against pyrolysis and can be<br />
sublimated as was before tested by thermogravimetric analysis 0. The deposition of<br />
the active DPP layer was carried out in the vacuum coating facility with ultimate<br />
pressure 1•10 -5 Pa. by irradiative heating of pellets 5.8 mm in diameter and of about 30<br />
mg of mass. The evaporator was designed in order to minimalize possible<br />
decomposition. The deposition rate was typically 0.2 to 0.5 nm/s. The hydrogen<br />
sensing device consisted of DPP(40 nm)–Pd(0,3 nm)–DPP(40 nm) three layer<br />
structure; Pd interlayer was evaporated from a graphite boat without vacuum<br />
breaking.<br />
Sensor testing facility was built up with respect to experience with operation of<br />
more complex facility presented in 0. The premixed 5 % hydrogen in nitrogen gas<br />
cylinder was used due to safety reasons, and for higher hydrogen concentrations an<br />
electrolyser followed by l-N2 cold trap with safety leakage fuse was used. The facility<br />
was controlled by a software virtual instrument programmed in LabView as well as<br />
the data acquisition. Keithley 500 electrometer with AD converter enabled to measure<br />
current down to 10 -14 A.
XI. WWorkshop<br />
of Phyysical<br />
Chemists and Electrocheemists´11<br />
3. RESULTTS<br />
AND DISCUSSI<br />
D ION<br />
The senssing<br />
structu ure accordinng<br />
to Fig. 2 was tested d at first in p<br />
for 24 hour peeriod<br />
load – Fig. 4. Thhe<br />
initial int trinsic cond ductance (w<br />
of tthe<br />
structurre<br />
depends s on Pd intterlayer<br />
thi ickness. Th he conducta<br />
wass<br />
round 10-13<br />
-1 , it correspondss<br />
to specifi ic conducti ivity 10<br />
periiod<br />
measurrement<br />
can be dividedd<br />
into 5 reg gions: 1 – b<br />
-12<br />
pure dry hy<br />
without hy<br />
ance of DP<br />
<br />
efore hydro<br />
-1cm-1 ydrogen<br />
ydrogen)<br />
PP layer<br />
. The<br />
long<br />
rogen inlet, voltage<br />
Fig. 3 Frresh<br />
sensor r response at a medium<br />
vvoltage<br />
and concentrat tion<br />
of 2 V was appplied<br />
and a relaxationn<br />
was obser rved for a few f minutees.<br />
Dry air flushed<br />
out the humiddity<br />
and it caused c fall ooff<br />
the init tial current.<br />
2 – 100% dry hydrog gen was<br />
appplied<br />
and ann<br />
increase of o the curreent<br />
over thr ree orders was w observeed,<br />
first rap pid, than<br />
conntinued<br />
slowwly<br />
for abou ut 1000 s. 33,<br />
4 – the sa aturation te endency waas<br />
replaced by slow<br />
degradation<br />
foor<br />
18 hours in hydrogeen.<br />
The cur rrent decrea ased by morre<br />
than an order. 5<br />
– fluush<br />
out witth<br />
dry air continued c tthe<br />
next day<br />
and drop the currennt<br />
by five orders o to<br />
2.100<br />
vari<br />
init<br />
13A. Oxygeen<br />
in air ca aused accelleration<br />
of recovery but b also irreeversible<br />
st tructure<br />
iation tookk<br />
effect in further cuurrent<br />
decr rease more than two orders bel low the<br />
ial current. .<br />
- 241 -<br />
Brno
XI. Workshop of Physical Chemists and Electrochemists´11 Brno<br />
Fig. 4 Fresh sensor response on pure dry hydrogen and recovery in dry air. Applied<br />
voltage was 2V.<br />
At the next sample (Fig. 3) 1 % H2 in N2 gas was switched on/off rapidly after<br />
500 s with dry air also for 500 s and this treatment was repeated for several times. The<br />
response time is faster and the recovery becomes slower using higher hydrogen<br />
concentration. Every air flushes out offered a dose of oxygen causing regular<br />
sensitivity decrease. So far also the intrinsic conductance falls down by the same slope<br />
and the ratio of hydrogen stimulated conductance to intrinsic conductance is<br />
constant, it can be explained as a decrement of sensitive component in the layer but it<br />
was not confirmed yet. The recovery continues in air for hours and in 24 hour the<br />
current fell down below the initial value.<br />
4. CONCLUSION<br />
Nitrogen in hetero-arenes can accept proton and shifts the charge dipole of the<br />
molecule. While the molecule contains a conjugated chain, a variation of conductivity<br />
occurs. A compound 4PyPP4Py was successfully applied for thin film hydrogen sensor<br />
fabrication and its characteristics were tested. The rapid response of several orders of<br />
magnitude on 100 % H2 was observed as well as in H2/N2 gas mixture, while in H2/air<br />
due to oxygen presence is the sensitivity about an order lower. But oxygen plays<br />
crucial role in recovery of initial state. Long period test cycling leads to sensor<br />
degradation, which principle is not explained yet.<br />
5. ACKNOWLEDGEMENT<br />
This work has been supported by the Czech Science Foundation in the project<br />
GACR 203/08/1594 and by the Ministry of Industry and Trade of the Czech Republic<br />
in the project FR-TI1/144.<br />
6. REFERENCES<br />
[1] Luňák, S., Vyňuchal, J. et al.: Journal of Molecular Structure, 983 (2010), 1-3, 39<br />
[2] Takahashi H., Mizuguchi J., J. Appl. Phys. 100(2006), 034908<br />
[3] Salyk, O., Castello, P. et al.: Measurement Science and Technology, 17(2006), 6, 3033<br />
- 242 -
XI. WWorkshop<br />
of Phyysical<br />
Chemists and Electrocheemists´11<br />
INNSTRUUMEN<br />
NT FOR<br />
FLU UORES SCENTT<br />
BIIOSENNSOR<br />
Jiří SEDLÁČEK<br />
HUUBÁLEK1<br />
K1 , Šárka BIDMANOVVÁ<br />
2 , Zbyně ěk PROKOP P2 , Břetislavv<br />
MIKEL3 , Jaromír<br />
Department oof<br />
Microelect tronics, Brno University of f Technology y, Technická 110,<br />
616 00 Brn no, Czech<br />
Republic<br />
2 Depart tment of Expeerimental<br />
Bio ology, Masary yk university, , Brno, Czech h Republic<br />
3 Institut ute of Scientifi fic Instrument ts of Academy y of Sciences s of the Czech h Republic<br />
1 D<br />
Abstract<br />
This<br />
device wwas<br />
design ned as a flluorescence<br />
e analyzer for the ddetection<br />
of o toxic<br />
subsstances<br />
due<br />
to (bio)c chemical reeaction<br />
tha at changes fluorescennce<br />
emissio on after<br />
lighht<br />
excitationn.<br />
Optical method m is aalso<br />
used fo or their nois se tolerancee<br />
and the ability<br />
to<br />
trannsfer<br />
signalls<br />
over long g distancess<br />
with only y minimal losses l of siggnal.<br />
Fluor rescence<br />
subsstance<br />
is appplied<br />
to th he end of ann<br />
optical fib bre which is connecteed<br />
to the de evice. It<br />
preddestines<br />
thee<br />
device to be used forr<br />
measurem ments in dee ep wells wiith<br />
drinking g water.<br />
1. INTRODDUCTION<br />
N<br />
This insttrument<br />
wo orks as fluoorescence<br />
detector d for r biosensor. . Main part ts of the<br />
biossensor<br />
are bio-recog gnition parrt<br />
and ph hysical-chem mical trannsducer.<br />
Th he bio-<br />
recoognition<br />
paart<br />
must be in contact with the testing<br />
samp ple. The traansducer<br />
ge enerates<br />
optiical<br />
signal that is im mmediately converted d to electri ical signal for proces ssing by<br />
circcuitry.<br />
The basic prin nciple of itts<br />
function n is demonstrated<br />
in Fig. 1. An nalyte is<br />
carrried<br />
to bio-recognitio<br />
on part to rreact<br />
with the analyt te to detectt<br />
toxic sub bstances.<br />
Thee<br />
reaction of analyte with bio-recognition<br />
n part cha anges chemmical<br />
values s on its<br />
surfface<br />
causing<br />
fluoresce ence ampliffication/atte<br />
enuation. The T opticall<br />
signal is detected d<br />
by tthe<br />
light detector<br />
and d processedd.<br />
Acquired d information<br />
are anaalysed<br />
by so oftware.<br />
Thee<br />
sensing part prov vides non-stop<br />
elect tronic sign nal. The ssignal<br />
is directly<br />
propportional<br />
too<br />
concentra ation of onne<br />
or severa al chemical substances s in the ana alyte [1].<br />
This<br />
device caan<br />
be used as analyzer<br />
of pestici ides for am mbient exammination<br />
(th he most<br />
ofteen<br />
in water).<br />
Fig. 11:<br />
Schematic<br />
of biose ensor.<br />
- 243 -<br />
Brno
XI. Workshhop<br />
of Physical l Chemists and Electrochemists<br />
E<br />
s´11<br />
2. EXPERIMEENT<br />
The<br />
device cconsists<br />
of two main pparts:<br />
an el lectronic an nd an opticcal<br />
section. For<br />
controll<br />
and signall<br />
processing g the persoonal<br />
compu uter with so oftware is uused.<br />
The optic o<br />
part is iin<br />
Fig. 2 annd<br />
it is constructed<br />
wiith<br />
two cha annels with h one monoolithic<br />
dete ector<br />
of lightt.<br />
It consistts<br />
of two LE ED diodes as light sou urces about t wave lenggth<br />
of 590 nm.<br />
Part A is a dichroic<br />
mirror th hat reflectss<br />
light source<br />
and tran nsmits the ssignal<br />
from m the<br />
sensingg<br />
part. Part B is an optical<br />
lens. TThe<br />
lenses fo ocus the lig ght to the pphoton<br />
dete ector<br />
(PMT). Part C is aan<br />
optic filte er for speciified<br />
source e wave leng gth.<br />
TThe<br />
device has power supply fromm<br />
AC 230V V. Time div vision multi tiplex is use ed to<br />
scan thhe<br />
channelss.<br />
Light em mitted fromm<br />
LED diod de goes thr rough opticc<br />
filter (C) and<br />
reflectss<br />
on dichroiic<br />
mirror (A A) and goess<br />
to optic fib bre. The lig ght excites tthe<br />
fluorescent<br />
and creeates<br />
new optic radia ation. The new light goes throu ugh optic ffibre<br />
and optic o<br />
filter ( C) and thhrough<br />
dich hroic mirrror.<br />
The le ens (B) focuses<br />
the new light t on<br />
photodetector<br />
whhich<br />
convert ts the opticcal<br />
signal in nto an analo og electricaal<br />
signal.<br />
Fig. 2: Schhematic<br />
cu ut of optic part p<br />
AAn<br />
electric signal from m the phottodetector<br />
is processe ed by electtronic<br />
part. . All<br />
processsing<br />
is conntrolled<br />
by microconttroller.<br />
US SB bus is used u for coonnection<br />
and<br />
commuunication<br />
wwith<br />
PC. LE EDs inside oof<br />
the optic cal part are e controlledd<br />
with curr rent.<br />
Power supply is cconstructed<br />
inside of tthe<br />
device including transformer t r source of f 230<br />
Vac annd<br />
three monolithic<br />
voltage v reguulators.<br />
Tw wo of them m are used for symme etric<br />
source ±15 V for pphoto<br />
detec ctor and onee<br />
(+5 V) is used u for the<br />
electroniccs.<br />
3. RRESULTS<br />
AND DIS SCUSSIONN<br />
Testing<br />
meaasurements<br />
were madee<br />
on the de eveloped fl luorescencee<br />
detector. The<br />
sample under testing<br />
was loc cated into tthe<br />
dark bo ox. Emitted d light, whiich<br />
was created<br />
by chemmical<br />
reaction,<br />
was fe ed via a plasstic<br />
optical fibre. The same opticcal<br />
fibre is used u<br />
for exciitation<br />
of bbio-chemica<br />
al transduccer.<br />
The fib bre spike wa as coated wwith<br />
the mi ix of<br />
fluoresccent<br />
indicaator,<br />
haloge en, halogennated<br />
analyt te and elem ments whichh<br />
degraded d the<br />
analytee.<br />
The<br />
measureement<br />
was made in aanalyte<br />
con ntaining pesticide.<br />
It wwas<br />
found that<br />
the signnal<br />
obtaineed<br />
is slight tly noised. Therefore, , averaging the samplles<br />
was car rried<br />
out. Thhe<br />
resulting waveform is in the Fiig<br />
3.<br />
- 244 -<br />
Brno
XI. WWorkshop<br />
of Phyysical<br />
Chemists and Electrocheemists´11<br />
Fig. .3: Graph of measur red curves, , after ave eraging filtering<br />
of mmeasured<br />
samples. s<br />
LED iintensity:<br />
100 %, signal was w recor rded in 4·10-9 M 5(6)-<br />
carboxyynaphthoflu<br />
uorescein<br />
dissolveed<br />
in 1 mM M HEPES buuffer<br />
with pH p 4.0 and pH 9.0.<br />
4. CONCLLUSION<br />
The deviice<br />
was dev veloped andd<br />
construct ted. The flu uorescent aanalyzer<br />
wa as tested<br />
in ddetail<br />
in Losschmidt<br />
lab boratories, MMasaryk<br />
University U of<br />
Brno<br />
Measurements<br />
show wed that thhe<br />
used fluo orescent giv ves an apprropriate<br />
sign nal. The<br />
reasson<br />
is the llow<br />
yield of o used fluoorescent<br />
an nd a small area a of the optical fiber<br />
spike<br />
thatt<br />
is coated wwith<br />
an enz zyme.<br />
Higher ssignals<br />
and lower deteection<br />
limi its will be obtained wwhen<br />
using g a fiber<br />
withh<br />
larger crross<br />
section n and anotther<br />
fluore escent, whi ich will haave<br />
a bette er yield<br />
emiission.<br />
5. ACKNOOWLEDGE<br />
EMENT<br />
This worrk<br />
has been n supported d by Grant Agency A of the t Czech RRepublic<br />
un nder the<br />
conntract<br />
GACRR<br />
P102/11/ 1068 and bby<br />
the Czec ch Ministry y of Educatiion<br />
in the frame f of<br />
Research<br />
Plan MSM 0021 1630503 (MMIKROSYN<br />
N).<br />
6.<br />
[1]<br />
[2]<br />
[3]<br />
REFEREENCES<br />
TRÖGL, JJosef.<br />
Biosenz zory. Automma<br />
[online]. 2004, 2 č. 4 [c cit. 2008-11--29].<br />
On the e WWW:<br />
. ISSN 12210-9592.<br />
SEDLÁČEK,<br />
J. Biosenso or of Halogennated<br />
Compo ound as Instrument<br />
using fluorescence e method.<br />
Brno: Diploma<br />
thesis: Brno Univerrsity<br />
of Tech hnology, Facu ulty of Electrrical<br />
Enginee ering and<br />
Communiccations,<br />
2010.<br />
63 s. Supervvisor:<br />
doc. Ing g. Jaromír Hub bálek, Ph.D.<br />
BIDMANOOVÁ,<br />
Šárka. . Developmeent<br />
and Co onstruction of Biosensorrs<br />
for Dete ection of<br />
Halogenated<br />
Compoun nd in the EEnviroment.<br />
Brno, 2007. 75 s. Diplloma<br />
thesis. Masaryk<br />
Universityy,<br />
Faculty of Sciencies, Deept.<br />
of experimental<br />
micro obiology. Suppervisor<br />
Doc. Mgr. Jiří<br />
Damborskký,<br />
Dr.<br />
- 245 -<br />
Brno
XI. Workshop of Physical Chemists and Electrochemists´11 Brno<br />
NOVEL REACTIVITY – MAPPING<br />
TECHNIQUE FOR CHARACTERIZATION<br />
OF POLYELECTROLYTE BIOPOLYMERS<br />
Petr SEDLÁČEK 1 , Jiří SMILEK 2 , Martina KLUČÁKOVÁ 1<br />
1 Center for Materials’ Research, Brno University of Technology, Faculty of Chemistry, Purkyňova 118,<br />
Brno<br />
2 Institute of Physical and Applied Chemistry, Faculty of Chemistry, Purkyňova 118, Brno<br />
Abstract<br />
The contribution discusses possibilities of introducing simple diffusion techniques in<br />
automatized reactivity – mapping studies of biopolymers. As is illustrated on some<br />
preliminary results on humic acids, combination of a standard method of horizontal<br />
diffusion cells, optimized for required experimental conditions, with an appropriate<br />
hydrogel form of biopolymer under investigation provides interesting novel approach<br />
for simple macroscopic observation of interactions which take place on the molecules<br />
of the biopolymer.<br />
1. INTRODUCTION<br />
Polyelectrolyte biopolymers are found everywhere around us. On the one side,<br />
they are crucial constituents of living organisms, but in a form of humus, they also<br />
represent a key component of many non-living parts of nature – soils, waters and<br />
sediments. We routinely call these materials highly reactive but what exactly does it<br />
mean? And how such a property of wide comprehension can be measured and<br />
quantified?<br />
The most widespread approaches are based on adsorption experiments [1, 2] –<br />
biopolymers of various forms (solution, sol, suspension) are let in contact with a range<br />
of species to be sorbed and a variety of different sorption parameters is determined<br />
corresponding actual experimental condition. This approach brings several serious<br />
drawbacks. For example, the homogeneity of such media as colloidal sols or<br />
suspensions is always a question, as well as a corresponding size of biopolymer<br />
particles in them often resulting in the fact that a interaction of such a particle with a<br />
sorbate is limited just on the surface of the particle. The actual experimental<br />
conditions also play a crucial role: we should ask whether the medium is agitated or<br />
not and if yes, on what rate? Are we studying kinetics or equilibrium of the sorption?<br />
And finally, it is quite complicated to get the results from such diverse experiments in<br />
a universal form allowing a comparison in reactivity among various biopolymers.<br />
Diffusion techniques can provide an interesting and simple experimental<br />
alternative. If we prepare a homogeneous medium from studied polyelectrolyte and<br />
we let appropriate compound – probe – diffuse into or through the medium, we will<br />
be able to simultaneously explore the transport of the probe with its interactions with<br />
- 246 -
XI. Workshop of Physical Chemists and Electrochemists´11 Brno<br />
the surrounding media. Such diffusion processes are (under appropriate experimental<br />
conditions) easily observed; the mathematical apparatus for the data evaluation is well<br />
explained [3] and gives us some standard parameters – diffusion coefficients – in<br />
whose values all interactions in the system are involved. Just the first step –<br />
preparation of a homogeneous medium – could be a problem.<br />
For this purpose, preparation of a hydrogel form of a biopolymer could be the<br />
method of choice. The gel form can be considered a system allowing fixation of<br />
biopolymeric matrix in aqueous medium while enabling interactions in the whole<br />
volume. Consequently, not only physico-chemical interactions with the biopolymeric<br />
content but also simultaneous transport within the volume are observed<br />
experimentally. From the experimental point of view, gel media bring several<br />
advantages concerning a study of diffusion. It allows preparing sample in defined size<br />
and shape, which is necessary for mathematical description of a transport<br />
phenomenon. Besides, mechanical and thermal convection of a liquid is markedly<br />
suppressed by the gel matrix. For the measurement of diffusion coefficients, the<br />
majority of authors apply expensive and sophisticated spectroscopic (usually based on<br />
a light scattering) or nuclear methods [4-5]. In these cases, a homogeneous system is<br />
studied where no concentration gradient of the considered solute occurs and the value<br />
of diffusivity represents so called self - diffusion coefficients. On the other hand, there<br />
are simple laboratory methods that allow performing diffusion governed by a<br />
concentration gradient; usually, these techniques are not demanding on laboratory<br />
equipment and they provide a more reasonable sight on solute-release systems. A<br />
handlist of these methods is presented in [6]. For the automatized determination of<br />
diffusion coefficients, the method of the diffusion cells (often called the Stokes or<br />
Franz cells) represents the method of choice [7]. A probe is diffusing along initial<br />
concentration gradient between two solution compartments (cells) through a gel<br />
sample and a change in the concentration is monitored in both cells. A wide range of<br />
properties of these solutions can be easily adjusted and corresponding response in<br />
diffusivity can be determined.<br />
In previous works, several laboratory techniques were used in order to study<br />
diffusion of metal ions in a gel prepared from humic acids (HAs) [8-9]. This gel is<br />
prepared by the guided coagulation of alkaline solution of HAs by an addition of a<br />
strong acid. The humic gel was used as a model of natural environments which<br />
contains high amount of humic substances (soils and sediments). Humic acids are<br />
chemically reactive; they possess a wide range of functionalities that could change<br />
when structural modifications are made to acquire desired properties. This<br />
contribution represents the results of preliminary experiments concerning diffusion of<br />
metal ions in diffusion cells through various samples of hydrogels with content of<br />
humic acids.<br />
2. EXPERIMENT<br />
Exact method of isolation of lignitic HAs is published in details elsewhere [8-9].<br />
Humic hydrogels were prepared by precipitation of dissolved HAs (concentration 8<br />
- 247 -
XI. Workshop of Physical Chemists and Electrochemists´11 Brno<br />
g.dm –3 ) by concentrated hydrochloric acids to pH ~ 1. After the suspension had been<br />
kept overnight at 4°C, the sedimented gel was separated by centrifugation at 4000<br />
RPM. Two gel samples used in diffusion experiments differed in the particular solvent<br />
utilized in dissolving original humic acids:<br />
sodium hydroxide was used in concentration 0.5 mol.dm –3 (resulting in gel A)<br />
and sodium triphosphate in concentration 0.1 mol.dm –3 (resulting in gel B). For<br />
determination of diffusion coefficient of cupric ions in both gels, the same diffusion<br />
cells apparatus with cell volume of 60 cm 3 was used. Initial concentrations of CuCl2 in<br />
“out” and “in” cells were 100 mol.m –3 and 0, respectively. In the apparatus, gel was<br />
fixed in a plastic insert as a cylinder 1 cm in length, 4 cm in diameter. Changes in<br />
concentration of cupric ions in the “in” cell were observed by means of UV-VIS<br />
spectroscopy – optical fibre probe was directly dipped in the cell and scanned UV-VIS<br />
spectra during the experiment.<br />
3. RESULTS AND DISCUSSION<br />
Fig. 1 shows the change in concentration of cupric ions in “in” cell (which had<br />
initially contained no cupric ions). As can be seen, there is not any pronounced<br />
difference between the two gels. Diffusion coefficients, calculated from regressions of<br />
the linear parts of these dependences are 3.58·10 –10 m 2 .s –1 (gel A) and 3.66·10 –10 m 2 .s –1<br />
(gel B). These results are well expected: the nature (morphological and chemical<br />
structure) of both gels was the same; there was no significant difference in solid<br />
content of the gel or in the inner pH. These values are lower as compared with<br />
diffusion of cupric ions in water (14.3·10 –10 m 2 .s –1 , see [10]). This is typically obtained<br />
for reactive hydrogels with high content of water (both gels contained about 85 % of<br />
water in weight).<br />
The diffusion cells apparatus is designed for measurement under various<br />
conditions. It allows us to change a parameters of inner solutions (pH, ionic strange)<br />
which gives us deeper knowledge about interactions which take place in the system.<br />
Besides, the temperature of the experiment can be easily altered. It was<br />
experimentally confirmed, that diffusion coefficient of cupric ions in gel A increases<br />
with increasing temperature as follows: 3.58·10 –10 m 2 .s –1 (30 °C), 6.43·10 –10 m 2 .s –1 (40 °C)<br />
and 9.08·10 –10 m 2 .s –1 (50°C).<br />
- 248 -
XI. Workshop of Physical Chemists and Electrochemists´11 Brno<br />
c Cu (mol.m –3 )<br />
16<br />
14<br />
12<br />
10<br />
8<br />
6<br />
4<br />
2<br />
0<br />
gel A<br />
gel B<br />
0 20 40 60 80<br />
time (hrs.)<br />
Fig.1 Increase of the concentration of cupric ions in the “in” cell of the apparatus at<br />
30°C.<br />
4. CONCLUSION<br />
On the example of some preliminary results, the high potential of measurement<br />
of diffusion coefficient in biopolymer hydrogels using diffusion cells is presented. This<br />
provides an automatized, universal and experimentally non-demanding technique for<br />
some standardisable reactivity mapping studies on biopolymers.<br />
5. ACKNOWLEDGEMENT<br />
The work has been supported by government funding – Czech Science<br />
Foundation, project P106/11/P697.<br />
6. REFERENCES<br />
[1] Wan Ngah, W.S., Teong, L.C., Hanafiah, M.A.K.M.: Carbohydrate Polymers, 83 (2011), 4, 1446<br />
[2] Klučáková, M., Pekař, M.: Journal of Polymer Materials, 20 (2003), 2, 145<br />
[3] Crank J.: The Mathematics of Diffusion, Clarendon Press, 1956, Oxford<br />
[4] Manetti, C. et al.: Polymer, 43 (2001), 1, 87<br />
[5] Ray, S.S. et al.: Chemical Engineering Science, 53 (1998), 5, 869<br />
[6] García-Gutiérrez, M. et al.: Journal of Iberian Geology, 32 (2006), 1, 37<br />
[7] Falk, B., Garramone, S., Shivkumar, S.: Matterial Letters, 58 (2004), 3261<br />
[8] Sedláček, P., Klučáková, M.: Geoderma, 153 (2009), 1–2, 286 – 292<br />
[9] Sedláček, P., Klučáková, M.: Collect. Czech. Chem.C., 74 (2009), 9, 1323 – 1340<br />
[10] Lide D.R.: Handbook of Chemistry and Physics, 76th ed., CRC Press, 1995, New York<br />
- 249 -
XI. Workshop of Physical Chemists and Electrochemists´11 Brno<br />
DPPH AQUEOUS ANTIOXIDANT ASSAY<br />
SOLUTION<br />
Karel SEDLÁŘ 1 , Kristýna SMERKOVÁ 2 , Helena ŠKUTKOVÁ 1 , Jiří SOCHOR 2 , Vojtěch<br />
ADAM 2 , Ivo PROVAZNÍK 3 , René KIZEK<br />
1 Department of Biomedical Engineering, Faculty of Electrical Engineering and Communication, Brno<br />
University of Technology, Kolejni 4,CZ-61 200 Brno, Czech Republic<br />
2 Department of Chemistry and Biochemistry, Faculty of Agronomy, Mendel University in Brno,<br />
Zemedelska 1, CZ-613 00 Brno, Czech Republic<br />
3 International Clinical Research Center, St. Anne's University Hospital Brno, Brno, Czech Republic<br />
Abstract<br />
DPPH is a free radical commonly used in antioxidant assay. A purple coloured<br />
solution which becomes colourless after reaction with antioxidant is convenient to<br />
spectrofotometric analysis. Unfortunately, there are many protocols providing<br />
different results, so we are unable to compare them among laboratories. We tried to<br />
examine presumptions about stability of DPPH molecule as a common condition for<br />
many protocols. Using different temperatures and antioxidants (ascorbic acid, salicylic<br />
acid, homocysteine, etc.) we found out that some presumptions are wrong.<br />
1. INTRODUCTION<br />
Under normal conditions DPPH (2,2-diphenyl-1-picrylhydrazyl) is a dark<br />
crystalline substance [1] available as a powder. Free radical molecules are stable in this<br />
form. For antioxidant assay DPPH liquid solutions are used. Even in solution,<br />
molecules are considered as stable, unresponsive to molecules of solvent [2]. Purple<br />
colour solution is used for DPPH spectrofotometric assay, maximum absorbance is in<br />
the band about 520 nm [3]. Free radical molecules are neutralized in the reaction with<br />
antioxidants and solution becomes colourless. Due to stability and undemanding<br />
storage conditions DPPH is widely used. Except testing antioxidants DPPH is a<br />
scavenger for other free radicals.<br />
2. EXPERIMENT<br />
Because of many different protocols used in DPPH antioxidant assay we tried to<br />
test some factors that according to many protocols do not affect measurement results.<br />
These are mainly temperature influence and measuring time. However there are<br />
newer protocols that discovered some mistakes [4]. They do not use water as the<br />
solvent.<br />
We made samples with six different concentrations of DPPH (100 μM, 75 μM,<br />
50 μM, 20 μM, 10 μM, 5 μM). Solvent was distilled water. Then we watched the<br />
evolution of the spectrum, depending on the sample concentration at three different<br />
temperatures (15°C, 25°C, 35°C). For every sample at all temperatures we measured<br />
absorbance spectrum half an hour every 3 minutes for sample and for sample<br />
interfused with antioxidant separately. As antioxidants we took 100 μM solutions of<br />
- 250 -
XI. WWorkshop<br />
of Phyysical<br />
Chemists and Electrocheemists´11<br />
saliccylic<br />
acid, cysteine, acetylcystei a ine, homoc cysteine, tro olox, ascorbbic<br />
acid an nd gallic<br />
acidd.<br />
For interffusion<br />
we took t 1000 μμl<br />
of DPPH and 100 μl l of antioxiddant.<br />
3.<br />
RESULTTS<br />
AND DISCUSSI<br />
D ION<br />
Fig. .1 DPPH abbsorbance<br />
spectrum s deepending<br />
on<br />
concentr ration<br />
Firstly wwe<br />
took abso orbance speectrums<br />
for r every con ncentration and recons structed<br />
evolution<br />
of tthe<br />
spectru um dependiing<br />
on con ncentration of the sammple.<br />
We realized<br />
thatt<br />
concentraations<br />
lowe er than 20 μM are un nder resolut tion of specctrophotom<br />
meter so<br />
we released thhem<br />
from an nother anallysis.<br />
Becau use we had only 4 conncentrations<br />
on the<br />
inteerval<br />
betweeen<br />
20 and 100 μM wee<br />
interpose ed data with h cubic spliine.<br />
Thanks<br />
to this<br />
inteerpolation<br />
wwe<br />
got smo oother evollution<br />
that better repr resent real evolution. Results<br />
at 15°C<br />
and 355°C<br />
are simi ilar.<br />
From thee<br />
figure ab bove you caan<br />
also rea alize that ab bsorbance peak is hig gher for<br />
highher<br />
concenntrations.<br />
So S we toook<br />
absorba ance vector r for 100 μM DPPH H using<br />
funcction<br />
max tto<br />
get maxi imal absorbbance.<br />
Com mparing it with w vector we get its position p<br />
reprresenting<br />
wwavelength.<br />
The maxiimum<br />
absor rbance at 530 5 nm, wee<br />
set identic cally for<br />
all ttemperaturres.<br />
We use ed this wavvelength<br />
lat ter for getti ing decreasse<br />
of absorb bance of<br />
sammples<br />
with aantioxidant<br />
ts.<br />
Howeverr<br />
DPPH ra adical moleecules<br />
are considered c to be stablle<br />
in time even in<br />
soluution<br />
we decided<br />
to check c absoorbance<br />
spe ectrum evolution<br />
for one concen ntration<br />
deppending<br />
on time.<br />
- 251 -<br />
Brno
XI. Workshhop<br />
of Physical l Chemists and Electrochemists<br />
E<br />
s´11<br />
Fig.2 0. .75 μM DPPPH<br />
absorba ance spectrrum<br />
depend ding on tim me at 25°C (left) and 35°C 3<br />
(right)<br />
Frrom<br />
the figgures<br />
above e a decreasse<br />
of absorb bance in tim me is evideent.<br />
Unlike e the<br />
neutrallization<br />
reaaction<br />
with an antioxiidant,<br />
whic ch reduces only the hhighest<br />
pea ak in<br />
this casse<br />
the whoole<br />
spectrum m is reduceed.<br />
We thin nk it could mean thatt<br />
molecules s are<br />
not as sstable<br />
as theey<br />
are cons sidered. Thee<br />
explanation<br />
might be<br />
DPPH sppecific<br />
beha avior<br />
towards<br />
other raddicals<br />
when it acts as a radical tra ap [5]. The radiation ppassing<br />
thro ough<br />
the sammple<br />
in the spectropho otometer coould<br />
cause formation of free radi dicals in solv vent<br />
- waterr,<br />
which wwould<br />
react t with DPPPH.<br />
This reaction r could<br />
cause the absorp ption<br />
spectruum<br />
changinng.<br />
The<br />
point iis<br />
that it is s necessaryy<br />
to measu ure both DPPH D sampple<br />
and DP PPH<br />
sample with antiioxidant<br />
at t the same<br />
time. Th he result is then thhe<br />
decrease e of<br />
absorbaance<br />
(∆A) oobtained<br />
by y subtractinng<br />
the neutr ralized sam mple (An) byy<br />
DPPH sam mple<br />
itself As). (A Subscript<br />
t mean time. t Otherrwise<br />
the significant<br />
mistake m cann<br />
be brough ht to<br />
the anaalysis.<br />
∆<br />
, <br />
- 252 -<br />
,<br />
(1)<br />
Brno
XI. WWorkshop<br />
of Phyysical<br />
Chemists and Electrocheemists´11<br />
Fig. .3 Decreasee<br />
of absorba ance using ssalicylic<br />
aci id<br />
You can see the results<br />
for saliicylic<br />
acid in i the figur re above. Itt<br />
shows absorbance<br />
decrreases<br />
for DPPH sample s intterfused<br />
with w salicy ylic acid. For the highest<br />
conncentration<br />
of DPPH the samplee<br />
at 15°C has h the high hest decreaases<br />
of abso orbance.<br />
Butt<br />
for the loower<br />
conce entrations the situatio on is chan nging. 75 μμM<br />
DPPH has the<br />
highhest<br />
decreaase<br />
at 25°C C and for oother<br />
conce entrations the maximmum<br />
decrea ase is at<br />
35°CC.<br />
If the ssamples<br />
we ere stable tthe<br />
decreas se would grow g in timme.<br />
But th here are<br />
seveeral<br />
situatioons<br />
where the decreaase<br />
is decre easing. Tha at shows innstability<br />
of f DPPH<br />
mollecules.<br />
Theese<br />
various s results shoow<br />
that the e antioxidant<br />
behavioour<br />
of salicy ylic acid<br />
is veery<br />
individdual<br />
and the ere is no general<br />
rule.<br />
4. CONCLLUSION<br />
Howeverr<br />
the DPPH H antioxidaant<br />
assay is commonly y used in mmany<br />
labora atories a<br />
lot of results can be wrong.<br />
DPPHH<br />
radical molecules m in<br />
solution are consid dered as<br />
stabble,<br />
but outt<br />
results sh hown someething<br />
diffe erent. Also antioxidannt<br />
behavior r highly<br />
deppends<br />
on twwo<br />
paramete ers: concenntration<br />
of DPPH D and sample temmperature.<br />
5. ACKNOOWLEDGE<br />
EMENT<br />
This woork<br />
was supported s by GAČR R 102/09/H H083, MSMM0021630513<br />
and<br />
Eurropean<br />
Regional Developpment<br />
Fund F - Project t FNUSA A-ICRC<br />
CZ. 1.05/1.1.000/02.0123.<br />
6.<br />
[1]<br />
REFEREENCES<br />
Kiers, C. T.; De Boe er, J. L.; Ollthof,<br />
R.; Sp pek, A. L. (1976). ( "Thhe<br />
crystal st tructure<br />
of a 2,2-diph henyl-1-piccrylhydrazy<br />
yl (DPPH H) moddification".<br />
Acta<br />
Crystalloographica<br />
Section S B SStructural<br />
Crystallogr C raphy and Crystal Ch hemistry<br />
32: 2297. .<br />
- 253 -<br />
Brno
XI. Workshop of Physical Chemists and Electrochemists´11 Brno<br />
[2] Szabo MR, Idit C, Chambre D, Lupea AX. Improved DPPH determination for antioxidant<br />
activity spectrophotometric assay. Chemical Papers. 2007;61(3):214-216.<br />
[3] Jasprica I, Bojic M, Mornar A, et al. Evaluation of antioxidative activity of Croatian propolis<br />
samples using DPPH* and ABTS*+ stable free radical assays. Molecules Basel Switzerland.<br />
2007;12(5):1006-1021.<br />
[4] Sharma O, Bhat T. DPPH antioxidant assay revisited. Food Chemistry. 2009;113(4):1202-1205<br />
[5] Price GJ, Garland L, Comina J, et al. Investigation of radical intermediates in polymer<br />
sonochemistry. Research on Chemical Intermediates. 2010;30(7):807 - 827<br />
- 254 -
XI. Workshop of Physical Chemists and Electrochemists´11 Brno<br />
QUANTUM CHEMICAL CALCULATIONS<br />
OF [LI(DMSO) N] + COMPLEXES<br />
Vladimír SLÁDEK 1 , Vladimír LUKEŠ 1 , Martin BREZA 1 , Michal ILČIN 1<br />
1 Institute of Physical Chemistry and Chemical Physics, Slovak University of Technology, SK-812 37<br />
Bratislava, Slovakia.<br />
Abstract<br />
DFT studies of optimal geometries, energetics, electron structure and electron spectra<br />
of [Li(DMSO)n] + complexes, n = 1 to 6, are presented. The coordination number<br />
increase causes Li-O bond elongation and decreasing electron density transfer from<br />
oxygen to lithium. TD-DFT calculations of vertical electronic transitions for IEFPCM<br />
polarizable continuum model in DMSO solutions and molecular orbital analysis<br />
indicate that the Li–DMSO bonding is responsible for the blue shift of the original<br />
DMSO excitation energy. These type complexes are important for the drug-transport<br />
through the cell membranes in biological systems.<br />
1. INTRODUCTION<br />
Dimethyl sulfoxide (DMSO), (CH3)2SO is remarkably versatile, theoretically<br />
interesting and technologically important aprotic solvent with relevance in various<br />
fields of chemistry. DMSO penetrates skin and other cell membranes without<br />
damaging and it could carry other compounds into biological systems [1, 2, 3]. This<br />
fact determines its use as a drug delivery system because it is less toxic than similar<br />
organic compounds of this class. In this context, the complex formation of DMSO<br />
molecules and metal ions receives an increasing attention in chemistry. Also the<br />
structure of solutions containing lithium cation has received unique attention in<br />
solution chemistry due to its special features in forming solvate shells.<br />
The main goal of our work is the DFT investigation of the optimal geometry,<br />
energetics, electron structure and electron spectra of [Li(DMSO)n] + complexes for n<br />
= 1 6. Vertical excited states will be calculated using Time-dependent DFT method<br />
(TD-DFT) [4, 5]. The computed characteristics may be helpful for the interpretation<br />
of spectroscopic measurements in solutions, as well as for the understanding of<br />
complex formation of organic molecules (e.g. potential drugs) with metal atom and<br />
DMSO molecules.<br />
2. QUANTUM CHEMICAL METHODS<br />
The electronic ground state geometries of the studied systems were optimized at<br />
DFT (B3LYP hybrid functional [6]) levels of theory. Based on the optimized B3LYP<br />
geometries, the vertical transition energies and oscillator strengths were computed by<br />
TD-B3LYP method. The DMSO solvent effects consequences on the vertical electron<br />
transitions of the studied systems were estimated using the Integral Equation<br />
Formalism Polarizable Continuum Model (IEFPCM) for vacuum geometries [7]. All<br />
- 255 -
XI. Workshop of Physical Chemists and Electrochemists´11 Brno<br />
calculations were performed using Gaussian 03 [8] program package. The calculations<br />
were performed in the basis set which consists of 6-31+G* for carbon, oxygen and<br />
hydrogen and 6-311+G* for sulphur and lithium atoms (B1 basis).<br />
3. RESULTS AND DISCUSSION<br />
In order to asses the differences between the complexes, all singlet electron<br />
transitions up to the 7.5 eV were evaluated using TD-B3LYP(IEFPCM) method. The<br />
obtained energies and relevant oscillator strengths are depicted in Figure 1. The<br />
lowest electron transitions with the first non-zero oscillator strengths are collected in<br />
Table 1. Free DMSO molecule gives six dominant transitions with the oscillator<br />
strength over 0.03. These results are in good agreement with the experimental<br />
absorption spectrum [9]. [Li(DMSO)n] + complexes formation causes the downshift of<br />
vertical excited states. These states are connected with the transitions within DMSO<br />
molecule (see molecular orbital analysis). On the other hand, the transitions reflecting<br />
the interaction between lithium atom and DMSO come into being. The next additions<br />
of DMSO up to n = 4 lead to the blue shift of the lowest excitation energy with nonzero<br />
oscillator strengths. The red shift of the transitions with dominant oscillator<br />
strength is indicated for the increasing coordination number (see the transition at 6.46<br />
eV for n = 3, 6.23 eV for n = 4, 6.13 eV for n = 4). The number of electron transitions<br />
with non-zero oscillator strengths is growing rapidly with increasing coordination<br />
number within the range from 5.4 to 6.5 eV.<br />
In order to understand the role of Li and DMSO interaction in the lowest<br />
vertical electronic transition, it is useful to examine the frontier molecular orbitals.<br />
The relevant B3LYP orbitals for the two lowest electronic transitions of [Li(DMSO)] +<br />
complex are presented in Figure 2. The HOMO orbital is regularly delocalized over<br />
DMSO molecule, i.e. mainly over sulphur and oxygen atoms. On the other hand, the<br />
LUMO lobe is spread over lithium atom. The HOMO to LUMO transition with 92 %<br />
contribution dominates in this optically allowed vertical transition. The shapes of the<br />
HOMO and LUMO+2 orbitals are identical with the HOMO and LUMO+1 orbitals of<br />
free DMSO molecule. The presence of Li atom is evidently responsible for the blue<br />
shift of the original DMSO energy transition from 5.59 eV to 6.97 eV. On the other<br />
hand, the consecutive catching of DMSO molecules by lithium cation has the<br />
tendency to shift the energy of this transition to 5.59 eV.<br />
Tab. 1: The lowest excitation energy with non-zero oscillator strength for studied<br />
systems. The order k of the transition is indicated by the second column and<br />
the values in parentheses stand for oscillator strengths.<br />
Complex k Energy [eV] Transitions<br />
DMSO 1 5.59 (0.058) HOMO LUMO+1<br />
[Li(DMSO)] +<br />
[Li(DMSO)2] +<br />
[Li(DMSO)3] +<br />
[Li(DMSO)4] +<br />
[Li(DMSO)5] +<br />
1 5.98 (0.019)<br />
HOMO LUMO<br />
6<br />
1<br />
9<br />
1<br />
5.99 (0.037)<br />
5.93 (0.014)<br />
5.89 (0.06)<br />
5.65 (0.006)<br />
HOMO LUMO+1<br />
HOMO LUMO<br />
HOMO LUMO; HOMO <br />
LUMO+1<br />
- 256 -
XI. WWorkshop<br />
of Phyysical<br />
Chemists and Electrocheemists´11<br />
Oscillator strenght<br />
[LLi(DMSO)66]<br />
+ 2<br />
0. 10<br />
0. 05<br />
0. 00<br />
180 190 200 210 220 230<br />
wavelenght (nm)<br />
Excitation energy (eVV)<br />
6.9 6.7 6.5 6.3 6.1 5.9 5.7 5.5 5.3<br />
0. 10<br />
0.005<br />
00.1<br />
0.005<br />
0. 10<br />
0.005<br />
0. 10<br />
0.005<br />
0. 10<br />
0.005<br />
0. 10<br />
0.005<br />
Excitation energy (eVV)<br />
6.9 6.7 6.5 6.3 6.1 5.9 5.7 5.5 5.3<br />
[Li(DMMSO)]<br />
italics s<br />
+ 200 210 220 230 Fig.2 Plo ots of the B3LYP/B1 B molecular orbitals<br />
wawelenght (nm)<br />
contribut ting to the e two lowwest<br />
transit tions of<br />
complex.<br />
The vvalues<br />
in parentheses p s are oscillaator<br />
streng gths and<br />
stand for pe ercentage exxcitation<br />
co ontribution ns to individdual<br />
transit tions.<br />
180 190<br />
5.31 ( (0.008)<br />
DMSO<br />
[Li(DMSO) 6 ] +<br />
[Li(DMSO) 5 ] +<br />
+<br />
[Li(DMSO) 4 ]<br />
[Li(DMSO) 3 ] +<br />
[Li(DMSO) 2 ] +<br />
+<br />
[Li(DMSO) 1 ]<br />
Fig. . 1 TD-B3LLYP/B1<br />
opt tical transittions<br />
(bar lines) l for fr ree DMSO and [Li(DM<br />
compleexes.<br />
The ex xperimentaal<br />
DMSO sp pectrum [9] (solid line) ) is normali ized.<br />
4. CONCLLUSION<br />
Our theeoretical<br />
DFT D studiees<br />
of [Li(D DMSO)n]<br />
elecctronic<br />
struucture<br />
and electron sspectroscop<br />
explain<br />
the opptimal<br />
coord dination nuumber<br />
of th<br />
quaantum-chemmical<br />
studie es, we havee<br />
found sta<br />
n = 5 and n = 66.<br />
The coor rdination nnumber<br />
inc<br />
weaakens<br />
the LLi-O<br />
bonds, , lowers thee<br />
DMSO st<br />
bluee<br />
shifts in eelectron<br />
spe ectra. Furthher<br />
experim<br />
soluutions<br />
of vaarious<br />
meta al salts are desirable t<br />
This<br />
may helpp<br />
us to und derstand thee<br />
DMSO-m<br />
trannsport<br />
throuugh<br />
the cel ll membrannes<br />
in biolog<br />
+ using geoometry,<br />
en nergetic,<br />
py argumen nts represeents<br />
an atte empt to<br />
he systems under studdy.<br />
Unlike previous p<br />
able structu ure for coorrdination<br />
numbers n<br />
rease cause es Li-O bonnd<br />
elongatio on. This<br />
tructure def formation aand<br />
corresp ponding<br />
mental and theoreticall<br />
studies on n DMSO<br />
to explain this t problemm<br />
in more details.<br />
metal-drug equilibrium e m during th he drug-<br />
gical system ms.<br />
5. ACKNOOWLEDGE<br />
EMENT<br />
This work<br />
has bee en supporteed<br />
by Slov vak Grant Agency A VEEGA<br />
(Proje ect Nos.<br />
1/01137/09,<br />
1/00127/09<br />
and d 1/1072/11)<br />
and by the Slovak k Research and Devel lopment<br />
Ageency<br />
(Projeect<br />
LPP-0230-09).<br />
TThis<br />
work k has benefited<br />
fromm<br />
the Ce entre of<br />
Exccellence<br />
Prrogramme<br />
of the Sloovak<br />
Acade emy of Scie ence in Brratislava,<br />
Slovakia<br />
S<br />
(COOMCHEM,<br />
Contract no. n II/1/20007).<br />
- 257 -<br />
HOMO H LLUMO+1<br />
HOMO H LLUMO+1<br />
5,71 1 eV<br />
(0.0133)<br />
HOMO →<br />
LUMO<br />
92 2 %<br />
6,50 0 eV<br />
(0.0078)<br />
HOMO<br />
→LUMO+1<br />
89 9 %<br />
Brno<br />
MSO)n] +
XI. Workshop of Physical Chemists and Electrochemists´11 Brno<br />
6. REFERENCES<br />
[1] Olver, I.N., Schwartz, M.A., Cancer Treat. Rep. 67 (1983) 407<br />
[2] Santhos, N.C., et al., Biochem. Pharmacol. 65 (2003) 1035<br />
[3] Alberts, D.S., Dorr, R.T., Oncol. Nurs. Forum 4 (1991) 693<br />
[4] Furche, F., Ahlrichs, R., J. Chem. Phys. 117 (2002) 7433<br />
[5] Bauernschmidt, R., Ahlrichs, R., Chem. Phys. Lett. 256 (1996) 454<br />
[6] Becke, A.D., J. Chem. Phys. 98 (1993) 5648<br />
[7] Cancès, M. T., et al., J. Chem. Phys. 107 (1997) 3032<br />
[8] Frisch, M.J., Pople, J.A., GAUSSIAN 03, Revision A.1, Gaussian, Inc., Pittsburgh, PA, 2003<br />
[9] K. Golnick, H.U. Stracke, Tetrahedron Lett. 12 (1973) 207<br />
- 258 -
XI. Workshop of Physical Chemists and Electrochemists´11 Brno<br />
ANALYSIS OF THIOL COMPOUNDS AND<br />
ANTIOXIDANT ACTIVITY IN PATIENTS<br />
SUFFERING FROM MALIGNANT DISEASE<br />
Jiří SOCHOR 1 , Ondřej ZÍTKA 1 , Petr BABULA 1 , Jaromír GUMULEC 2 , Michal<br />
Masařík 2 , Vojtěch Adam 1 , René Kizek 1*<br />
1 Department of Chemistry and Biochemistry, Faculty of Agronomy, Mendel University, Zemedelska 1,<br />
CZ-61300 Brno, Czech Republic<br />
2 Department of Pathological Physiology, Faculty of Medicine, Masaryk University, KAmenice 753/5,<br />
CZ-662 43 Brno, Czech Republic<br />
Abstract<br />
The aim of our work consisted in analysis of blood serum samples of patients suffering<br />
from the malignant disease – diagnosed prostate adenocarcinoma. Healthy persons<br />
served as a control group. We were focused on the monitoring of the rate of reduced<br />
(GSH) and oxidised (GSSG) glutathione and on the antioxidant capacity of blood<br />
serum.<br />
1. INTRODUCTION<br />
Glutathione is tripeptide composed of glutamic acid, cysteine and glycine.<br />
Glutathione is and essential compound produced practically in all eukaryotic cells.<br />
Glutathione can be in cells in two forms: free, or bound to protein. In this case,<br />
glutathione forms glutathionated proteins (Pastore, et al.). These proteins are in the<br />
focus of interest in different patophysiological processes, which is supported by some<br />
published studies (Cotgreave, et al.)(Klatt, et al.)(Fratelli, et al.). One of the most<br />
important glutathionated proteins is glutathionyl haemoglobin (S-glutathionated<br />
haemoglobin), especially due to its significance as a biochemical marker of oxidative<br />
stress in blood (Bursell, et al.)(Niwa, et al.). Free glutathione occurs in two forms – as<br />
reduced (GSH) or as oxidised (GSSG). GSH is in consequence of oxidative stress<br />
readily oxidised; however, due to activity of enzyme glutathione reductase is<br />
converted back to the reduced form. Under normal, “non-oxidative” conditions, the<br />
rate between GSH and GSSG is about 10:1. This rate may be significantly changed,<br />
especially as a result of oxidative stress, to the rates between 10:1 and 1:1 (Chai, et al.).<br />
Scavenging of hydrogen peroxide and free radicals in connection with ascorbic acid<br />
(glutathione-ascorbate cycle) are the most important mechanisms and functions of<br />
glutathione. Compounds that are able to generate reactive oxygen species (ROS) are<br />
for living organism very dangerous, ROS production is connected with many diseases,<br />
such as diabetes mellitus, atherosclerosis and cancer (Droge, et al.). Cytosolic,<br />
mitochondrial and microsomal enzymes glutathione S-transferase family (GST) are<br />
closely connected with GSH. Disruption in GST function is associated with cancer of<br />
urinary bladder, skin and possibly lungs (Hayes, et al.).<br />
- 259 -
XI. Workshop of Physical Chemists and Electrochemists´11 Brno<br />
Oxidative stress represents disruption of balance between formation and<br />
elimination of reactive oxygen species. Antioxidant activity is one of the most<br />
important markers of this balance (Sochor, et al.). Antioxidant activity is defined as<br />
the ability of compounds (or mixture of compounds) to eliminate oxidadative<br />
degradation of different compounds, for example lipids (inhibition of lipid<br />
peroxidation) (Singh, et al.). Methods of its determination are usually based on the<br />
direct reaction between studied compound and free radicals (their scavenging or<br />
quenching), or on the reaction with transient metals (Schlesier, et al.).<br />
2. EXPERIMENT<br />
Biological samples: 10 samples of blood serum of patients suffering from prostate<br />
adenocarcinoma were used in experiments. Staging of tumours ranged between 1c and<br />
4. Age of patients was from 48 to 78 years (average age 62.7 years). Control group was<br />
represented by 10 healthy persons of the age from 20 to 26 let, students of Masaryk<br />
University, Faculty of Sports Studies.<br />
Pretreatment of the biological samples for the GSH/GSG rate analysis: Samples<br />
of blood serum were diluted by the 10% TFA in the rate 1:1 (v/v) due to precipitation<br />
of proteins. Samples were subsequently vortexed (20 s) and centrifuged (Eppendorf<br />
centrifuge 5417R, 15 min., 16400 rpm, 4°C). Supernatant was used for analysis using<br />
HPLC with electrochemical detection.<br />
Analysis of thiol compounds: HPLC-ED consisted of two chromatographic<br />
pumps (Model 582 ESA, ESA Inc., Chelmsford, MA) (working range 0.001-9.999<br />
ml·min -1 ) and chromatographic column with reverse phase Zorbax eclipse AAA C18<br />
(150 × 4.6; 3,5 μm size of particles, Agilent Technologies, USA) and CoulArray<br />
electrochemical detector (Model 5600A, ESA, USA). Sample (20 μl) was automatically<br />
injected by autosampler (Model 542, ESA, USA), which contains thermostated space<br />
for column. Samples were during analysis stored in carousel at 8°C. Column was<br />
thermostated to 32 °C. Flow rate of mobile phase was 1 ml·min -1 . Mobile phase<br />
consisted of A: trifluoroacetic acid (80 mM) and B: 100% Met-OH. Time of one<br />
analysis was 20 minutes.<br />
Analysis of antioxidant activity: Automatic spectrophotometer BS-400 (Mindray,<br />
China) was used for measurement of antioxidant activity. This apparatus consists of<br />
cuvette space (thermostated to 37±0.1 °C), reagent space with carousel for reagents<br />
and for sample preparation (thermostated to 4±1 °C) and optic detector. Tungsten<br />
halogen lamp served as source of radiation. Transfer of samples was provided by<br />
robotic arm with dosage needle. Content of cuvettes is mixed by automatic stirrer<br />
immediately after addition of reagent of sample of volume of 2-45 μl. Contamination<br />
is minimised due to washing both dosage needle and stirrer by MilliQ water. For the<br />
detection, following wave lengths could be used: 340, 380, 412, 450, 505, 546, 570,<br />
605, 660, 700, 740, 800 nm.<br />
Volume of reagent (DPPH, ABTS, FRAP, DMPD) was incubated for 15 minutes<br />
with directly defined volume of blood serum; after it, absorbance of this mixture was<br />
- 260 -
XI. WWorkshop<br />
of Phyysical<br />
Chemists and Electrocheemists´11<br />
meaasured.<br />
Vallues<br />
of absorbance<br />
off<br />
reagent it tself and ab bsorbance oof<br />
sample after 15<br />
minnutes<br />
of inncubation<br />
were w used for determ mination of f antioxidannt<br />
activity – both<br />
valuues<br />
were subtracted.<br />
Resulting absorbance e was reca alculated inn<br />
accordance<br />
with<br />
calibration<br />
curve<br />
to the equivalentt<br />
of gallic acid. Proce edures of mmeasureme<br />
ents and<br />
prepparation<br />
of f reagents ar re describedd<br />
in the wo ork of Sochor<br />
et al. (Soochor,<br />
et al.).<br />
3. RESULTTS<br />
AND D<br />
All set of patients<br />
prosstate-speciffic<br />
antigen<br />
andd<br />
36,5 ng·mml<br />
histtologically<br />
appproaches<br />
we<br />
andd<br />
oxidised (<br />
GSHH<br />
and GSS<br />
Valuues<br />
of the G<br />
(2,77<br />
at average<br />
valuues<br />
were be<br />
welll<br />
evident th<br />
the heavy hea<br />
antiitumour<br />
ag<br />
speccies.<br />
ROS a<br />
-1 DISCUSSI<br />
s suffering<br />
(PSA). Bef<br />
(9,7 ng·ml<br />
as acinar<br />
ere used for<br />
(GSSG) glu<br />
SG concent<br />
GSH:GSSG<br />
e) and relati<br />
etween 10,<br />
hat all patie<br />
alth troubl<br />
gents, whic<br />
are subseque<br />
-1 ION<br />
from mal lignant dis sease has iincreased<br />
level l of<br />
fore biopsy y, PSA leve el ranged beetween<br />
2,3 3 ng·ml<br />
at avverage).<br />
Ty ype of mal lignant dissease<br />
was<br />
r adenocarrcinoma<br />
of f the prostate.<br />
Diffferent<br />
met<br />
r the determmination<br />
of f oxidative stress. Ratee<br />
of reduced<br />
utathione wwas<br />
monitored.<br />
Rate was w determmined<br />
as a<br />
trations. TThese<br />
value es were determined<br />
bby<br />
the HP<br />
rate for pat atients (n=10)<br />
ranged between b 0,115<br />
and 7,6 (<br />
ive standarrd<br />
deviation n RSD 86% . For the coontrol<br />
grou<br />
5 and 21,22<br />
(Fig. 1b) ( 13,69 at average); a RSSD<br />
was 24<br />
ents are expposed<br />
to ox xidative stre ess. These vvalues<br />
can<br />
les. Howevver,<br />
they can<br />
be conn nected witth<br />
the func<br />
ch effect iss<br />
connecte ed with generation<br />
oof<br />
reactive<br />
ently able tto<br />
damage tumour t tiss sue..<br />
-1<br />
verified<br />
thodical<br />
d (GSH)<br />
ratio of<br />
PLC-ED.<br />
(Fig. 1a)<br />
up, these<br />
%. It is<br />
show to<br />
ction of<br />
oxygen<br />
Fig 1.: Values oof<br />
GSH/GSS SG in patieents<br />
(a) and in control group (b).<br />
Antioxiddant<br />
activity y was deterrmined<br />
usin ng four diff ferent methhods.<br />
DPPH H<br />
baseed<br />
on the aability<br />
of st table free rradicals<br />
of 2,2-dipheny<br />
2 yl-1-pikryllhydrazyle<br />
withh<br />
hydrogenn<br />
donors. ABTS A methhod<br />
is based d on the ne eutralisatioon<br />
of ABTS<br />
(2,22‘-azinobis(<br />
3-ethylben nzothiazolinne-6-supho<br />
onate). FRA AP methodd<br />
(Ferric R<br />
Anttioxidant<br />
Power)<br />
is ba ased on thee<br />
reduction of the ferr ric complexxes<br />
of TPTZ<br />
trippyridyl-S-trriazine)<br />
with ferrric<br />
chlo oride. DMPD D (NN,N-dimeth<br />
diamminobenzenne)<br />
is unde er activity of ferrous s salt transf formed intto<br />
relatively<br />
andd<br />
colour raadical<br />
form m. All resullts<br />
were re elated to th he equivaleents<br />
of gal<br />
(GAAE),<br />
whichh<br />
represen nts standarrd<br />
for antioxidant<br />
tests.<br />
This standard<br />
commparison<br />
noot<br />
only of obtained vvalues<br />
of pa atients and healthy peersons,<br />
but<br />
indiividual<br />
meethods,<br />
espe ecially witth<br />
respect of spectrum m of groupp<br />
of free r<br />
• test is<br />
to react<br />
• radical<br />
Reducing<br />
Z (2,4,6hyl-1,4y<br />
stable<br />
llic acid<br />
enables<br />
t also of<br />
radicals.<br />
- 261 -<br />
Brno
XI. Workshop of Physical Chemists and Electrochemists´11 Brno<br />
(Apak, et al.). Due to above-mentioned facts, it is suitable to use different methods for<br />
the determination of antioxidant activity. Obtained results are more comprehensive<br />
and more representable.<br />
Table 1.: Values of antioxidant activity of blood serum of patients suffering from<br />
acinar adenocarcinoma of prostate.<br />
Used method Range of values of<br />
mgGAE·ml -1<br />
- 262 -<br />
Average value of<br />
mgGAE·ml -1<br />
RSD [%]<br />
DPPH 0.01-0.15 0.06 19%<br />
ABTS 0.05-0.35 0.19 15%<br />
FRAP 0.09-0.53 0.22 18%<br />
DMPD 0.06-0.36 0.21 13%<br />
Number of patients n=10<br />
Number of repetitions of measurement n=3<br />
RSD – relative standard deviation related to the minimal and maximal values<br />
Table 2.: Values of antioxidant activity of blood serum of healthy persons – control.<br />
Used method Range of values of<br />
mgGAE·ml -1<br />
Average value of<br />
mgGAE·ml -1<br />
RSD [%]<br />
DPPH 0.09-0.45 0.30 27%<br />
ABTS 0.14-0.56 0.32 22%<br />
FRAP 0.38-0.86 0.51 24%<br />
DMPD 0.21-0.67 0.37 19%<br />
Number of healthy persons n=10<br />
Number of repetitions of measurement n=3<br />
RSD – relative standard deviation related to the minimal and maximal values<br />
Our study demonstrated significant differences in antioxidant activity of blood<br />
serum in group of patients suffering from acinar adenocarcinoma of prostate and<br />
healthy persons. This fact is connected with oxidative stress, which was verified by<br />
the GSH/GSSG rates. Our results agree with the results of exact studies focused on<br />
adenocarcinoma of prostate, which advert to the significant changes in protective<br />
antioxidant mechanisms in patients (Yilmaz, et al.). In these studies, values of lipid<br />
peroxidation index (Aydin, et al.), superoxid dismutase and catalase activities (Baker,<br />
et al.), which represent one of the most important protective mechanisms, were<br />
changed. These changes are responsible for reduction of antioxidant activity (Pace, et<br />
al.).<br />
4. CONCLUSION<br />
Evaluation of antioxidant state can serve as an important marker in the area of<br />
malignant diseases treatment. Results of our study verified significance of GSH/GSSG<br />
rate as a marker of oxidative stress in patients suffering from acinar adenocarcinoma<br />
of prostate.
XI. Workshop of Physical Chemists and Electrochemists´11 Brno<br />
5. ACKNOWLEDGEMENT<br />
Grants GAČR 301/09/P436 and CYTORES GA ČR P301/10/0356, Liga proti<br />
rakovině Praha 2011 are highly acknowledged.<br />
6. REFERENCES<br />
1. Pastore, A., et al., (2001): Determination of blood total, reduced, and oxidized glutathione in<br />
pediatric subjects, Clinical Chemistry, 47: 1467-1469.<br />
2. Cotgreave, I. A., et al., (1998): Recent trends in glutathione biochemistry - Glutathione-protein<br />
interactions: A molecular link between oxidative stress and cell proliferation?, Biochemical and<br />
Biophysical Research Communications, 242: 1-9.<br />
3. Klatt, P., et al., (2000): Regulation of protein function by S-glutathiolation in response to oxidative<br />
and nitrosative stress, European Journal of Biochemistry, 267: 4928-4944.<br />
4. Fratelli, M., et al., (2002): Identification by redox proteomics of glutathionylated proteins in<br />
oxidatively stressed human T lymphocytes, Proceedings of the National Academy of Sciences of<br />
the United States of America, 99: 3505-3510.<br />
5. Bursell, S. E., et al., (2000): The potential use of glutathionyl hemoglobin as a clinical marker of<br />
oxidative stress, Clinical Chemistry, 46: 145-146.<br />
6. Niwa, T., et al., (2000): Increased glutathionyl hemoglobin in diabetes mellitus and hyperlipidemia<br />
demonstrated by liquid chromatography/electrospray ionization-mass spectrometry, Clinical<br />
Chemistry, 46: 82-88.<br />
7. Chai, Y. C., et al., (1994): S-THIOLATION OF INDIVIDUAL HUMAN NEUTROPHIL PROTEINS<br />
INCLUDING ACTIN BY STIMULATION OF THE RESPIRATORY BURST - EVIDENCE<br />
AGAINST A ROLE FOR GLUTATHIONE DISULFIDE, Archives of Biochemistry and<br />
Biophysics, 310: 273-281.<br />
8. Droge, W., et al., (1986): Glutathione augments the activation of cytotoxic lymphocytes-t invivo,<br />
Immunobiology, 172: 151-156.<br />
9. Hayes, J. D., et al., (1999): Glutathione and glutathione-dependent enzymes represent a Coordinately<br />
regulated defence against oxidative stress, Free Radical Research, 31: 273-300.<br />
10. Sochor, J., et al., (2010): An assay for spectrometric determination of antioxidant activity of a<br />
biological extract, Listy Cukrovarnicke a Reparske, 126: 416-417.<br />
11. Singh, S., et al., (2008): In vitro methods of assay of antioxidants: An overview, Food Reviews<br />
International, 24: 392-415.<br />
12. Schlesier, K., et al., (2002): Assessment of antioxidant activity by using different in vitro methods,<br />
Free Radical Research, 36: 177-187.<br />
13. Sochor, J., et al., (2010): Fully Automated Spectrometric Protocols for Determination of Antioxidant<br />
Activity: Advantages and Disadvantages, Molecules, 15: 8618-8641.<br />
14. Yilmaz, M. I., et al., (2004): Antioxidant system activation in prostate cancer, Biological Trace<br />
Element Research, 98: 13-19.<br />
15. Aydin, A., et al., (2006): Oxidative stress and antioxidant status in non-metastatic prostate cancer<br />
and benign prostatic hyperplasia, Clinical Biochemistry, 39: 176-179.<br />
16. Baker, A. M., et al., (1997): Expression of antioxidant enzymes in human prostatic adenocarcinoma,<br />
Prostate, 32: 229-233.<br />
17. Pace, G., et al., (2010): Oxidative Stress in Benign Prostatic Hyperplasia and Prostate Cancer,<br />
Urologia Internationalis, 85: 328-333.<br />
18. Apak, R., et al., (2007): Comparative evaluation of various total antioxidant capacity assays applied<br />
to phenolic compounds with the CUPRAC assay, Molecules, 12: 1496-1547.<br />
- 263 -
XI. Workshop of Physical Chemists and Electrochemists´11 Brno<br />
ANTIOXIDANT ACTIVITY OF TUMOUR<br />
CELL AND EFFECT OF CYTOSTATICS ON<br />
ANTIOXIDANT STATUS<br />
Jiří SOCHOR 1 , Tomáš ECKSCHLAGER 2 , Petr BABULA 1 , Vojtěch ADAM 1 , Marie<br />
STIBOROVÁ 3 , René KIZEK 1<br />
1 Department of Chemistry and Biochemistry, Faculty of Agronomy, Mendel University, Zemedelska 1,<br />
CZ-61300 Brno, Czech Republic<br />
2 Department of Paediatric Hematology and Oncology, 2nd Faculty of Medicine, Charles University in<br />
Prag, V Úvalu 84, CZ-150 06 Praha 5, Czech Republic<br />
3 Department of Biochemistry, Faculty of Science, Charles university in Prag, Albertov 2030, CZ-128 40<br />
Praha 2, Czech Republic<br />
Abstract<br />
Our work was focused to the implementation of methods for determination of<br />
antioxidant activity in tumour cells and in tumour cells treated by cytostatics. Level of<br />
oxidative stress was monitored as a change of antioxidant activity, or, alternatively as<br />
antioxidant state. Optimization of four different photometric methods represents the<br />
most important result of our work.<br />
1. INTRODUCTION<br />
Toxicity of cytostatics represents one of the most important problems in cancer<br />
treatment. Oxidative stress as a result of activity of cytostatics is still inadequately<br />
examined (Il'yasova, et al., Kansal, et al.). It is well known that oxidative stress in<br />
connected with misbalance between levels of pro-oxidants and protective antioxidant<br />
mechanisms (Singh, et al.). It seems that changes in these mechanisms are very<br />
important in the treatment of patients suffering from a malignant disease (Reuter, et<br />
al.). Direct measurement of reactive oxygen species (ROS) or markers of oxidative<br />
stress is in clinical medicine still very difficult (Franco, et al.). In addition, organisms<br />
is affected by simultaneous action of many factors (age of patients, nutrition, stress,<br />
next diseases, factors of the living environment), so, it is practically impossible to<br />
determine change of oxidation action due to malignant disease itself and cytostaticsbased<br />
therapy or radiotherapy (Il'yasova, et al., Omerovic, et al.). Therefore, it is<br />
necessary to understand processes on the cellular level in in vitro conditions without<br />
action of other factors.<br />
2. EXPERIMENT<br />
Antioxidant activity analysis: automatic spectrophotometer BS-400 (Mindray,<br />
China) was used for measurement of antioxidant activity. This apparatus consists of<br />
cuvette space (thermostated to 37±0.1 °C), reagent space with carousel for reagents<br />
and for sample preparation (thermostated to 4±1 °C) and optic detector. Tungsten<br />
halogen lamp served as source of radiation. Transfer of samples was provided by<br />
- 264 -
XI. WWorkshop<br />
of Phyysical<br />
Chemists and Electrocheemists´11<br />
robootic<br />
arm wwith<br />
dosage e needle. CContent<br />
of cuvettes is s mixed byy<br />
automatic c stirrer<br />
immmediately<br />
aafter<br />
additio on of reageent<br />
of samp ple of volum me of 2-45 μl. Contam mination<br />
is mminimised<br />
ddue<br />
to wash hing both ddosage<br />
need dle and stir rrer by MillliQ<br />
water. For the<br />
deteection,<br />
folllowing<br />
wav ve lengths could be used: u 340, 380, 3 412, 4450,<br />
505, 54 46, 570,<br />
605,<br />
660, 700, 740, and 80 00 nm.<br />
Volume of reagent (DPPH, ABBTS,<br />
FRAP P, DMPD) was w incubatted<br />
for 15 minutes m<br />
withh<br />
directly ddefined<br />
vol lume of bloood<br />
serum; after it, ab bsorbance oof<br />
this mixt ture was<br />
meaasured.<br />
Vallues<br />
of absorbance<br />
off<br />
reagent it tself and ab bsorbance oof<br />
sample after 15<br />
minnutes<br />
of inncubation<br />
were w used for determ mination of f antioxidannt<br />
activity – both<br />
valuues<br />
were subtracted.<br />
Resulting absorbance e was reca alculated inn<br />
accordance<br />
with<br />
calibration<br />
curve<br />
to the equivalentt<br />
of gallic acid. Proce edures of mmeasureme<br />
ents and<br />
prepparation<br />
of f reagents ar re describedd<br />
in the wo ork of Sochor<br />
et al. (Soochor,<br />
et al.).<br />
Biologicaal<br />
samples: s: cell line UKF-NB-4<br />
with am mplificationn<br />
of MYCN<br />
gene<br />
(sennsitive<br />
cell line) and derived d cell l line resista ant to the cisplatin, c wwhich<br />
was prepared p<br />
undder<br />
cisplatinn<br />
treatment t, were useed<br />
in experi iment. Cells<br />
were treaated<br />
by cisp platin in<br />
conncentrationss<br />
0.1 μM, 1 μM, and 100<br />
μM, control<br />
untreated<br />
cells weere<br />
also incl luded in<br />
experiment.<br />
Tiime<br />
of treat tment was 6 and 48 ho ours.<br />
Tabble<br />
1. Parammeters<br />
of ex xperimentall<br />
samples of f cells<br />
a)<br />
Sample<br />
designatio on<br />
1<br />
2<br />
3<br />
4<br />
5<br />
6<br />
7<br />
8<br />
Timee<br />
of Sensitivity<br />
treatmment<br />
to<br />
(h) ) cisp platin<br />
6/244<br />
sen nsitive<br />
6/244<br />
sen nsitive<br />
6/244<br />
sen nsitive<br />
6/244<br />
sen nsitive<br />
6/244<br />
resistant<br />
6/244<br />
resistant<br />
6/244<br />
resistant<br />
6/244<br />
resistant<br />
Figuure<br />
1. Cell lline<br />
UKF-N NB-4 withoout<br />
treatmen nt (a) and after a treatmment<br />
by cisp platin in<br />
concentration<br />
of 10μM 1 (b)<br />
- 265 -<br />
Concentrati<br />
C on<br />
of cisplatin (µ µM)<br />
0<br />
0.1<br />
1<br />
10<br />
0<br />
0.1<br />
1<br />
10<br />
Brno
XI. Workshop of Physical Chemists and Electrochemists´11 Brno<br />
3. RESULTS AND DISCUSSION<br />
Oxidative stress is caused by misbalance between formation and elimination of<br />
free radicals, especially reactive oxygen species. It is induced by formation of free<br />
radicals, or by depression of protective antioxidant mechanisms (Bulkley, Clutton).<br />
Antioxidant activity is one of the most important markers of oxidative stress<br />
(Antolovich, et al.).<br />
In the area of determination of antioxidant characteristics, many different<br />
methods have been proposed and verified (Schlesier, et al., Sochor, et al.). They are<br />
different in the view of principle of reaction. In addition, new and new modifications<br />
of these methods are still proposed and developed. Their importance consists in the<br />
characterization of antioxidant activity in conditions similar to physiological<br />
conditions. Methods used for antioxidant activity determination are based mostly on<br />
the direct reaction between studied compound or mixture of compounds with radicals<br />
(quenching or scavenging) or on reactions with transient metals.<br />
Four different methods for determination of antioxidant activity were used in<br />
our study – namely DPPH, ABTS, FRAP, and DMPD). These methods were optimised<br />
for the measurement by the automated analyser BS-400 Mindray. Calibration curves<br />
were designed for calculation of antioxidant activity to the equivalent of gallic acid.<br />
Table 2. Summary of parameters for individual methods and recalculation to the gallic<br />
acid equivalent.<br />
Method Wave<br />
length<br />
nm<br />
Range of<br />
measurement<br />
µg·ml -1<br />
Calibration<br />
equation<br />
- 266 -<br />
Confidence<br />
coefficient R<br />
Relative<br />
standard<br />
deviation<br />
%<br />
DPPH 505 1 – 10 y = -0.103ln(x) -<br />
0.093<br />
0,996 1,8<br />
ABTS 660 1 – 20 y = -0.011x -<br />
0.019<br />
0,996 2,1<br />
FRAP 570/605 1 – 300 y = 0.076x + 0.057 0,999 1,5<br />
DMPD 505 1 – 25 y = -0.060x +<br />
0.180<br />
0,999 2,3<br />
In the next step, cells of above-mentioned cell lines were analysed (Tab. 1).<br />
Values of antioxidant activity were different in accordance with cisplatin<br />
concentration and duration of treatment. Different values were also recorded by the<br />
use of different methods. This may be explained by the specificity of individual<br />
methods for individual types of free radicals. Using these methods, obtained data were<br />
more complex and comprehensive in comparison with use of only one method. Cells<br />
treated by cisplatin demonstrated lower values of antioxidant activity compared to<br />
control untreated cells.
XI. Workshop of Physical Chemists and Electrochemists´11 Brno<br />
4. CONCLUSION<br />
Looking for new markers of oxidative stress in they case of patients suffering<br />
from malignant disease is one of the main objects of research. There is only limited<br />
number of clinical tests, which are effective. However, they are usually invasive and<br />
limited to only some types of tumours. Determination of antioxidant activity<br />
represents important step in clinical medicine. Our aim consists in utilization of<br />
potential of these methods in malignant diseases and verification of importance of<br />
oxidative stress during treatment.<br />
5. ACKNOWLEDGEMENT<br />
Work was supported by grants GAČR 301/09/P436 and CYTORES GA ČR<br />
P301/10/0356.<br />
6. REFERENCES<br />
1. Il'yasova, D., et al., (2011): Individual responses to chemotherapy-induced oxidative stress, Breast<br />
Cancer Research and Treatment, 125: 583-589.<br />
2. Kansal, S., et al., (2011): Evaluation of the role of oxidative stress in chemopreventive action of fish<br />
oil and celecoxib in the initiation phase of 7,12-dimethyl benz(alpha)anthracene-induced<br />
mammary carcinogenesis, Tumor Biology, 32: 167-177.<br />
3. Singh, S., et al., (2008): In vitro methods of assay of antioxidants: An overview, Food Reviews<br />
International, 24: 392-415.<br />
4. Reuter, S., et al., (2010): Oxidative stress, inflammation, and cancer How are they linked?, Free<br />
Radical Biology and Medicine, 49: 1603-1616.<br />
5. Franco, R., et al., (2008): Oxidative stress, DNA methylation and carcinogenesis, Cancer Letters, 266:<br />
6-11.<br />
6. Il'yasova, D., et al., (2009): Markers of oxidative status in a clinical model of oxidative assault: a pilot<br />
study in human blood following doxorubicin administration, Biomarkers, 14: 321-325.<br />
7. Omerovic, E., et al., (2008): Aqueous fish extract increases survival in the mouse model of cytostatic<br />
toxicity, Journal of Experimental & Clinical Cancer Research, 27: 10.<br />
8. Sochor, J., et al., (2010): Fully Automated Spectrometric Protocols for Determination of Antioxidant<br />
Activity: Advantages and Disadvantages, Molecules, 15: 8618-8641.<br />
9. Bulkley, G. B., (1983): The role of oxygen free-radicals in human-disease processes, Surgery, 94: 407-<br />
411.<br />
10. Clutton, S., (1997): The importance of oxidative stress in apoptosis, British Medical Bulletin, 53:<br />
662-668.<br />
11. Antolovich, M., et al., (2002): Methods for testing antioxidant activity, Analyst, 127: 183-198.<br />
12. Schlesier, K., et al., (2002): Assessment of antioxidant activity by using different in vitro methods,<br />
Free Radical Research, 36: 177-187.<br />
13. Sochor, J., et al., (2010): An assay for spectrometric determination of antioxidant activity of a<br />
biological extract, Listy Cukrovarnicke a Reparske, 126: 416-417.<br />
- 267 -
XI. Workshop of Physical Chemists and Electrochemists´11 Brno<br />
ELECTROCHEMICAL ANODIZATION AS<br />
TOOL FOR NANOSTRUCTURES<br />
FORMATION<br />
Dmitry SOLOVEI 1 , Jaromíir HUBÁLEK 1<br />
1 Department of Microelectronics, Faculty of Electrical Engineering and Communication, Brno<br />
University of Technology, Technicka 3058/10, CZ-616 00, Brno, Czech Republic<br />
Abstract<br />
In this paper we describe the methods of electrochemical anodization of valve metals<br />
such as aluminum, titanium, niobium, for formation of nanoscale and nanostructured<br />
functional layers in the form of nanoporous matrix templates, nanopillars and<br />
nanodots with the basic geometric parameters of 10 to 100 nm, for future use in<br />
sensor, as well as micro-and nanoelectronics.<br />
1. INTRODUCTION<br />
The electrochemical anodization of valve metals has been known for more than<br />
80 years; oxalic acid anodizing was first patented in Japan in 1923 and later widely<br />
used in Germany [1]. But only through the invention of the electron microscope,<br />
scientists were able to understand that by using these methods can obtain nanoscale<br />
objects, such as nanoporous alumina matrix templates [2], metaloxide nanopillars [3]<br />
and metaloxide nanodots [4]. The main advantage of electrochemical anodization is a<br />
simple, reproducible and easily controllable formation of self-assembled nanosystems,<br />
which is very convenient for practical applications. In this paper, the methods of the<br />
electrochemical anodization of valve metals (Al, Ti, Nb) for creation of self-assembled<br />
nanostructured layers was describe.<br />
2. EXPERIMENT<br />
For electrochemical anodizing process are used metal foils and thin layers of<br />
valve metals sputtered in vacuum on dielectric or semiconducting substrate.<br />
Electrochemical anodization is carried out in aqueous solutions of organic and<br />
inorganic acids such as sulfuric, oxalic, phosphoric and citric with concentrations<br />
from 0.1 to 2 M. Anodization process was conducted in two modes: galvanic static<br />
mode with current densities from 2 to 10 mA/cm 2 and at the potential static mode<br />
with potential in electrochemical system from several to tens of volts. All process was<br />
held at temperature 20 °C with constant steering of electrolytes. For formation of<br />
nanoporous alumina templates was used known well two stage anodizing method:<br />
first porous anodizing on necessary thickness, removing of porous alumina matrixes<br />
and second porous anodizing for creation of nanoporous template with control high<br />
and porous diameter. Porous aluminum oxide was removed in a selective etchant<br />
based on chromium trioxide and phosphoric acid at 65 °C for 15 minutes. For<br />
formation of metaloxide nanopillars from different valve metals was used process of<br />
- 268 -
XI. Workshop of Physical Chemists and Electrochemists´11 Brno<br />
locally metal oxidization of underlying metal layers (Ti, Nb) through the porous<br />
alumina mask with additional reanodizing step when the potential smoothly<br />
increasing to value of 1,5 – 3 times higher than potential of porous alumina formation.<br />
For formation of metaloxide nanodots it was also used porous alumina oxide templates<br />
like for formation of metaloxide nanopillars but with low voltages below 10 volts. The<br />
process of underlying metal anodization lasted for 30 minutes and after reaching of<br />
constant minimum value of anode current was switched off. For revealing of<br />
metaloxide nanopillars and nanodots the last stage was completely removing of<br />
alumina templates by using chemical etching process. All electrochemical process was<br />
carried out by GPIB interfaces power supply and multimeters, scanning electron<br />
microscopy (SEM) techniques was used for investigation of uniformity and<br />
geometrical parameters of nanostructures layers.<br />
3. 3.RESULTS AND DISCUSSION<br />
On Fig. 1a is shown typical kinetic curve of anodizing 2 mkm aluminium layers<br />
in 0.9 M oxalic electrolyte at galvanic static mode with current of 5 mA/cm 2 . As see<br />
from Fig 1a the potential of porous alumina formation is 32.5 volts. By this potential<br />
we fabricated porous alumina matrix with pore diameter of about 20 nm located with<br />
step 80 – 85 nm (see Fig 1b). After selective removal of the porous matrix anodization<br />
process was repeated under initial conditions to obtain ordered porous alumina matrix<br />
with necessary thickness 500 – 700 nm (see Fig. 1c). So using this method on thin<br />
aluminum films we can fabricate low profile porous alumina matrix template with a<br />
pore diameter of 5 to 400 nm and a height of oxide from 300 to 2000 nm which can<br />
use for filing or coating by different materials.<br />
For formation of metaloxide nanopillars and nanodots firstly was made porous<br />
alumina matrixes with necessary pore diametres: for formation of niobium oxide<br />
nanopillars pore diametres was 30 nm and for formation of titanium oxide nanodots<br />
pore diametres was about 5 nm. During porous alumina formation when anodization<br />
front was reached of niobium or titanium underlayer anodization potential begins to<br />
increase with speed 1 V/s and its growth continued up to a certain limited value at 130<br />
volts for niobium layer and 11 volts for titanium layer. Then the anodizing mode was<br />
switched to the constant potential at which lasted electrochemical anodization of<br />
niobium and titanium underlayer. In this case, the current in the electrochemical<br />
system began to decline exponentially (see Fig. 2a), driven by the rising pillars of<br />
niobium and titanium oxide at the bottom of each pore of the matrix of anodic<br />
aluminum oxide (see Fig. 2b, c). During local oxidation of valve metals through the<br />
porous alumina matrixes there is a growth of oxides of these metals in the space of<br />
pores and by changing of the anodizing potential can be formed metaloxide<br />
nanopillars and nanodots of a necessary height and radius. Obtained using the method<br />
described above niobium oxide nanopillars has diameters of about 40 nm and height<br />
of about 250 nm and the titanium oxide nanodots has a diameter about 15 nm and a<br />
height of about 20 nm.<br />
- 269 -
XI. Workshhop<br />
of Physical l Chemists and Electrochemists<br />
E<br />
s´11<br />
Potential, V<br />
Fig.1 FFabrication<br />
of low pr rofile poroous<br />
alumin na matrixes s: a – anoddizing<br />
kin netic;<br />
b – SEM immage<br />
of the surface; c – SEM imag ge of the cr ross sectionn<br />
Current, A<br />
aa)<br />
0.000 07<br />
0.000 06<br />
0.000 05<br />
0.000 04<br />
0.000 03<br />
0.000 02<br />
0.000 01<br />
0.000 00<br />
0 250 5000<br />
750 1000 1250<br />
1500 1750<br />
a)<br />
35<br />
30<br />
25<br />
20<br />
15<br />
10<br />
5<br />
0<br />
0 100 200 3300<br />
400 500 600<br />
Time, s<br />
700 800 900<br />
Time, s<br />
b) )<br />
Fig.2 Faabrication<br />
of nanopill lars and naanodots:<br />
a – anodizing g kinetic; b – SEM im mages<br />
of niobiumm<br />
oxide nanopillars;<br />
c – SEM imag ge of titaniu um oxide nnanodots<br />
4. CCONCLUSION<br />
Soo<br />
by usinng<br />
of described<br />
anoddizing<br />
tech hniques we w can forrm<br />
metalo oxide<br />
nanostrructured<br />
and<br />
nanosiz zed functiional<br />
layer rs of valve e metals wwith<br />
the main m<br />
geomettric<br />
dimenssions<br />
of 10 – 100 nm aat<br />
room tem mperatures and receivved<br />
layers have h<br />
good tiime<br />
stable of their fu unctional pproperties.<br />
This techn nique of thee<br />
formation<br />
of<br />
nanoscaale<br />
metaloxxide<br />
arrays s can be eeasily<br />
adap pted for a standard mmicroelectronic<br />
producttion<br />
process,<br />
which is one of the key technologic t cal advantaages.<br />
Obtained<br />
nanostrructured<br />
laayers<br />
of oxide<br />
valvee<br />
metals may m find im mmediate application n in<br />
- 270 -<br />
c) )<br />
c)<br />
b)<br />
Brno
XI. Workshop of Physical Chemists and Electrochemists´11 Brno<br />
nanoelectronics and nanosensory for the development of new generation electronic<br />
devices.<br />
5. ACKNOWLEDGEMENT<br />
The work has been supported by the grants GAAV KAN208130801 and GACR<br />
102/08/1546 is highly acknowledged.<br />
6. REFERENCES<br />
[1] Sheasby, P. G., Pinner, R.: The Surface Treatment and Finishing of Aluminum<br />
and its Alloys, 2 (sixth ed.), ASM International & Finishing Publications, 2001,<br />
Materials Park, Ohio & Stevenage, UK, 427<br />
[2] Lei, Y., Cai, W., Wilde, G.: Progress in Materials Science, 52 (2007), 7, 465<br />
[3] Mozalev, A., Sakairi, M., Saeki, I., Takahashi, H.: Electrochimica Acta, 48 (2003), 20-22, 3155<br />
[4] Chen, Z., Lei, Y., Chew, H. G., Teo, L. W., Choi, W. K., Chim, W.K.: Journal of Crystal Growth,<br />
268 (2004), 3-4, 560<br />
- 271 -
XI. Workshop of Physical Chemists and Electrochemists´11 Brno<br />
THE IMPACT OF SELECTED PLATUM<br />
GROUP ELEMENTS ON ANTIOXIDANT<br />
ACTIVITY OF DUCKWEED (LEMNA<br />
MINO L.)<br />
Lenka STRAKOVÁ 1, 2 , Ivana SOUKUPOVÁ 1 , Jiří SOCHOR 2 , Vojtěch ADAM 2<br />
Miroslava BEKLOVÁ 1 , René KIZEK 2<br />
1 University of Veterinary and Pharmaceutical Sciences, Palackeho 1-3, 612 42 Brno, Czech Republic<br />
2 Faculty of Agronomy, Mendel University in Brno, Zemedelska 1, 613 00 Brno, Czech Republic<br />
Abstract<br />
An actual problem in the environmental burden begins to be platinum group<br />
elements (PGEs), which come from automobile traffic. Increasing use of PGEs in<br />
exhaust catalysts and the runoff from surroundings of busy highways, lead to<br />
increased spread and accumulation of these metals in water ecosystem. To determine<br />
how these metals may affect the antioxidant activity of aquatic plants we chose<br />
duckweed (Lemna minor L.) as a bioindicator. In this experiment we used<br />
spectrophotometric methods for determination of the antioxidant activity. Plants<br />
were exposed by the solutions of SIS and selected metals from PGEs: platinum (PtCl4)<br />
and rhodium (RhCl3). Lemna minor was cultivated in various concentrations<br />
of platinum and rhodium (1, 10 and 100 μmol.l -1 ), respectively. The experiment lasted<br />
for seven days and sampling days were 2nd, 4th and 6th day. We chose two methods<br />
for this determination - FRAP and ABTS radical method. The influence of selected<br />
PGEs on Lemna minor was observed as a change of plant antioxidant activity. In the<br />
case of PtCl4 is an evident dependence between duration of the experiment and<br />
increasing concentrations of metals, but we do not observe such a big trend of<br />
increase of the antioxidant activity in the test with rhodium (RhCl3).<br />
1. INTRODUCTION<br />
Accumulation of platinum group elements (PGEs) in the environment has been<br />
increased over the time. Catalytic converters of modern vehicles are considered to be<br />
the main sources of PGEs pollution. The present literature survey shows that the<br />
concentration of these metals has increased significantly<br />
in the last decades [1]. Growing concentrations of PGEs in the culture medium<br />
correlates with the increasing concentrations in plants. Increased levels of PGEs may<br />
affect many cellular reactions. They affect the permeability of cell membranes,<br />
disrupting mitochondrial metabolism and interfere with protein synthesis.<br />
Duckweed (Lemna minor L.) is used in water quality studies to monitor heavy<br />
metals and other aquatic pollutants, because duckweed, like other water plants, may<br />
selectively accumulate certain chemicals. The plants possess physiological properties<br />
- 272 -
XI. Workshop of Physical Chemists and Electrochemists´11 Brno<br />
(small size, rapid growth in solutions of pH between 5 and 9, and vegetative<br />
propagation), which make them an ideal test system [2].<br />
Protection against ROS is an intrinsic characteristic of any living cell. The<br />
photosynthetic electron transport system is the major source of ROS in plant tissues.<br />
ROS have the potential to generate singlet oxygen 1 O2 and superoxide O2 •− , which in<br />
turn, can be successively reduced to hydrogen peroxide (H2O2) and hydroxyl radical<br />
(•OH). ROS formation in plants stimulates defence mechanisms in which antioxidant<br />
systems are induced to detoxify different ROSs, and assist in acclimating plants to<br />
oxidative stress [4].<br />
2. EXPERIMENT<br />
The experiment was performed using the CSN EN ISO 20079 - Water quality –<br />
Determination of the toxic effect of water constituents and waste water on duckweed<br />
(Lemna minor L.) – Duckweed growth inhibition test. We worked with two metal<br />
solutions of PGEs: PtCl4, RhCl3 with the concentrations of 1, 10 and 100 μmol·l -1 . For<br />
the growth of duckweed we used a micromethod (polystyrene macroplates of 10 ml<br />
sample volume). We took samples 2nd, 4th and 6th day to determine the dynamics of<br />
the effects of these metals.<br />
To determine the antioxidant activity, we used a biochemical analyzer Mindray<br />
BS 400 and choose two methods - a method of FRAP (Ferric Reducing Antioxidant<br />
Power) and ABTS radical method. The ABTS radical method is one of the most used<br />
assays for the determination of the concentration of free radicals. It is based on the<br />
neutralization of a radical-cation arising from the one-electron oxidation of the<br />
synthetic chromophore. The FRAP method (Ferric Reducing Antioxidant Power) is<br />
based on the reduction of complexes of 2,4,6-tripyridyl-s-triazine (TPTZ) with ferric<br />
chloride hexahydrate [3].<br />
3. RESULTS AND DISCUSSION<br />
Increasing concentrations of PGEs negatively affected the growth of Lemna<br />
minor. During the experiment, we monitored the growth slowdown and changing the<br />
appearance of fronds. Plants started to turn yellow (chlorosis), and at the end of the<br />
experiment, we observed leaves with white or colourless areas (necrosis). We<br />
recalculated our results of the antioxidant activity on a basis of the total protein<br />
(reaction with red pyrogallol).<br />
Figures 1a and 1b show increasing antioxidant activities from 2nd day. The<br />
highest increase occurred at the end of the experiment. The increase in the<br />
antioxidant activity well corresponds with the increasing concentration<br />
of solution PtCl4.<br />
Figure 2a and 2b, the increase in the case of RhCl3 is not as obvious as in Figures<br />
1a and 1b. All values are almost at the same level all 3 days of testing. Only at the end<br />
of the experiment there was a large increase in the antioxidant activity in the 2nd<br />
concentration (1 μmol.l -1 ).<br />
- 273 -
XI. Workshop of Physical Chemists and Electrochemists´11 Brno<br />
FRAP [mgGAE·l -1 ]<br />
ABTS [mgGAE·l -1 ]<br />
20<br />
15<br />
10<br />
5<br />
0<br />
1400<br />
1200<br />
1000<br />
800<br />
600<br />
400<br />
200<br />
0<br />
control group<br />
1 µM<br />
10 µM<br />
100 µM<br />
PtCl4 RhCl3<br />
2nd day 4th day 6th day<br />
Sampling days<br />
control group<br />
1 µM<br />
10 µM<br />
100 µM<br />
2nd day 4th day 6th day<br />
Sampling days<br />
4. CONCLUSION<br />
The influence of selected PGEs on Lemna minor was observed as a change of<br />
plant antioxidant activity. Especially in the case of PtCl4 there is an evident<br />
dependence between duration of the experiment and increasing concentrations of<br />
metals. The experiment showed a good correlation with the increase of the<br />
antioxidant activity: the last sampling day leads to a very high increase of the<br />
antioxisdant activity.<br />
In contrast, we do not observe such a big trend of increase of the antioxidant<br />
activity in the test with rhodium (RhCl3). The values are virtually unchanged, only at<br />
the end of the experiment there is a blip at the lowest concentration.<br />
This experiment is only a part of a broader research of the effects of PGEs on<br />
Lemna minor. Within short time we are expecting more results from other methods<br />
from fully automated spectrometric estimation and from differential pulse<br />
voltammetry. And then we will be able to assess the influence do the PGEs on<br />
duckweed more suitable and accurately.<br />
- 274 -<br />
FRAP [mgGAE·l -1 ]<br />
ABTS [mgGAE·l -1 ]<br />
7<br />
6<br />
5<br />
4<br />
3<br />
2<br />
1<br />
0<br />
600<br />
500<br />
400<br />
300<br />
200<br />
100<br />
0<br />
control group<br />
1 µM<br />
10 µM<br />
100 µM<br />
2nd day 4th day 6th day<br />
Sampling days<br />
control group<br />
1 µM<br />
10 µM<br />
100 µM<br />
2nd day 4th day 6th day<br />
Sampling days
XI. Workshop of Physical Chemists and Electrochemists´11 Brno<br />
5. ACKNOWLEDGEMENT<br />
The work has been supported by MSMT 6215712402 and IGA 82/2001/FVHE.<br />
6. REFERENCES<br />
[1] Ravindra, K., Bencs, L., Van Grieken, R.: Science of the Total Environment, 318 (2004), 1-43.<br />
[2] Radic, S., Stipanicev, D., Cvjetko, P., Mikelic, I., L., Rajcic, M., M., Sirac, S.,<br />
Pevalek-Kozlina, B., Pavlica, M.: Ecotoxicology, 19 (2010), 1,216-222.<br />
[3] Sochor, J., Ryvolova, M., Krystofova, O., Salas, P., Hubalek, J., Adam, V., Trnkova, L., Havel, L.,<br />
Beklova, M., Zehnalek, J., Provaznik, I., Kizek, R.: Molecules. 15 (2010), 8618-8640.<br />
[4] Brain, R. A., Cedergreen, N: Biomarkers in Aquatic Plants: Selection and Utility, Springer, 2009,<br />
New York, 49 - 109.<br />
- 275 -
XI. Workshop of Physical Chemists and Electrochemists´11 Brno<br />
IMPORTANCE OF DIFFERENTIAL PULSE<br />
VOLTAMMOGRAMS FOR STUDYING OF<br />
BIOLOGICAL IMPORTANT<br />
PHENOMENONS<br />
Pavlína ŠOBROVÁ 1 , Lenka NOVÁKOVÁ 2 , Olga ŠTĚPÁNKOVÁ 2 , Miroslava<br />
BEKLOVÁ 2 , Vojtěch ADAM 1 , René KIZEK 1<br />
1Department of Chemistry and Biochemistry, Faculty of Agronomy, Mendel University in Brno,<br />
Zemedelska 1, CZ-613 00 Brno, Czech Republic<br />
2 Department of Cybernetics, Faculty of Electrical Engineering, Czech Technical University, Technicka<br />
2, CZ-166 27 Prague 6, Czech Republic<br />
Abstract<br />
This work is consisted of observing of metallothionein level by Brdicka reaction. For<br />
experiment organs as liver, kidney, spleen, heart, muscle, brain, gonad and eye of 28<br />
days old rats were used and analysed electrochemically. The highest metallothionein<br />
level was observed in tissues as kidney (67 μg of MT/ g of tissue) and liver (48.75 μg of<br />
MT/ g of tissue) as organs response for organism detoxification. High level was also<br />
observed in brain (50.53 μg of MT/ g of tissue). Moreover, we compared the<br />
electrochemical curves of metallothionein of single tissues by our suggested software.<br />
1. INTRODUCTION<br />
Metallothioneins (MTs) are a group of low molecular mass, cysteine-rich<br />
proteins with a variety of functions including involvement in metal homeostasis, free<br />
radical scavenging, protection against heavy metal damage, and metabolic regulation<br />
via Zn donation. These proteins occur in whole animal kingdom with high degree of<br />
homology. MTs were discovered and originally located from horse kidney over five<br />
decades ago in 1957 by Margoshes and Valee [1,2]. Later, similar proteins from<br />
kidney, liver, and intestine tissues of other mammals, as well as from birds, fish,<br />
crustacean mussels, fungi [3] and plants [4] and from metal-resistant microorganisms<br />
[5,6] were characterized. The molecular weight of mammalian MT is from 6 to 10 kDa<br />
and is consisted of a chain of 61 or 62 amino acids with major representation of<br />
cystein (more than 30 % from all aminoacids). MT`s structure consists of two<br />
domains: more stable α (C-terminal), containing 4 divalent ion binding sites, and β<br />
(N-terminal) capable to incorporate 3 divalent ions [7]. MTs are expressed in four<br />
different isoforms. Despite the physical-chemical similarity of the forms, their roles<br />
and occurrence in tissues vary significantly. The most widely expressed isoforms are<br />
MT-1 and MT-2, which are present almost in all types of soft tissues. MT-2 appears to<br />
be expressed more in human tissues than MT-1. MT-3 is found mainly in the brain,<br />
and also is expressed in tongue, stomach, heart, kidney and reproductive tissues [8].<br />
There have been few studies on MT-4, and the gene has been detected only in certain<br />
- 276 -
XI. WWorkshop<br />
of Phyysical<br />
Chemists and Electrocheemists´11<br />
squaamous<br />
epitthelia<br />
and the maternnal<br />
deciduu um [9]. Iso oforms mayy<br />
be distrib buted in<br />
variious<br />
ratios iin<br />
individu ual tissues and<br />
have dif ffering rate es of degraddation.<br />
The highest<br />
conncentration<br />
of MT in the t body is found in th he liver, kidney,<br />
intesstine<br />
and pa ancreas.<br />
Somme<br />
authors aalso<br />
describ bed increassing<br />
amount<br />
of MT in brain tissuees<br />
[10].<br />
2. EXPERIIMENT<br />
Our worrk<br />
was aime ed at observving<br />
of met tallothionein<br />
level meeasured<br />
by Brdicka<br />
reacction<br />
in sinngle<br />
tissue as a kidney, lliver,<br />
spleen n, brain, he eart, musclee,<br />
gonad, ey ye of 28<br />
dayy<br />
old rats. Moreover, the Brdiccka<br />
curves were compared<br />
to eeach<br />
other by our<br />
sugggested<br />
PC pprogram.<br />
3. RESULTTS<br />
AND DISCUSSIO<br />
D ON<br />
We founnd<br />
that met tallothioneiin<br />
level diff fer in single<br />
tissue (Fiig.<br />
1A. The highest<br />
conncentration<br />
of MT was s found in tthe<br />
bodies providing detoxificatiion<br />
of xeno obiotics,<br />
suchh<br />
as kidneyy<br />
(67 μg of MT/ g of tiissue)<br />
and liver l (48.75 5 μg of MT/ / g of tissue e). High<br />
leveel<br />
was also observed in n brain (500.53<br />
μg of MT/ M g of tis ssue). Half concentrat tion was<br />
deteected<br />
in goonad,<br />
eye, heart h and mmuscle<br />
(in order o 30.32 2 μg, 27.88 μg, 25.97μ μg, 24.20<br />
μg oof<br />
MT/ g oof<br />
tissue.) Moreover, M we noticed d that sing gle electrocchemical<br />
re esponses<br />
difffer<br />
in singlee<br />
tissue.<br />
Fig. . 1: A) MTT<br />
levels in individual i rat. B) Typ pical voltam mmograms of electrol lyte and<br />
metalloothionein.<br />
The mecchanism<br />
of the reactioon<br />
is based on the cat talytic evollution<br />
of hy ydrogen<br />
on mercury ellectrodes<br />
fr rom solutioons<br />
of prot tein contain ning –SH ggroup<br />
in am mmonia<br />
bufffer<br />
and hexxaamminecobalt<br />
chlorride<br />
comple ex (Co(NH3)6Cl3)<br />
calledd<br />
Brdicka solution.<br />
Thee<br />
mechanisms<br />
of the reaction r is not detaile ed elucidate,<br />
but it is expected that t the<br />
cobalt(II)<br />
complex<br />
with protein, p pepptide<br />
or bas sic nitro compounds<br />
pplay<br />
import tant role<br />
in ccatalytic<br />
prrocess.<br />
Inter raction bettween<br />
coba alt(II) ion and a proteinn<br />
causes dec creasing<br />
of ccurrent<br />
maaximum<br />
of cobalt(II) and formation<br />
of two o other poolarographic<br />
c waves<br />
(volltammogramms<br />
peaks) at potentiial<br />
area from<br />
-1.2 to o -1.5 V. The reduc ction of<br />
commplex<br />
R(SHH)2<br />
and Co( (II) at poteential<br />
app. -1.35 V corresponds c s to first catalytic c<br />
signnal<br />
(RS2Co) ). Other tw wo signals Cat1 and Cat2 corr respond to the reduc ction of<br />
hyddrogen<br />
at thhe<br />
mercury y electrode and can be e used for quantificati q ion due to the fact<br />
thatt<br />
their heigght<br />
is propo ortional to cconcentrati<br />
ion of MT. In additionn,<br />
the signa al called<br />
- 277 -<br />
Brno
XI. Workshop of Physical Chemists and Electrochemists´11 Brno<br />
Co1 could occasionally result from reduction of [Co(H2O)6] 2+ . The mechanism of the<br />
hydrogen evolution at mercury electrode in Brdicka solution is shown in Fig. 1b.<br />
We focused our attention on shape of curves of different organs. We found out<br />
that all tissues gave voltammograms with different shape. The curves do not differ<br />
only in height of the peaks, but also in peaks appearance and their shape. Some<br />
voltammograms contained RS2Co, Cat1 and Cat2 only, however, in other curves also<br />
peak Co1 was detected at -0.7 V. Voltammograms with three peaks were obtained by<br />
measuring of spleen, gonad and muscle homogenates. Analyses of kidney, liver, brain,<br />
eye and heart homogenates gave four peaks.<br />
4. CONCLUSION<br />
Studying the impact of toxic substances in organisms is still very current and<br />
provides very interesting results. Toxic substances that are part of our diet, are the<br />
more objective of such studies because of the achievements we are able not only to<br />
define the level of toxicity, but also gain an idea of the biochemical effect of the<br />
studied substance, which can bring new opportunities in its detoxification.<br />
5. ACKNOWLEDGEMENT<br />
The financial support from the following projects GA AV IAA401990701,<br />
MSMT 6215712402 and IGAMZ 10200-3 is greatly acknowledged. The authors wish<br />
to express their thanks to Anna Vasatkova for excellent work with rat breeding. The<br />
first author is „Holder of Brno PhD Talent Financial Aid“.<br />
6. REFERENCES<br />
[1] Kagi, J.H.R.: Federation Proceedings 19 (1960) 340.<br />
[2] Margoshes, M., Vallee, B.L.: Journal of the American Chemical Society 79 (1957) 4813.<br />
[3] Lerch, K.: Nature 284 (1980) 368.<br />
[4] Rauser, W.E., Curvetto, N.R.: Nature 287 (1980) 563.<br />
[5] Bulman, R.A., Nicholson, J.K., Higham, D.P., Sadler, P.J.: Journal of the American Chemical<br />
Society 106 (1984) 1118.<br />
[6] Kojima, Y., Kagi, J.H.R., Trends in Biochemical Sciences 3 (1978) 90.<br />
[7] Petrlova, J., Potesil, D., Mikelova, R., Blastik, O., Adam, V., Trnkova, L., Jelen, F., Prusa, R.,<br />
Kukacka, J., Kizek, R.: Electrochimica Acta 51 (2006) 5112.<br />
[8] Moffatt, P., Seguin, C.: DNA and Cell Biology 17 (1998) 501.<br />
[9] Liu, J., Cheng, M.L., Yang, Q., Shan, K.R., Shen, J., Zhou, Y.S., Zhang, X.J., Dill, A.L., Waalkes,<br />
M.P.: Environmental Health Perspectives 115 (2007) 1101.<br />
[10] Vasatkova, A., Krizova, S., Krystofova, O., Adam, V., Zeman, L., Beklova, M., Kizek, R.:<br />
Neuroendocrinology Letters 30 (2009) 163.<br />
- 278 -
XI. Workshop of Physical Chemists and Electrochemists´11 Brno<br />
ELECTROCHEMICAL BEHAVIUOR OF<br />
(PRP C ) AND CHANGED (PRP SC ) PRION<br />
PROTEIN<br />
Pavlína ŠOBROVÁ 1 , Dalibor HŮSKA 1 , Petr MAJZLÍK 1 , Vojtěch ADAM 1 , Jaromír<br />
HUBÁLEK 2 , Miroslava BEKLOVÁ 1 , René KIZEK 1*<br />
1 Mendel University in Brno, Zemedelska 1, CZ-613 00 Brno, CZ (E-mail: kizek@sci.muni.cz; phone:<br />
+420-5-4513-3350; fax: +420-5-4521-2044);<br />
2 Brno University of Technology, Technicka 10, CZ-616 00 Brno, CZ;<br />
Abstract<br />
Prion diseases are fatal neurodegenerative and infectious disorders of humans and<br />
animals, characterized by structural transition of the host-encoded cellular prion<br />
protein (PrP C ) into the aberrantly folded pathologic isoform PrP Sc . Prion protein is a<br />
biomolecule naturally occurring in the animal cells. This protein is present in all<br />
mammal cells and occurs primarily in neural cells and immune system cells. The main<br />
aim of this study was to optimize electrochemical methods for the detection of natural<br />
(PrP C ) and changed (PrPS C ) prion protein. To carry out the main objective a complex<br />
study of the electrochemical behaviour of both proteins was required. For this<br />
purpose fundamental electrochemical techniques were used. Both of the prions were<br />
characterized using different techniques, their limits of detection were found at pM<br />
levels and possible ability to change the structure of α-helix of natural prion (PrP C ) to<br />
β-sheet of the infectious prion (PrP Sc ) were monitored.<br />
1. INTRODUCTION<br />
Prion diseases are believed to propagate by the mechanism involving selfperpetuating<br />
conformational conversion of the normal form of the prion protein,<br />
PrP C , to the misfolded, pathogenic state, PrP Sc . The conformation change, from the αhelix<br />
in the natural protein form (PrP c ) to the β-sheet of the modified protein form<br />
(PrP Sc ), significantly influence the protein function. The mutated form (PrP Sc ) is<br />
extremely resistant to the cell degradation processes and may bind other PrP c<br />
molecules inducing the conformation change to the PrP Sc . The insufficiency of the<br />
physiological PrP c and toxic incidence of PrP Sc participate on the genesis of prion<br />
neurodegenerative diseases [1]. Prion diseases, also known transmissible spongiform<br />
encephalopathies (TSE) are a group of fatal neurodegenerative diseases. This group<br />
includes Creutzfeldt–Jakob disease, Gerstmann–Sträussler–Scheinker syndrome (GSS)<br />
and fatal familial insomnia (FFI) in humans [2]. Prion diseases can arise via infectious,<br />
hereditary or sporadic routes, and are among the most threatening diseases to humans<br />
[3,4]. In the animal kingdom, Bovine spongiform encephalopathy (BSE) is the most<br />
known, so called “the disease of mad cows”. With the outbreak of epidemics and<br />
discovery of BSE case almost everywhere in Europe, the question arises of how to<br />
improve screening methods and the possibility of detection of prions.<br />
- 279 -
XI. Workshhop<br />
of Physical l Chemists and Electrochemists<br />
E<br />
s´11<br />
2. EXPERIME<br />
OOur<br />
work w<br />
cellularr<br />
(PrP<br />
electroc<br />
techniq<br />
change<br />
prion (P<br />
C ) an<br />
chemical t<br />
ques, their<br />
the struct<br />
PrPSc ENT<br />
was aimed on<br />
study of<br />
nd changed d (PrP<br />
echniques.<br />
limits of d<br />
ture of α-h<br />
) weree<br />
monitored<br />
Sc the electro ochemical b<br />
). For this purpose p we<br />
Both of tthe<br />
prions were char<br />
detection wwere<br />
found at pM leve<br />
helix of nattural<br />
prion n (PrP<br />
d.<br />
C behaviour oof<br />
prion pro otein<br />
e optimizedd<br />
fundame ental<br />
racterized uusing<br />
diffe erent<br />
els and posssible<br />
abilit ty to<br />
) to β-sheet of f the infect tious<br />
3. RRESULTS<br />
AAND<br />
DISC<br />
Primarily,<br />
wwe<br />
attempt<br />
proteinn<br />
fragment 118 – 135; F<br />
using eelectrochemmistry<br />
and<br />
amountt<br />
of prion PrP<br />
AdTS iis<br />
based on<br />
electrodde<br />
circuit.<br />
electrodde<br />
in the b<br />
indifferrent<br />
electro<br />
accumuulation,<br />
bu<br />
responsse<br />
was obse<br />
(Fig 1B).<br />
Other co<br />
C CUSSION<br />
ed to char<br />
FW =11232<br />
optimized<br />
and PrP<br />
n the strong<br />
The exces<br />
buffer. The<br />
olyte (Fig<br />
uffer comp<br />
erved in pH<br />
onditions in<br />
SC racterize pr rion protein ns PrP<br />
2.3 and β – sheet break<br />
suitable method m for<br />
was measured using AdT<br />
g adsorbingg<br />
of prion on o the elec<br />
ss of prionn<br />
is rinsed d from the<br />
e adsorbed analyte is finally det<br />
1A). For optimizatio on we test<br />
position annd<br />
pH gradient.<br />
Th<br />
H 7.38 in phhosphate<br />
bu uffer and ti<br />
n different ccombination<br />
gave low<br />
C annd<br />
PrP<br />
ker peptide<br />
their deter<br />
TS DPV. Pr<br />
ctrode surfa<br />
surface o<br />
tected in th<br />
ted conditi<br />
he most e<br />
me of accu<br />
wer response<br />
SC (p prion<br />
e, FW = 159 97.9)<br />
rmination. The<br />
rinciple of f the<br />
face at an open o<br />
of the work king<br />
he presenc ce of<br />
ion as time<br />
of<br />
electrochem mical<br />
umulation 100 1 s<br />
es.<br />
Fig. 1: AdTS DPVV.<br />
A) Schem me of usingg<br />
of adsorpt tive transfe er strippingg<br />
technique e for<br />
study of prrions.<br />
Rene ewed surfaace<br />
of HMD DE (1) is placed p to dr drop contain ning<br />
prion standdard<br />
(2) wh here Prion is bond on nly. Other low l molecuular<br />
substances<br />
are washed<br />
out in the followwing<br />
step (3) HMDE E electrodee<br />
is placed d to<br />
supporting electrolyte e (4) and annalyzed<br />
by DPV. B) Dependence<br />
of peak he eight<br />
on time off<br />
accumulat tion. Curreent<br />
respons se enhanced d with incrreasing<br />
tim me of<br />
accumulatiion.<br />
The highest ppeak<br />
was determined<br />
under 100 s long<br />
accumulatiion.<br />
- 280 -<br />
Brno
XI. Workshop of Physical Chemists and Electrochemists´11 Brno<br />
4. CONCLUSION<br />
In conclusion, the electrochemical methods, particularly adsorptive transfer<br />
stripping technique coupled with differential pulse voltammetry appear to be suitable<br />
method for prion protein determination. In our work we optimised the technique for<br />
PrP C and PrP SC determination. The detection limit of the mentioned technique was at<br />
femtomole level.<br />
5. 5.ACKNOWLEDGEMENT<br />
The financial support from NANIMEL GA ČR 102/08/1546, NANOSEMED GA<br />
AV KAN208130801 and MSMT 6215712402 is highly acknowledged. The first author<br />
is „Holder of Brno PhD Talent Financial Aid“.<br />
6. REFERENCES<br />
[1] Ji, H.F., Zhang, H.Y.: Trends in Biochemical Sciences 35 (2010), 129.<br />
[2] Yokoyama, T., Mohri, S.: Current Medicinal Chemistry 15 (2008) 912.<br />
[3] Prusiner, S.B.: Archives of Neurology 50 (1993) 1129.<br />
[4] Prusiner, S.B., Hsiao, K.K.: Annals of Neurology 35 (1994) 385.<br />
- 281 -
XI. Workshop of Physical Chemists and Electrochemists´11 Brno<br />
ELECTROCHEMICAL BIOSENSOR FOR<br />
DETECTION OF BIOAGENTS<br />
Eva ŠVÁBENSKÁ 1, 2 , Petr SKLÁDAL 1 , Jan PŘIBYL 1<br />
1 National Centre for Biomolecular Research, Masaryk University,Brno, Czech Republic<br />
2 VOP-026 Šternberk,s.p.,VTÚO Brno Division, Czech Republic<br />
Abstract<br />
Simple and rapid detection and identification of dangerous agents is one of the most<br />
important ways preventing illness or even death of people due to infectious diseases<br />
and bioterroristic threats. An electrochemical immunosensor system is developed in<br />
our group, it employs specific capture of microbes in the sensitive area by formation<br />
of an immunocomplex and subsequent binding of the tracer, secondary antibody<br />
conjugated to peroxidase. Thus, the presence of the target microorganisms is indicated<br />
using amperometric measurement.<br />
1. INTRODUCTION<br />
In the last two decades, the expansion of biosensor technologies for detection<br />
and identification of chemical and biological species followed the requirements for<br />
simple, robust, fast and cost-effective analytical systems. Several types of biosensors<br />
working on electrochemical, optical, magnetic, piezoelectric and thermometric<br />
principle are available. Nanomaterials and nanoparticles come into the focus of the<br />
scientists as advantageous tools for preparation of enhanced biosensors layers.<br />
2. EXPERIMENT<br />
The biosensor working on amperometric principle was chosen. Before the actual<br />
detection of microorganisms, the detailed study of immunospecific layers and<br />
optimization of responses was realized. Thick film based sensors produced by screenprinting<br />
were produced at BVT Technologies, various types of working electrodes<br />
based on Au, Pt, carbon were evaluated. These sensors were modified with different<br />
gold nanoparticles and carbon nanotubes in order to enhance signal from peroxidase.<br />
Methods used for characterization of the sensing surfaces included amperometry,<br />
cyclic voltammetry (CV) with using redox probes, atomic force microscopy (AFM)<br />
and near field scanning optical microscopy (SNOM).<br />
3. RESULTS AND DISCUSSION<br />
The sensors were modified by different combinations of peroxidase, albumin<br />
and/or gelatine (inert proteins), glutaraldehyde (cross-linker) and nanoparticles /<br />
nanotubes. The mixture was applied either on a pure surface of electrode or attached<br />
by means of a cystamine-based self-assambled monolayer. Evaluation of the activity of<br />
thus immobilized peroxidase was measured by amperometry (activity of the enzyme)<br />
and cyclic voltammetrywith a redox probe (porosity of the biolayer).<br />
- 282 -
XI. WWorkshop<br />
of Phyysical<br />
Chemists and Electrocheemists´11<br />
For detecction<br />
of microbes, m sandwich assay fo ormats weere<br />
applie ed with<br />
ampperometricc<br />
evaluatio on, antiboodies<br />
prov viding high h specificitty<br />
and im mproved<br />
deteection<br />
limits<br />
were se elected. Seeveral<br />
test ts for the rapid r detecction<br />
of bio ological<br />
ageents<br />
(Escherichia<br />
col li DH5α, BBacillus<br />
subtilis<br />
var. niger, n Franncisella<br />
tul larensis<br />
LVSS)<br />
were foocused<br />
on n model ssamples<br />
in n water. Chemical C ssubstances<br />
were<br />
deteected<br />
on a similar r principlee<br />
using in nhibition of o the enzyme<br />
act tivity of<br />
choolinesterasee.<br />
At prese ent, detecttion<br />
of biological<br />
sub bstances inn<br />
bioaeroso ols was<br />
initiated<br />
usingg<br />
the biosensor<br />
tecchnology<br />
coupled to<br />
cyclonee-based<br />
sa ampling<br />
sysstem.<br />
4. CONCLLUSION<br />
Electrochhemical<br />
det tection of bbiological<br />
agents a has a large poteential<br />
for ra apid and<br />
speccific<br />
responnse<br />
to a targ get species oof<br />
microorg ganisms.<br />
5. ACKNOOWLEDGE<br />
EMENT<br />
The worrk<br />
has been n supported<br />
by the Ministry M of f Defense oof<br />
Czech Republic R<br />
(proojects<br />
no. OOVVTUO20<br />
008001 andd<br />
OSVTUO2 2006003).<br />
6.<br />
[1]<br />
[2]<br />
[3]<br />
[4]<br />
[5]<br />
REFEREENCES<br />
Skládal, P., Přibyl, J., Šafář, B.: Coommercial<br />
and Pre-Commerciaal<br />
Cell De etection<br />
Technoloogies<br />
for Defence D agaiinst<br />
Bioterr ror. Technol logy, Market and Society 39, 2008,<br />
Amsterdamm,<br />
ISBN 978- -1-58603-8588-8,<br />
p. 21-29.<br />
Skládal, P. , Pohanka, M., M Kupská, E. ., Šafář, B.: Bi iosensors, Ser rra, P. A. (Edd.),<br />
2010, Zagr reb, ISBN<br />
978-953-77619-99-2,<br />
p. 115-125.<br />
Pedrosa, VV.A.<br />
et all: Jou urnal of Electrroanalytical<br />
Chemistry, C 60 02 (2007) 149– 9–155<br />
Krejčí, J., Grosmanová, , Z., Krejčovvá,<br />
D., Skláda al, P.: Comm mercial andd<br />
Pre-Com mmercial<br />
Cell Deteection<br />
Tech hnologies ffor<br />
Defence e against Bi ioterror. NAATO<br />
Science for Peace<br />
and Securiity<br />
Series: 39, 2008, Amsteerdam,<br />
ISBN 978-1-58603-<br />
9 -858-8, p. 1500-165.<br />
Skládal, P. , Symerská, Y., Pohankaa,<br />
M., Šafář, B., B Macele, A.: A Defense e against bi<br />
NATO Seccurity<br />
through h science seriies<br />
B, 2005, Dordrecht, D ISB BN 1-4020-33385-0,<br />
p. 221 1-232.<br />
- 283 -<br />
Brno<br />
bioterror.
XI. Workshop of Physical Chemists and Electrochemists´11 Brno<br />
ELECTROANALYSIS WITH NON-MERCURY<br />
METAL-MODIFIED CARBON PASTE<br />
ELECTRODES IN THE NEW MILLENNIUM<br />
Ivan ŠVANCARA 1<br />
1 Department of Analytical Chemistry, Faculty of Chemical Technology, University of Pardubice,<br />
Studentská 573, HB/C, 532 10 Pardubice, Czech Republic<br />
Abstract<br />
In this contribution, an overview on non-mercury metal-modified carbon paste<br />
electrodes is given focused on the research activities in the period of 2001-2011 and<br />
concerning scientific collaboration between the electroanalytical group at the<br />
University of Pardubice and similarly orientated partners across Europe (namely:<br />
Austria, Poland, Slovakia, Lithuania, Greece, Slovenia, and Serbia).<br />
1. INTRODUCTION<br />
In the new millennium, under the increasing significance of the<br />
environmentally friendly ("green") chemistry [1], a new family of non-mercury<br />
metal-based electrodes (MeEs) has occupied a prominent position in the modern<br />
electroanalysis and, especially, in electrochemical stripping analysis (ESA). All this<br />
movement had been propelled by introducing of bismuth film-coated glassy carbon<br />
electrode (BiF-GCE) in 2000 [2], followed soon by numerous alternate configurations<br />
(see [3-5] and refs. therein), amongst which carbon paste-based substrates were<br />
actually the second electrode material, recommended and more widely tested in<br />
combination with bismuth films and related arrangements [6-11]. All the<br />
configurations were more or less successfully used in ESA for the determination of<br />
various heavy metals (e.g., Zn, Cd, Pb, Tl, Sn, and In), offering a comparable<br />
electroanalytical performance to that of traditional mercury electrodes (i.e.: HMDE<br />
and MFE) that as still more controversial within the green chemistry concept <br />
are now undergoing a general decline of interest.<br />
2. THE STATE OF THE ART<br />
Initially, a configuration of the (i) BiF-CPE [7,9] type was presented, where the<br />
bismuth film had been deposited electrolytically (ether in situ, or externally, from<br />
special plating solutions), followed soon by further two bismuth-based variants<br />
enabled by easy-to-make bulk-modification of the carbon paste. These configurations,<br />
(ii) Bi2O3-CPE [6,8] and (iii) Bi-CPE [10,11] containing solid oxide or finely pulverised<br />
metal, have then contributed to the continuing popularity of carbon paste-based and<br />
bismuth-modified electrodes, sensors, and detectors in the up-coming years. There has<br />
been yet another variant (iv) BiF4-CPE [12], whereas the original BiF-CPE could be<br />
miniaturised [13] or combined with a new, electroactive carbon paste substrate [14].<br />
Qualitatively new contributions in employing the carbon paste-based substrates have<br />
- 284 -
XI. Workshop of Physical Chemists and Electrochemists´11 Brno<br />
then come in the mid and late 2000s in the form of other types of MeEs; namely, as<br />
antimony- [15,16] and lead- [17] film plated CPEs.<br />
The latter configurations represent, in fact, a new concurrence to the already<br />
established bismuth-based variants although the use of both antimony and lead <br />
and, especially, of their Sb III and Pb II salts (for preparation of the respective films) <br />
means a certain step back with respect to environmentally friendly procedures. Thus,<br />
of interest are now some novel configurations that contain less harmful Sb- (or Pb-)<br />
based precursors like carbon pastes bulk-modified with Sb2O3, SbOCl [18], SbF3, and<br />
Sb-powder [19].<br />
3. FUTURE PROSPECTS<br />
As documented in a retrospective review a year ago [20], the young field of ESA<br />
with MeEs has already spread throughout the world. Together with some types of<br />
screen-printed electrodes, the family of MeEs is the first successful alternative of<br />
mercury-based electrodes dominating in the electrochemistry and electroanalysis for<br />
lengthy decades. And, in some respect, MeEs are also the real aspirants for the full<br />
replacement of both HMDE and MFE. Although the newest activities correspond to<br />
such predictions, it is wise to wait a little bit with so conclusive statements. As known<br />
in science, only time will show...<br />
4. ACKNOWLEDGEMENT<br />
Financial grants from the Ministry of Education, Youth, and Sports of the Czech<br />
Republic (projects № MSM0021627502 and LC 06035) are gratefully acknowledged<br />
5. REFERENCES<br />
[1] Wang, J.: Ass. Chem. Res. 35 (2002) 811-816.<br />
[2] Wang, J., Lu, J.-M., Hočevar, S. B., Farias, P. A. M., Ogorevc, B.: Anal. Chem. 72 (2000) 3218-<br />
3222.<br />
[3] Economou, A.: Trends Anal. Chem. 24 (2005) 334-340.<br />
[4] Wang, J.: Electroanalysis 17 (2005) 1341-1346.<br />
[5] Švancara, I., Vytřas, K.: Chem. Listy 100 (2006) 90-113.<br />
[6] Pauliukaitė, R., Kalcher, K.: (2001) YISAC '01: 8 th Young Investigators’ Seminar on Analytical<br />
Chemistry, Book of Abstracts), University of Pardubice, Pardubice, 2001, pp. 10-11.<br />
[7] Królicka, A., Pauliukaitė, R., Švancara, I., Metelka, R., Norkus, E., Bobrowski, A., Kalcher, K.,<br />
Vytřas K.: Electrochem. Commun. 4 (2002) 193-196.<br />
[8] Pauliukaitė, R., Metelka, R., Švancara, I., Królicka, A., Bobrowski, A., Vytřas, K., Norkus, E.,<br />
Kalcher, K.: Anal. Bioanal. Chem. 374 (2002) 1155-1158.<br />
[9] Vytřas, K., Švancara, I., Metelka, R.: Electroanalysis 14 (2002) 1359-1364.<br />
[10] Švancara, I., Baldrianová, L., Tesařová, E., Hočevar, S.B., Elsuccary, S.A.A., Economou, A.,<br />
Sotiropoulos, S., Ogorevc, B., Vytřas, K.: Electroanalysis 18 (2006) 177-185.<br />
[11] Hočevar, S. B., Švancara, I., Ogorevc, B., Vytřas, K.: Electrochim. Acta 51 (2005) 706-710.<br />
[11] Sopha, H., Baldrianová, L., Tesařová, E., Grincienė, G., Weidlich, T., Švancara, I., Hočevar, S.B.:<br />
Electroanalysis 22 (2010) 1489-1493.<br />
[12] Baldrianová, L., Švancara, I., Sotiropoulos, S.: Anal. Chim. Acta 599 (2007) 249-<br />
255. Papp, Zs., Guzsvány, V., Švancara, I., Vytřas, K., Gaál, F., Bjelica, L.,<br />
Abramović, B.; in: Sensing in Electroanalysis, Vol. 4 (K. Vytřas, K. Kalcher, I.<br />
Švancara; eds.), Univ. Pardubice Press Centre, 2009, pp. 47-58.<br />
- 285 -
XI. Workshop of Physical Chemists and Electrochemists´11 Brno<br />
[13] Švancara, I., Hočevar, S.B., Baldrianová, L., Tesařová, E., Vytřas, K.: Sci. Pap.<br />
Univ. Pardubice, Ser. A 13 (2007) 5-19.<br />
[14] Tesařová, E., Baldrianová, L., Hočevar, S.B., Švancara, I., Vytřas, K., Ogorevc, B.:<br />
Electrochim. Acta 54 (2009) 1506-1510.<br />
[15] Bobrowski, A., Królicka, A., Łyczkowska, E.: Electroanalysis 20 (2008) 61-67.<br />
[16] Švancara, I., Florescu, M., Stočes, M., Baldrianová, L., Svobodová, E., Badea, M.;<br />
in: Sensing in Electroanalysis, Vol. 5 (K. Vytřas, K. Kalcher, I. Švancara; eds.),<br />
Univ. Pardubice Press Centre, 2010, pp. 109-125.<br />
[17] Švancara, I., Svobodová, E., Stočes, M.: article(s) in preparation.<br />
[18] Švancara, I., Prior, C., Hočevar, S.B., Wang, J.: Electroanalysis 22 (2010) 1405-<br />
1420.<br />
- 286 -
XI. Workshop of Physical Chemists and Electrochemists´11 Brno<br />
ELECTROCHEMISTRY OF OSMIUM(VI)-<br />
MODIFIED CARBOHYDRATES<br />
Mojmír TREFULKA 1 , Martin BARTOŠÍK 1 , Emil PALEČEK 1<br />
1 Institute of Biophysics, AS CR, v.v.i., Královopolská 135, 612 65 Brno, Czech Republic<br />
Abstract<br />
Oligo- and polysaccharides (Sachs) were modified with complexes of six-valent<br />
osmium with nitrogen ligands [Os(VI)L]. The most tested ligands were N,N,N´,N´-<br />
tetramethylethylenediamine (temed) and 2,2´-bipyridine (bipy). At HMDE, cyclic<br />
voltammograms (CVs) of Sachs-Os(VI)L adducts showed three cathodic peaks Ic-IIIc<br />
and their anodic counterparts Ia-IIIa. Potential (EP) of these peaks were in the range<br />
from 0 V to -1.1 V. In addition, peak IVc and electrocatalytic peaks Vc and Va (EP -<br />
1.2 V against Ag/AgCl/3 M KCl electrode) were observed, using some ligands, e.g<br />
bipy. With square wave voltammetry, peak Ic of dextran-Os(VI)temed was detectable<br />
down to 3.2 ng/ml directly in the reaction mixture. Using peak Vc, by differential<br />
pulse voltammetry, purified dextran-Os(VI)bipy was detectable down to 40 pg/ml.<br />
CVs of Sachs-Os(VI)L at PGE differed from those at HMDE by absence of an<br />
equivalent of sharp peak Ic and catalytic peaks Vc and Va.<br />
1. INTRODUCTION<br />
Compounds containing 1,2-diol groups, including mono-, oligo- and<br />
polysaccharides (Sachs) can be selectively modified with complexes of sixvalent<br />
osmium with nitrogen ligands [Os(VI)L] (Fig. 1), yielding electroactive adducts<br />
producing redox couples at carbon and Hg electrodes and electrocatalytic peaks at Hg<br />
electrodes.<br />
2. EXPERIMENT<br />
Voltammetric measurements were performed with an Autolab analyzer (Eco<br />
Chemie, Utrecht, The Netherlands) in connection with VA-Stand 663 (Metrohm,<br />
Herisau, Switzerland). Three-electrode system was used consisting of Ag/AgCl/3M<br />
KCl electrode as a reference and platinum wire as an auxiliary electrode. The hanging<br />
mercury drop electrode (HMDE) with an area of 0.4 mm 2 or basal plane pyrolytic<br />
graphite electrodes (PGE), 9 mm 2 were the working electrodes. All measurements<br />
were performed at room temperature. The samples were freed from oxygen by<br />
bubbling 180 s with argon before each measurement.<br />
3. RESULTS AND DISCUSSION<br />
At HMDE, cyclic voltammograms (CVs) of Sachs-Os(VI)L showed three<br />
cathodic peaks Ic-IIIc and their anodic counterparts Ia-IIIa (Fig.2A). Potential (EP) of<br />
these peaks depending on the type of ligand [1, 2] were within range from 0 V to -1.1<br />
V. In addition to these redox couples, peak IVc and peaks Vc and Va were produced<br />
by Sachs-Os(VI)L, using some ligands, e.g. bipy [3] (Fig. 2B). Both peaks V (EP -1.2 V<br />
- 287 -
XI. Workshop of Physical Chemists and Electrochemists´11 Brno<br />
against Ag/AgCl/3 M KCl electrode) were assigned to the catalytic hydrogen<br />
evolution. These peaks were much larger than less negative peaks. CVs of Sachs-<br />
Os(VI)L at PGE differed from those at HMDE by absence of an equivalent sharp peak<br />
Ic and catalytic peaks V [2, 4].<br />
We have found that the electrochemical behavior of Sachs-Os(VI)L adducts at<br />
carbon and mercury electrodes is in some features similar to the electrochemical<br />
behavior of Os(VIII)L-modified nucleic acids [5] and proteins. Using the Adsorptive<br />
Transfer Stripping (AdTS, ex situ) voltammetry with carbon electrode, Sachs can be<br />
analyzed directly in the reaction mixture. Similar analysis of DNA-Os(VIII)bipy<br />
adducts at HMDE was not possible because the reagent interfered with the analysis.<br />
We have found that in difference to Os(VI)bipy, the Os(VI)temed as a free reagent<br />
produced only poorly developed peaks at HMDE that could be easily resolved from<br />
the peaks of the Sachs-Os(VI)temed adduct. Moreover, free Os(VI)temed could be<br />
removed from the electrode surface by simple washing with water. These findings<br />
enabled us to analyze Os(VI)temed-modified dextran at HMDE directly in the<br />
reaction mixture and determine dextran in presence of an excess of monomeric<br />
glucose or sucrose. In difference to previous analyses of Os(VIII)L-modified DNA and<br />
proteins [6], we have found that Sachs-Os(VI)temed can be determined at HMDE in<br />
presence of the reaction mixture not only by AdTS but also by conventional AdS (in<br />
situ) methods; such determination was earlier not possible with other Os(VI)L<br />
complexes, regardless of the type of the electrode used. Using square wave<br />
voltammetry, nanomolar concentrations of Sachs can be determined. For example,<br />
dextran was detectable down to 20 nM concentration (related to polysaccharide<br />
monomer content; this concentration corresponded to about 3.2 ng/ml). Our<br />
preliminary results suggest that using catalytic peak Vc, detection limits of Sachs can<br />
be decreased at least by two orders of magnitude as compared to detection limits<br />
obtained with any of the redox couples. Dextran was detectable with peak Vc down to<br />
about 40 pg/ml. Os(VI)L-modified carbohydrates were also suitable for the analysis at<br />
carbon electrodes.<br />
4. CONCLUSION<br />
We developed a new, highly sensitive electrochemical method of carbohydrate<br />
analysis allowing their determination at nM and pM level. Using a transfer (ex situ)<br />
method, volumes of the analyte sample may be reduced to μl. To our knowledge this<br />
method represents the most sensitive way of determination of polysaccharides and<br />
oligosaccharides. For instance, improved phenol-sulfuric method [7] requires 1–150<br />
nmol of sugars as compared to fmols necessary for our methods. New electrochemical<br />
methods for Sachs analysis may become very important in biomedicine, including<br />
cancer and neurodegenerative diseases. Alternations in protein glycosylation are<br />
associated with a variety of tumors. For example, prostate-specific antigen (PSA),<br />
considered as the best tumor marker for diagnosing early prostate carcinoma [8], is a<br />
28,400 Da glycoprotein containing ~8% carbohydrate in the form of an N-linked<br />
oligosaccharide side chain. PSA concentration in human sera is very low (in the order<br />
- 288 -
XI. WWorkshop<br />
of Phyysical<br />
Chemists and Electrocheemists´11<br />
of nng/ml),<br />
makking<br />
the stu udies of glyycan<br />
structu ures of patie ent serum PPSA<br />
difficu ult. High<br />
senssitivity<br />
of f the new w electrocaatalytic<br />
sig gnal of Os(VI)L-mo<br />
O odified pol ly- and<br />
oliggosacchariddes<br />
holds a great g promiise<br />
for a fas st, inexpens sive and simmple<br />
technique<br />
for<br />
thesse<br />
studies.<br />
Fig. . 1 Chemiccal<br />
modific cation of poly-<br />
andd<br />
oligosacccharides<br />
with w Os(VVI)L<br />
commplexes.<br />
A part of α-1,4-gluucan<br />
(ammylose,<br />
dexttrin)<br />
molecu ule formingg<br />
an<br />
addduct<br />
with aan<br />
Os(VI) L complex<br />
is<br />
showwn.<br />
As lligands<br />
(L)<br />
nitrogennous<br />
commpounds,<br />
ssuch<br />
as te emed or bbipy,<br />
werre<br />
used.<br />
5. ACKNOOWLEDGE<br />
EMENT<br />
This worrk<br />
was supported<br />
by ggrant<br />
of th he Grant Agency Ag of thhe<br />
Czech Republic R<br />
301/10/P548.<br />
6.<br />
[1]<br />
[2]<br />
[3]<br />
[4]<br />
[5]<br />
[6]<br />
[7]<br />
[8]<br />
REFEREENCES<br />
Fojta M., KKostecka<br />
P., Trefulka T M., HHavran<br />
L., an nd Palecek E.: Anal. Chem. ., 79 (2007), 1022. 1<br />
Trefulka MM.<br />
and Palecek<br />
E.: Electroaanalysis,<br />
22 (2 2010), 1837.<br />
Palecek E. and Trefulka a M.: Analyst,<br />
136 (2011), 321.<br />
Trefulka MM.<br />
and Palecek<br />
E.: Electroaanalysis,<br />
21 (2 2009), 1763.<br />
Palecek E. . and Jelen F., F in Perspecctives<br />
in Bioa analysis, Elect trochemistry of Nucleic Acids A and<br />
Proteins. TTowards<br />
Elec ctrochemical Sensors for Genomics an nd Proteomiccs.,<br />
Vol. 1 (Pa alecek E.,<br />
Scheller F. ., and Wang J., J eds.), Elsevvier,<br />
Amsterdam,<br />
2005, p. 73. 7<br />
Palecek E. : Methods En nzymol., 212 ( (1992), 139.<br />
Masuko T.,<br />
Minami A. , Iwasaki N., Majima T., Nishimura N S. I., and Lee YY.<br />
C.: Anal. Biochem., B<br />
339 (2005) ), 69.<br />
Tabares G.,<br />
Radcliffe C.<br />
M., Barrabees<br />
S., Ramirez z M., Aleixan ndre R. N., Hooesel<br />
W., Dw wek R. A.,<br />
Rudd P. MM.,<br />
Peracaula R., R and de Lloorens<br />
R.: Glyc cobiology, 16 (2006), 132.<br />
- 289 -<br />
I [µA]<br />
I [µA]<br />
1<br />
0<br />
-1<br />
0<br />
-4<br />
-8<br />
A<br />
B<br />
Va<br />
Vc<br />
-1.5<br />
IIIa<br />
IIIc<br />
IIa<br />
IIc<br />
-1.0 -0.5<br />
E [V]<br />
IIc<br />
0.0<br />
Fig. 2 Cyclic C vooltammogra<br />
ams of<br />
dextran modified m either A, A with<br />
Os(VI)tem med (red) or B, with<br />
Os(VI)bipy y (blue). AA,<br />
30 μM dextran- d<br />
Os(VI)tem med, accumuulation<br />
tim me, tA 60<br />
s, scan rat te, v 2V/s; B, 5 μM dextran- d<br />
Os(VI)bipy y, tA 600<br />
s, v 0.1 0 V/s.<br />
AUTOLAB B, HMDE, AA)<br />
80 mM Britton- B<br />
Robinson buffer, pHH<br />
7.0, B) 100<br />
mM<br />
Britton-Ro obinson bufffer,<br />
pH 4.7 75.<br />
Ia<br />
Brno
XI. Workshop of Physical Chemists and Electrochemists ´11 Brno<br />
ADSORPTIVE STRIPPING ELIMINATION<br />
VOLTAMMETRY<br />
Libuše TRNKOVÁ 1<br />
1 Laboratory of Biophysical Chemistry and Electrochemistry, Department of Chemistry, Faculty of<br />
Science, Masaryk University, Kotlářská 2, 611 37 Brno, Czech Republic<br />
LABIFEL: http://labifel.byethost24.com/, e-mail: libuse@chemi.muni.cz; litrn@seznam.cz<br />
Abstract<br />
The contribution is devoted to the transformation of linear sweep voltammetric (LSV)<br />
or cyclic voltammetric (CV) results into elimination voltammetry with linear scan<br />
(EVLS) for the case of adsorbed electroactive species. The approach can be named<br />
adsorptive stripping elimination voltammetry (AdS EVLS) or adsorptive transfer<br />
stripping elimination voltammetry (AdTS EVLS). In connection with mercury or<br />
graphite electrode it is illustrated advantages of this electroanalytical approach. Using<br />
AdS EVLS the differences in the reduction and oxidation processes of biologically<br />
important molecules such as nucleic acids, oligonucleotides and nucleobases were<br />
presented.<br />
1. INTRODUCTION<br />
Adsorptive stripping voltammetry (AdSV) and adsorptive transfer stripping<br />
voltammetry (AdTSV) 1-4 belong to the family of stripping voltammetric procedures in<br />
which the pre-concentration step plays a key role. While in cathodic or anodic<br />
stripping technique the pre-concentration step is controlled by electrolysis, in<br />
adsorptive stripping this step is controlled by adsorption. The adsorption step proceeds<br />
on the working electrode surface and it is realized by adsorption of reactants,<br />
intermediates or products of electrode processes. It is also one of the method of the<br />
modified electrodes preparation, often useful for electrochemical sensors. AdSV can<br />
be employed in the trace analysis of organic compounds exhibiting surface active<br />
properties. When the compounds studied contains an electrochemically reducible or<br />
oxidizable group, then we can observe current peaks on the voltammetric curves and<br />
can determine very low concentration of the electroactive species. Stripping<br />
techniques are usually combined with conventional voltammetric methods such as<br />
pulse, differential pulse, square wave and linear sweep voltammetry. Recently it has<br />
been found that elimination voltammetry with linear scan (EVLS) is capable to<br />
improve voltammetric signals not only from the point of view of current sensitivity<br />
but also of the resolution of overlapped signals. It was found that EVLS in<br />
combination with adsorptive stripping procedure (AdS EVLS) is a promising tool for<br />
achieving very good resolution of electrode processes, for qualitative and quantitative<br />
analysis, as well as for identification of the structures of compounds studied 5-11 .<br />
The EVLS can be considered as a mathematical model of the transformation of<br />
current-potential curves capable of eliminating some selected current components,<br />
290
XI. Workshop of Physical Chemists and Electrochemists ´11 Brno<br />
while conserving others by means of elimination functions 5-7 . For the calculation of<br />
the elimination functions three voltammetric curves at different scan rates should be<br />
recorded under identical experimental conditions. One scan rate is chosen as a<br />
reference scan rate and the total voltammetric current I is affected by the ratio<br />
ref<br />
ref and<br />
the ratio has exponent according to the dependence of current component<br />
on the scan rate:<br />
1 2 I I I .....<br />
I ref<br />
ref d ref c k<br />
where I d , I c , Ik is the diffusion (exponent ½), charging (exponent 1), and<br />
kinetic (exponent 0) current component. The equation (1) can be regarded as a<br />
normalization equation where the reference state is characterized by the total current<br />
measured at reference scan rate ref . Three equations with three different ratios<br />
ref provide the set of total currents measured at different scan rates. From<br />
experimental point of view the integer 2 is suitable.<br />
These total currents were converted into a current elimination function which is<br />
expressed as a linear combination of them. The best results are obtained using the<br />
function E4 eliminating kinetic and charging current components and conserving the<br />
diffusion current component:<br />
f ( I ) 11.<br />
657I1<br />
2 17.<br />
485 I 5.<br />
8284I2<br />
(2)<br />
I1<br />
2<br />
1 2<br />
ref ref<br />
Where , I , and I 2 are total voltammetric currents measured at ,<br />
2<br />
ref , and , respectively.<br />
The ELSV has several advantages: (a) expanded available electrode potential<br />
range, (b) increased current sensitivity, and (c) improved signal resolution. The two<br />
latter advantages result from the fact that the elimination of charging and kinetic<br />
currents reduces the irreversible current width and increases the peak height. This<br />
effect is particularly pronounced in the case of an adsorbed substance yielding a welldeveloped<br />
elimination signal (peak-counterpeak). As a practical application, the AdS<br />
EVLS of thermally denatured DNA, ODNs and nucleobases on hanging mercury and<br />
carbon electrodes has been performed.<br />
2. EXPERIMENT<br />
Voltammetric measurements were performed using the analyzer Autolab 20<br />
EcoChemie connected with the VA Stand 663 and controlled by GPES manager<br />
software. The main part of this apparatus was electrochemical vessel equipped with<br />
three electrodes: the hanging mercury drop electrode or carbon electrode as a<br />
working electrode, the argent chloride electrode (Ag/AgCl/3MKCl) as a reference<br />
electrode and the platinum wire as a counter electrode. The samples were analyzed<br />
usually in the phosphate – acetate buffer. Experimental conditions of LSV were<br />
following: the time of accumulation was 120s, conditioning of electrode was 2<br />
seconds, the potential step was 2 mV. The LSV curves were measured at different scan<br />
291<br />
(1)
XI. Workshop of Physical Chemists and Electrochemists ´11 Brno<br />
rates from 100 to 800 mV/s. All voltammetric measurements were performed in inert<br />
atmosphere (argon) and at room temperature. Three of these curves with integer 2<br />
(1/2, 1, and 2 multiple of reference scan rate) were taken for EVLS procedure.<br />
3. RESULTS AND DISCUSSION<br />
Theoretical transition of EVLS of an irreversible adsorbed electroactive particle<br />
predicted the specific signal in which a sharp positive peak immediately followed by a<br />
negative peak (peak-counterpeak). The verification of EVLS theory for adsorbed<br />
depolarizer was carried out on model compounds - denatured calf thymus DNA,<br />
which provides a common reduction on HMDE signal of cytosine and adenine<br />
residues 7 . It was found that the EVLS yields significantly higher sensitivity in the<br />
detection of voltammetric signals not only from the current increase (7-15 times<br />
higher), but also by their separation when the peak potentials are closer than 40 mV8-<br />
9. Therefore EVLS (E4 function) is applied to the joint reduction peak of adenine and<br />
cytosine in oligonucleotides (ODNs) 10-13 . At the beginning of ODN research homo-<br />
ODNs (nonamers) were studied. EVLS E4 function was applied to the separation<br />
adenine and cytosine signals in the mixtures of dA9 and dC9. In the case of hetero-<br />
ODNs (nonamers) the different base sequences were studied. In comparison to<br />
common voltammetric methods only EVLS was able to separate overlapping signals<br />
(two ODN structure forms). Our research continues to trend higher voltammetric<br />
signal amplification which is accomplished by two techniques, adsorptive stripping<br />
voltammetry (AdSV - adsorptive stripping voltammetry) or AdTS EVLS (AdTSV -<br />
adsorptive transfer stripping voltammetry). Both methods are able not only to<br />
determine the ratio of adenine and cytosine in ODN molecules but also to<br />
distinguish the relative positions of these nucleobases in the ODN chain. It should be<br />
noted that an important parameter influencing the signals ODNs EVLS the pH, ionic<br />
strength, accumulation time and accumulation potential 10-13 .<br />
4. CONCLUSION<br />
Despite persistent prejudices against elimination voltammetry it was showed<br />
that EVLS has a chance to win in the field of electroanalysis. Each method has<br />
advantages and disadvantages, but EVLS has numerous advantages overcoming its<br />
disadvantages. If the experiment is performed correctly (i.e., the same number of I - E<br />
pairs = the same potential step for all measured curves, good working potentiostat),<br />
then EVLS:<br />
is fast, inexpensive and not time-consuming method;<br />
is able to eliminate the currents of different types (not limited to capacitive<br />
current);<br />
guarantees the simultaneous elimination of the multiple current components;<br />
is not limited only by reducing process on a mercury electrode;<br />
helps to increase the sensitivity of irreversible current signals;<br />
expands potential window (eliminating Ik);<br />
distinguishes overlapped signals;<br />
reveals minor (hidden) processes in the major ones;<br />
292
XI. Workshop of Physical Chemists and Electrochemists ´11 Brno<br />
confirms quickly the electron transfer in an adsorbed state (peak-counterpeak)<br />
is able to detect possible interactions, changes in the structure on charged<br />
interfaces;<br />
does not need the fundamental line current (baseline correction);<br />
is able to help in the study of reaction mechanism;<br />
allows calculation of from different potential peak values of two functions<br />
(preferably E1 and E4).<br />
EVLS disadvantages can be considered:<br />
results of the elimination procedure does not exactly correspond to the theoretical<br />
conclusions (the currents do not affect each other), then EVLS curves are<br />
distorted. One of these distortions is a peak-counterpeak signal;<br />
EVLS errors on solid electrodes are higher than of LSV or CV errors.<br />
However, the theoretical and practical development of EVLS and AdS EVLS<br />
continues 14 . We can conclude that the combination of both techniques AdS or AdTS<br />
and EVLS is a suitable tool for the study of absorbable molecules such as nucleic acids<br />
and their constituents.<br />
5. ACKNOWLEDGEMENT<br />
This work has been supported by projects INCHEMBIOL MSM0021622412,<br />
BIO-ANAL-MED LC06035 and MUNI/A/0992/2009 by the Ministry of Education,<br />
Youth and Sports of the Czech Republic.<br />
6. REFERENCES<br />
[1] Bard A.J.; Faulkner L.R.: Electrochemical Methods, Fundamentals and Applications,<br />
2nd edition, John Wiley & Sons, Inc., NewYork, 2000.<br />
[2] Kissinger P.T.; Heineman W.R.: Laboratory Techniques in Electroanalytical Chemistry, Marcel<br />
Dekker, New York, 1984.<br />
[3] Bond A.: Modern Polarographic Methods in Analytical Chemistry, Marcel Dekker, New York<br />
and Basel, 1980.<br />
[4] Paleček E.; Scheller F.: Electrochemistry of Nucleic Acids and Proteins, Towards Electrochemical<br />
Sensors for Genomics and Proteomics, Perspectives in Bioanalysis, Vol. 1, 1st ed., Wang J. (ed.),<br />
Elsevier, Chapter 3: Electrochemistry of Nucleic Acids (E. Paleček, F. Jelen) 2006.<br />
[5] Dračka O.: J.Electroanal. Chem., 402 (1996)19.<br />
[6] Trnkova, L.; Dracka, O.: J. Electroanal. Chem. 413 (1996) 123.<br />
[7] Trnkova, L.; Kizek, R.; Dracka, O.: Electroanalysis 12 (2000) 905.<br />
[8] Trnkova L.: J. Electroanal. Chem., 582 (2005)258.<br />
[9] Trnkova, L.: Chem. Listy 95 (2001) 518.<br />
[10] Trnkova, L.; Jelen, F.; Petrlova, J.; Adam, V.; Potesil, D.; Kizek, R.: Sensors 5 (2005) 448.<br />
[11] Trnkova, L.; Jelen, F.; Postbieglova, I.: Electroanalysis 15 (2003) 1529.<br />
[12] Trnková L., Jelen F., Postbieglova I.: Electroanalysis 18 (2006) 662.<br />
[13] Trnkova, L.; Postbieglova, I.; Holik, M.: Bioelectrochemistry 63 (2004) 25.<br />
[14] Serrano, N.; Klosova, K.; Trnkova, L.: Electroanalysis 22 (2010) 1873.<br />
293
XI. Workshop of Physical Chemists and Electrochemists ´11 Brno<br />
THEORETICAL STUDY OF N–H BOND<br />
DISSOCIATION ENTHALPIES IN PARA<br />
SUBSTITUTED ANILINES<br />
Adam VAGÁNEK 1 , Ján RIMARČÍK 1 , Lenka ROTTMANNOVÁ 1 , Erik KLEIN 1 ,<br />
Vladimír LUKEŠ 1<br />
1 Institute of Physical Chemistry and Chemical Physics, Slovak University of Technology, Radlinského<br />
9, SK-812 37 Bratislava, Slovak Republic<br />
Abstract<br />
In this work, we have calculated bond dissociation enthalpies of N–H bonds in twelve<br />
para-substituted anilines using density functional theory (DFT) with PBE functional<br />
and 6-311++G** basis set, and density functional tight binding method, DFTB+, in<br />
order to assess the applicability of employed methods for the study of substituent<br />
induced changes in N–H BDE.<br />
1. INTRODUCTION<br />
Bond dissociation enthalpy, BDE, is defined, as BDE = H(R ) + H(H ) – H(R–H)<br />
where H(R ) is the total enthalpy of the radical, H(H ) is the total enthalpy of the<br />
abstracted hydrogen atom, and H(R-H) is the total enthalpy of the molecule. Hence,<br />
bond dissociation enthalpy is the reaction enthalpy of homolytic abstraction of a<br />
hydrogen atom from a molecule. Hydrogen atom transfer, HAT, represents common<br />
mechanism in organic chemistry.<br />
The main aim of this work is to assess the reliability of DFTB+ semiempirical<br />
computational approach for the description of the substituent effect in terms of N–H<br />
bond BDEs in para-substituted anilines (Fig. 1).<br />
X<br />
Fig.1 Para-substituted anilines X = OMe, Me, COMe, CF3, CN, NO2, COtBU, CCH, F,<br />
COOMe, Cl, Br<br />
2. COMPUTATIONAL DETAILS<br />
For the geometry of each compound and radical and their total electronic<br />
energy calculations, DFT method with PBE functional and 6-311++G** basis set in<br />
Gaussian 03 [1] program package was employed. In the case of DFTB+ method,<br />
Release 1.1 of DFTB+ program [2] was employed. DFTB+ method is based on PBE<br />
functional.<br />
294<br />
NH 2
XI. Workshop of Physical Chemists and Electrochemists ´11 Brno<br />
3. RESULTS AND DISCUSSION<br />
Because DFTB+ program does not provide total enthalpies, all BDE values were<br />
approximated from the total electronic energies. For the sake of exact comparison of<br />
substituent effect description for DFT and DFTB+ approaches, we have chosen the<br />
PBE functional in DFT calculations. Although anilines are widely studied compounds,<br />
only several experimental BDEs are available.<br />
To verify the reliability of employed computational approach for substituent<br />
effect description, it is inevitable to compare calculated and experimental ΔBDE<br />
values, where ΔBDE = BDE(X-PhNH2) – BDE(PhNH2) represents the difference<br />
between substituted and non-substituted aniline BDEs. Table 1 summarizes computed<br />
and available experimental ΔBDEs together with the Hammett p constants [3].<br />
Calculated ΔBDEs are presented in the DFT and DFTB+ columns. Experimental<br />
ΔBDEs estimated on the basis of the equilibrium acidities and the oxidation potentials<br />
of conjugated anions of involved anilines are given in the EC column [4].<br />
Table 1. BDE* values in kJ mol –1 , and Hammett constants σp.<br />
Substituent DFT DFTB+ EC σp<br />
p-OMe –16 –21 –8 –0,27<br />
p-Me –6 –6 –1 –0,17<br />
p-F –5 –8 – 0,06<br />
p-CCH –2 –5 – 0,23<br />
p-Cl –1 – 1 0,23<br />
p-Br 0 – 0 0,23<br />
p-COtBu 8 –1 – 0,32<br />
p-COOMe 9 1 – 0,45<br />
p-COMe 10 2 8 0,50<br />
p-CF3 11 9 18 0,54<br />
p-CN 12 3 12 0,66<br />
p-NO2 18 12 19 0,78<br />
*BDE of non-substituted aniline: 399 kJ mol –1 (DFT), 406 kJ mol –1 (DFTB+), 386<br />
kJ mol –1 (EC)<br />
Comparison of experimental BDE of non-substituted aniline with the two<br />
calculated values indicates that employed approaches overestimate its N–H BDE.<br />
Calculation results show that DFT/PBE/6-311++G** method describes substituent<br />
effect in good agreement with experiment in terms of BDE values. Average deviation<br />
between 8 experimental and calculated BDEs reached 3.4 kJ mol –1 . This indicates<br />
that DFT/PBE/6-311++G** approach provides reliable BDEs for para-substituted<br />
anilines. From Table 1 it can be seen that DFTB+ method provides less reliable BDEs,<br />
differences between DFTB+ and experimental BDE values are in 5–13 kJ mol –1 range.<br />
4. CONCLUSION<br />
We have found that DFTB+ approach is not very suitable for substituent effect<br />
description in studied compounds, because there is no good agreement between<br />
DFTB+ BDE values with the experimental ones. Both employed approaches<br />
295
XI. Workshop of Physical Chemists and Electrochemists ´11 Brno<br />
overestimate individual BDEs of studied anilines. DFT/PBE/6-311++G** method<br />
describes substituent effect in accordance to the experimental BDE values.<br />
5. ACKNOWLEDGEMENT<br />
The work has been supported by Scientific Grant Agency (VEGA Project<br />
1/0137/09).<br />
6. REFERENCES<br />
[1] Pople, J. A., et al.: GAUSSIAN 03, Revision A.1, Gaussian, Inc., Pittsburgh, PA, 2003.<br />
[2] Koskinen, P., Mäkinen, V.: Computational Materials Science, 47 (2009), 237–253.<br />
[3] Hansch, C., Leo, A., Taft, R.W.: Chem. Rev. 91 (1991), 165–195.<br />
[4] Bordwell, F. G., Zhang, X.-M., Cheng, J.-P.: J. Org. Chem. 58 (1993), 6410–6416.<br />
296
XI. Workshop of Physical Chemists and Electrochemists ´11 Brno<br />
SOFTWARE FOR PROCESSING OF<br />
CATALYTIC METALLOTHIONEIN SIGNALS<br />
Martin VALLA 1 , Martin KLIMEK 1 , Jiří DVOŘÁČEK 1 , Ivo PROVAZNÍK 1 , Petr<br />
MAJZLÍK 2 , René KIZEK 2<br />
1 Department of Biomedical Engineering, Faculty of Electrical Engineering and Communication, Brno<br />
University of Technology,<br />
2 Department of Chemistry and Biochemistry, Faculty of Agronomy, Mendel University in Brno, Brno,<br />
Czech Republic<br />
e-mail: martin.valla@phd.feec.vutbr.cz<br />
Abstract<br />
The goal of this topic deal with processing and analysis catalytic metalothionein<br />
signals. In the analysis is used Fourier transform for noise filtering and cyclic loop for<br />
detect peaks on the signal. Results are displaying in user friendly graphic interface.<br />
1. INTRODUCTION<br />
Electrochemical analysis of proteins and nucleic acids is at the beginning of 21 st<br />
century actual and may broaden our knowledge or may be used in routine diagnostics<br />
[1,2]. More than eighty years ago, catalytic signals of proteins in ammonium medium<br />
with presence of cobalt ions were described. Free sulfhydryl groups of proteins are<br />
responsible for these catalytic signals [3,4] . Even if principle of this catalytic reaction<br />
is still unknown, this way of electrochemical analysis is very suitable for proteins with<br />
high content of –SH groups [5]. Thermostabile metallothionein is one of these<br />
proteins [6,7]. Metallothionein (MT) is a small protein [8] of which primary function<br />
is in keeping of metals homoeostasis in living organisms.<br />
Synthesis of human metallothionein may be induced by increasing metals<br />
concentrations. Researches associate significant relation of MT concentration with<br />
carcinogenesis, spontaneous mutagenesis, and participation in mechanisms of action<br />
of anti-tumour drugs and pharmaceutical products [9-11]. Overexpression of<br />
metallothionein is under investigation as a new prognostic marker in many types of<br />
malignant tumours [12,13]. The main aim of this paper is processing of<br />
electrochemical catalytical signals of metallothionein.<br />
2. METHODS AND EXPERIMENT<br />
For operation with measured data, it is necessary to adjust these data using<br />
suitable mathematical method. Pre-treatment of these data concludes elimination of<br />
undesirable components of signal (noise). In the case of repeated measurement of one<br />
sample, its ergodicity can be used. First, noise filtering was performed by averaging.<br />
Then, noise suppression was done in frequency domain. After application of discrete<br />
Fourier transform, selected Fourier coefficients were zeroed and filtered signal was<br />
restored by inverse discrete Fourier transform. Sampling period of the measured<br />
signals was 2mV, then sampling "frequency" fs=1/0.002=500 V -1 . Cut-off frequency of<br />
297
XI. Workshhop<br />
of Physical l Chemists and Electrochemists<br />
E<br />
s ´11<br />
the used<br />
filter wass<br />
25 V<br />
simple method of<br />
appliedd<br />
repeatedly<br />
following<br />
sample<br />
allowedd.<br />
AAnalyzing<br />
s<br />
versionn<br />
R2009b. A<br />
this appplication<br />
al<br />
at the ssame<br />
time<br />
calculattion<br />
of cali<br />
of leveel<br />
threshol<br />
buttonss<br />
for reset a<br />
ROI, chhanging<br />
th<br />
types oof<br />
filters, ba<br />
signals to main fig<br />
of nummber<br />
measur<br />
-1 (0.0 05 fs). Indivvidual<br />
peak ks within signals<br />
were detected using u<br />
f compariso on three nneighborgin<br />
ng signal sa amples. Thhe<br />
method was<br />
y sample-b by-sample while a sa ample with h one preceeding<br />
and one<br />
of lower value wass<br />
searched.<br />
Multiple peaks in a signal were w<br />
software was w developped<br />
in MA ATrix LABo oratory callled<br />
MATL LAB,<br />
Application n has graphic<br />
user inte erface called<br />
GUI. Bassic<br />
function ns of<br />
llows loadin ng of RAWW<br />
data, and plot every particular measuring and<br />
means ove er all measuuring<br />
chan nnels. Abou ut -1,5V, peeak<br />
is used d for<br />
bration line.<br />
Extendedd<br />
function of this inte erface consiists<br />
in prop perty<br />
d and automatic<br />
dettection<br />
aft ter comput ting. Theree<br />
are specially<br />
and plottin ng (Fig. 1) bbellow.<br />
Nex xt option is s zoom regiion<br />
of inter rests<br />
reshold det tection, ploot<br />
actual fil le path for work, chooosing<br />
diffe erent<br />
aseline dete ection withh<br />
options ch hanging ran nge of proccessing,<br />
plo ot all<br />
gure, manu ual recall wwrong<br />
signa al from dataset,<br />
dynammical<br />
detec ction<br />
ring (maxim mum 9) andd<br />
button for r ending pr rogramme.<br />
Fig 1. AAnalyzing<br />
software fo or signals oof<br />
metalloth hionein wi ith graphicc<br />
user inter rface<br />
GUI develooped<br />
in env vironment oof<br />
MATrix LABorator ry MATLABB.<br />
3. RRESULTS<br />
AND DIS SCUSSIONN<br />
Inn<br />
additionn,<br />
we ac ccentuated automatiz zation of detectionn<br />
because of<br />
approxiimation<br />
of this metho od to needss<br />
of clinica al practice to t rapid annd<br />
standard dized<br />
laboratoory<br />
examinnation<br />
met thods. For this purpo ose, we use ed in middl dle Europe rare<br />
equipmment<br />
arranggement,<br />
which w enablles<br />
this ex xamination at low coonsumption<br />
n of<br />
biologiccal<br />
materiaal.<br />
Current t responsess<br />
are result ts of electr rochemical analysis using<br />
u<br />
298<br />
Brno
XI. Workshop of Physical Chemists and Electrochemists ´11 Brno<br />
Brdicka reaction. Principle of this reaction is very difficult and its character is<br />
partially of catalytic origin. In obtained signals, following phenomenons are described<br />
(without protein presence): at potential of -0.25 V, cobalt(III) ions are reduced to<br />
cobalt(II) ions and at potential of -1.1 V, cobalt(II) ions are reduced to cobalt. In<br />
presence of proteins, dramatic changes are well evident. Signal of reduction of<br />
cobalt(II) ions is significantly reduced and at potential of -1 V, signal of originating<br />
complex of cobalt with–SH groups (RS2Co) appears. After signal of this complex, in<br />
dependence on concentration and amount of free –SH groups, catalytic signals Cat 1<br />
at potential about -1.25 V, Cat 2 at potential of -1.35 V, and Cat 3 at potential about -<br />
1.45 V appear. In addition, at very negative potential (about -1.7 V), catalytic signal<br />
marked as H peak appears. From our experimental results, it is well evident that Cat2<br />
signal is directly proportional to level of MT in sample. Individual maxima of signals<br />
were characterized by their position (potential) and height (current). This method<br />
simplified evaluation of very complicated electrochemical records. As the registered<br />
signals are noise-free with well recognizable peaks, reliability of the peak detector was<br />
high.<br />
4. CONCLUSION<br />
Precise and rapid evaluation of biological signals enables enhance of efficiency<br />
of bioanalytical analysis and above all leads to reduction of random mistakes caused<br />
by human factor. For MT detection, we used in clinical practice uncommon<br />
electrochemical methods, which demonstrate high sensitivity, selectivity, and low<br />
costs. Software for processing is used on MEDELU university.<br />
5. ACKNOWLEDGEMENT<br />
This work was supported from: GAČR 301/09/P436, GAČR 102/07/1473 GAČR<br />
102/08/H083, IGAMZ10200-3, GA AV IAA401990701, GA AV KAN208130801 and<br />
MSM0021630513.<br />
6. REFERENCES<br />
[1] J. Petrlova, D. Potesil, R. Mikelova, O. Blastik, V. Adam, L. Trnkova, F. Jelen, R. Prusa, J.<br />
Kukacka and R. Kizek Attomole voltammetric determination of metallothionein, Electrochimica<br />
Acta 51 (2006) 5112-5119.<br />
[2] I. Fabrik, J. Kukacka, V. Adam, R. Prusa, T. Eckschlager and R. Kizek Metallothionein and its<br />
relation to anticancer treatment by platinum complexes, Prakticky Lekar 88 (2008) 90-93.<br />
[3] S. Krizkova, V. Adam, T. Eckschlager and R. Kizek Using of chicken antibodies for<br />
metallothionein detection in human blood serum and cadmium-treated tumour cell lines after<br />
dot- and electroblotting, Electrophoresis 30 (2009) 3726-3735.<br />
[4] S. Krizkova, V. Adam and R. Kizek Study of metallothionein oxidation by using of chip CE,<br />
Electrophoresis 30 (2009) 4029-4033.<br />
[5] V. Adam, O. Blastik, S. Krizkova, P. Lubal, J. Kukacka, R. Prusa and R. Kizek Application of the<br />
Brdicka reaction in determination of metallothionein in patients with tumours, Chemicke Listy<br />
102 (2008) 51-58.<br />
[6] M. Beklova, I. Fabrik, P. Sobrova, V. Adam, J. Pikula and R. Kizek Electrochemical<br />
determination of metallothionein in the domestic fowl, Natura Croatica 17 (2008) 283-292.<br />
299
XI. Workshop of Physical Chemists and Electrochemists ´11 Brno<br />
[7] O. Blastik, J. Hubalek, V. Adam, J. Prasek, M. Beklova, C. Singer, B. Sures, L. Trnkova, J.<br />
Zehnalek and R. Kizek Electrochemical sensor for determination of metallothionein as<br />
biomarker, Proceedings of IEEE Sensors, Daegu, 2006, pp. 1171-1174.<br />
[8] T. Eckschlager, V. Adam, J. Hrabeta, K. Figova and R. Kizek Metallothioneins and cancer,<br />
Current Protein and Peptide Science 10 (2009) 360-375.<br />
[9] I. Fabrik, S. Krizkova, D. Huska, V. Adam, J. Hubalek, L. Trnkova, T. Eckschlager, J. Kukacka, R.<br />
Prusa and R. Kizek Employment of electrochemical techniques for metallothionein<br />
determination in tumor cell lines and patients with a tumor disease, Electroanalysis 20 (2008)<br />
1521-1532.<br />
[10] I. Fabrik, J. Kukacka, J. Baloun, I. Sotornik, V. Adam, R. Prusa, D. Vajtr, P. Babula and R. Kizek<br />
Electrochemical investigation of strontium - metallothionein interactions - analysis of serum and<br />
urine of patients with osteoporosis, Electroanalysis 21 (2009) 650-656.<br />
[11] S. Krizkova, P. Blahova, J. Nakielna, I. Fabrik, V. Adam, T. Eckschlager, M. Beklova, Z.<br />
Svobodova, V. Horak and R. Kizek Comparison of metallothionein detection by using Brdicka<br />
reaction and enzyme-linked immunosorbent assay employing chicken yolk antibodies,<br />
Electroanalysis 21 (2009) 2575-2583.<br />
[12] S. Krizkova, I. Fabrik, V. Adam, J. Hrabeta, T. Eckschlager and R. Kizek Metallothionein - a<br />
promising tool for cancer diagnostics, Bratislava Medical Journal 110 (2009) 93-97.<br />
[13] J. Petrlova, O. Blastik, R. Prusa, J. Kukacka, R. Mikelova, M. Stiborova, B. Vojtesek, V. Adam, O.<br />
Zitka, T. Eckschlager and R. Kizek Determination of metallothionein content in patients with<br />
breast cancer, colon cancer, and malignant melanoma, Klinicka Onkologie 19 (2006) 138-142.<br />
300
XI. Workshop of Physical Chemists and Electrochemists ´11 Brno<br />
MATERIALS FOR ORGANIC ELECTRONICS<br />
Martin VALA 1 , Martin WEITER 1<br />
1 Brno University of Technology, Faculty of Chemistry, Purkyňova 464/118, Brno 61200, Czech<br />
Republic<br />
Abstract<br />
Model materials for organic electronics were modified in order to alter their electron<br />
properties. Diketo-pyrrolo-pyrroles substituted with electron donating groups showed<br />
bathochromic and hyperchromic shift, giving a good chance to be used in solar cell<br />
applications. Derivatives with larger Stokes shift obtained by N-alkylation were used<br />
in OLED applications. We were able to achieve good charge balance that led to a low<br />
turn-on voltage.<br />
1. INTRODUCTION<br />
The material basis for organic electronics is very broad. It covers low molecular<br />
weight structures, polymers, nanoparticles, biomolecules etc. The common feature is<br />
the possibility to modify their properties via chemical synthesis and therefore to<br />
prepare virtually unlimited number of modifications with precisely tuned properties.<br />
It becomes to be common practise to design molecules and predict their<br />
characteristics prior to the synthesis utilising quantum chemical modelling. We used<br />
this goal-targeted approach to modify diketo-pyrrolo-pyrroles (DPP), Figure 1, to<br />
prepare derivatives for organic electronics, namely for solar cells (SC), light emitting<br />
diodes (OLEDS), and field effect transistors (FET).<br />
The DPPs as high-performance pigments have attracted researches and<br />
companies also from the field of organic electronics because of their exceptional<br />
stability, good scalability of the chemical synthesis, and other properties such as high<br />
absorption coefficients, fluorescence quantum yields etc. In this contribution we<br />
present general strategies involved to tune the electron properties of this class of<br />
materials. The impacts on relevant parameters important in organic electronics are<br />
discussed rather than the chemical synthetic procedures.<br />
2. EXPERIMENT<br />
The devices were prepared in the form of thin films by either spin coating or<br />
vacuum deposition techniques. The electrical devices use indium tin oxide (ITO) as<br />
transparent electrode and Al as the counter electrode. The organic layers were<br />
sandwiched in between.<br />
To characterise the materials we used various electrical methods (currentvoltage<br />
characteristics, admittance spectroscopy), optoelectrical methods<br />
(electroluminescence measurement, steady state and time resolved photoconductivity<br />
measurement) and optical characterization (absorption and steady state and time<br />
resolved photoluminescence spectroscopy).<br />
301
XI. Workshop of Physical Chemists and Electrochemists ´11 Brno<br />
3. RESULTS AND DISCUSSION<br />
To alter the electronic properties mainly groups with electron donating or<br />
withdrawing ability are employed. Introduction of polar substituents into organic<br />
chromophores causes a redistribution of electronic density in both the ground state<br />
and the excited state, which can strongly modify their absorption and fluorescence<br />
properties [1]. The important parameters such as positions of the electron and/or hole<br />
transport levels, the absorption coefficients and fluorescence quantum yields, etc. are<br />
modified. Furthermore, the push–pull substituted organic compounds are at the<br />
centre of interest of physicists, because they can produce strong second-order<br />
nonlinear optical effects 0.<br />
The effects of electron-donor (piperidino) and electron-acceptor (cyano) groups<br />
on the electronic spectra were investigated both, experimentally and theoretically. It<br />
was found, that in general, cyano group stabilizes both phenyl molecular orbitals,<br />
while piperidino group destabilizes them (and even to a greater extent). An electrondonor<br />
substituent increases the electron density on the phenyl group to which it is<br />
attached, and on acceptor C=O group of the second pyrrolinone ring in HOMO, while<br />
in LUMO further CT is observed to the opposite phenyl group. This indicates the<br />
electron-acceptor character of the whole central dipyrrolinone mainly localized on<br />
keto groups.<br />
The absorption spectra show poor resolution of vibronic structure in the case of<br />
unsymmetrically piperidino substituted and push-pull piperidino–cynao substituted<br />
compounds. We ascribed this to the significantly higher dipole moment interacting<br />
with the polar solvent (dimethylsulfoxide) by dipole–dipole interaction.<br />
The fluorescence spectra of DPPs usually show small Stokes shifts, which are<br />
significantly increased by N-substitution (e.g. alkylation) inducing higher degree of<br />
nonplanarity [3]. Thus the N-substituted derivatives are promising with respect to<br />
applications like OLED, laser, etc. The Stokes shift between 0-0 vibronic bands in<br />
absorption and fluorescence spectra is higher for all derivatives with electon donating<br />
or withdrawing substituents than that for parent compound. Its significant increase is<br />
observed the asymmetrically piperidino substituted (47 nm) and push-pull piperidino–<br />
cynao substituted (78 nm), as a result of much stronger excited state solvent<br />
(dimethylsulfoxide) relaxation of these polar compounds. The dipolar character of<br />
these compounds gives them also some chance to produce second-order nonlinear<br />
optical phenomena. This behaviour has been already confirmed using two photon<br />
excited fluorescence.<br />
Introduction of electron-donating groups increased the molar absorption<br />
coefficient and was accompanied with strong bathochromic shift. This behaviour<br />
implies that charge separation occurs via electron delocalization leading to creation of<br />
permanent dipole moment. Blurring of vibration structure in absorption spectra of<br />
302
XI. Workshop of Physical Chemists and Electrochemists ´11 Brno<br />
mono substituted derivatives imply interaction with polar dimethylsulfoxide (DMSO)<br />
and shows polar character of the substituted.<br />
Introduction of the N-alkylation led to the decrease of the and hypsochromic<br />
shift. First N-alkylation causes only small change, whereas second alkylation lead to<br />
the value of almost similar to the parent, non N-substituted, DPP. This decrease is<br />
accompanied by the hypsochromic shift and loss of vibrational structure. We<br />
proposed the same mechanism as for the N-alkylated only derivatives: the Nalkylation<br />
causes rotation of the phenyls and consequently breaks the molecule<br />
symmetry, and hence, the effective conjugation and increases the polarity.<br />
On the basis of the findings described above symmetrically N-alkylated<br />
derivatives resulted as suitable for electroluminescence characterization. The prepared<br />
organic diode from the phenyl di-piperidino substituted N,N-alkylated DPP showed<br />
that the turn-on voltage for this diode is ~3V. At this voltage the previously ohmic<br />
nature of the I-V characteristic changes to the space-charge-limited, where the<br />
current flow is bulk-limited. The low value of the turn-on voltage implies that<br />
reasonable charge balancing was achieved due to the barrier reducing pre-contact<br />
layers (PEDOT:PSS and Alq3). This allowed us to measure also the spectrally resolved<br />
electroluminescence of several selected derivatives.<br />
R 1<br />
<br />
R 4<br />
N<br />
O<br />
<br />
Fig.1 General formula of the basic diketo-pyrrolo-pyrrole used as parent molecule in<br />
this study. Substitution on nitrogens (R1 and R2) referred as N-alkylation was<br />
used to alter solubility. Substitution on phenyls (R3 and R4) were used to<br />
introduce electron donating or withdrawing groups, and therefore, to<br />
influence the electron spectra.<br />
4. CONCLUSION<br />
In this contribution, we showed the influence of various chemical modifications<br />
of basic structure on the electron properties of organic molecules. The diketo-pyrrolopyrroles<br />
served only as a model class of materials suitable for production of organicbased<br />
electronic devices. Derivatives suitable for solar cell applications were obtained<br />
303<br />
O<br />
N<br />
R 3<br />
R 2
XI. Workshop of Physical Chemists and Electrochemists ´11 Brno<br />
by substitution with electron withdrawing groups. Derivatives for OLED applications<br />
were obtained using N-alkylation leading to the higher Stokes shift.<br />
5. ACKNOWLEDGEMENT<br />
The work has been supported by MŠMT (OP VaVpI) via project Centres for<br />
materials research at FCH BUT No. CZ.1.05/2.1.00/01.0012.<br />
6. REFERENCES<br />
[1] Griffiths, J.: Colour and constitution of organic molecules. 1976 London: Academic Press<br />
[2] Marder, S.R.: Chemical Communications (2006), 2, 131.<br />
[3] Vala, M., Weiter, M., Vyňuchal, J., Toman, P., Luňák, S.: Journal of Fluorescence. (2008), 18(6),<br />
1181.<br />
304
XI. Workshop of Physical Chemists and Electrochemists ´11 Brno<br />
DEVELOPMENT OF OPTICAL SENSORS<br />
BASED ON COMPLEXES OF<br />
MACROCYCLIC COMPOUNDS<br />
Jakub VANĚK 1 , Přemysl LUBAL 1<br />
1 Department of Chemistry, Faculty of Science, Masaryk University, Brno<br />
Abstract<br />
The Ln(DO3A) structural motif was utilized for proposal of sensitive fluorosensor for<br />
determination of hydrogencarbonates. The thermodynamic study of Eu(DO3A)<br />
complex with bidentate ligands using luminescence spectroscopy demonstrate the<br />
order: CO3 2- > oxalate 2- > picolinate - > phthalate 2- citrate 3- as consequence of<br />
increasing chelate ring size. The ternary [EuL(Picolinate)] - and [TbL(Picolinate)] -<br />
complexes show good photophysical properties due to antenna effect. The high<br />
quenching effect of carbonate and less of oxalate enables to construct linear<br />
calibration plot under optimized experimental conditions (e.g. concentration of<br />
reagents, pH, wavelength, etc.). The Tb(III) sensor shows better sensitivity while the<br />
limit of detection about 0.4 mM was found for both sensors. In addition, the analysis<br />
of real samples shows no systematic error of proposed analytical procedure and the<br />
results are comparable with values giving by CITP.<br />
1. INTRODUCTION<br />
The lanthanide complexes of macrocyclic ligands (mostly DOTA derivatives) are<br />
often used as MRI agents (Gd), luminescent probes (Eu, Tb in VIS, Yb, Nd in NIR<br />
range) or for radioimunotherapy (Y, Sm, Ho, Lu). DO2A (1,4,7,10tetraazacyclododecane-1,7-diacetate)<br />
and DO3A (1,4,7,10-tetraazacyclododecane-<br />
1,4,7-triacetate) are hexa- and heptadentate macrocyclic ligands capable of formation<br />
very stable complex with europium(III) ion 1-3 . Both complexes are able to form<br />
ternary lanthanide(III) species with mono- and bidentate ligands (DO2A-fluoride,<br />
acetate, hydrogenphosphate, DO3A-hydrogenphosphate, hydrogencarbonate) 1-3 .<br />
Different stability of these ternary complex systems can be used as a sensor for<br />
selective determination of different anions. The use of chromophore, such as picolinic<br />
acid and its analogues, capable of forming ternary complex [Fig.1] with lanthanide(III)<br />
macrocyclic complexes leads to fluorescence enhancement due to antenna-effect and<br />
the determination itself can be more sensitive. The ternary complex with picolinic<br />
acid is less stabile than the ternary complex of analyzed anion and this leads to<br />
fluorescence decrease which can be used for sensitive determination. This<br />
contribution enlarges the study of the formation of ternary complex europium(III)<br />
species with important bioanalytes (e.g. hydrogencarbonate, oxalate, citrate, etc.) by<br />
means of molecular luminescence spectroscopy. The results are used for proposal of<br />
selective anion sensor.<br />
305
XI. Workshop of Physical Chemists and Electrochemists ´11 Brno<br />
N<br />
O - H<br />
O -<br />
O O -<br />
N N<br />
Eu<br />
N N<br />
3+<br />
O H VIS rad<br />
2<br />
H2O Fig.1 Ternary Eu(DO3A)(picolinate) complex<br />
O<br />
2. EXPERIMENT<br />
All luminescent spectra including were recorded on spectrofluorimeter<br />
Aminco-Bowman Series 2 (Thermo-Spectronic, USA) – operating with continuous<br />
and flash Xe lamp in wavelength range 200 - 800nm. The compounds were purchased<br />
from SIGMA-ALDRICH (all of analytical grade) and used as received.<br />
3. RESULTS AND DISCUSSION<br />
We have focused on study of formation of ternary species with bidentate<br />
ligands having potential analytical application. The thermodynamic study of<br />
formation of ternary Eu(III) species was followed by fluorescence spectroscopy. As it<br />
can be seen on example (Fig. 2), the formation of ternary Eu(III) complex is<br />
accompanied by increase of fluorescence intensity since two water molecules are<br />
excluded from the first coordination shell after bidentate ligand complexation 4-5 .<br />
Antenna effect of picolinate can be utilized for higher luminescence enhancement.<br />
The radiation of wavelength at maximum of absorption band of picolinate, 286<br />
nm, improved the luminescence of ternary complex to factor 170 (Fig. 2) however the<br />
quenching effect of ligand on formed complex is observed at higher picolinate<br />
concentration.<br />
O -<br />
306<br />
O<br />
UV rad<br />
O
XI. Workshop of Physical Chemists and Electrochemists ´11 Brno<br />
I f (a.u.)<br />
300<br />
200<br />
100<br />
I f (a.u.)<br />
400<br />
300<br />
200<br />
100<br />
0.0 2.0x10 -3<br />
4.0x10 -3<br />
6.0x10 -3<br />
8.0x10 -3<br />
1.0x10 -2<br />
0<br />
c picolinate / M<br />
0<br />
580 600 620 640<br />
Wavelength / nm<br />
Fig. 2 The emission spectra of EuL complex after addition of picolinic acid (cEuL = 0.1<br />
mM, pH = 7.4, exc = 286 nm). In offset there is plot of luminescence intensity<br />
of Eu(III) complex at 616 nm as function of picolinic acid.<br />
Adding hydrogencarbonate in solution, the new ternary [EuL(Carb)] 2- complex<br />
is formed which does not show excellent luminescence properties as [EuL(Pic)] -<br />
complex and therefore it should be accompanied by decrease of luminescence in<br />
concentration region from 10 -4 M to 10 -2 M at pH 7.4. Increasing pH to 10.0, the<br />
substitution reaction is taking place in lower concentration region.<br />
4. CONCLUSION<br />
Eu(DO3A) complex forms stabile complex having longer luminiscence life-time<br />
as the consequence of two coordinated water molecules eliminated from Eu(III)<br />
coordination sphere. Ternary complexes with bidentate ligands and their stability<br />
follows the order: CO3 2- > oxalate 2- > picolinate - > phthalate 2- citrate 3- .<br />
This order is reflected by the size of chelate ring and acidobasic properties of<br />
ligand. The ternary complex Eu(DO3A)(picolinate) or Tb(DO3A)(picolinate) can be<br />
applied for sensitive analytical determination of carbonate (hydrogencarbonate) and<br />
oxalate in mM scale in alkaline pH under optimal experimental conditions (cEuL = 0.1<br />
mM, cpicolinate = 5.0 mM) in presence of other anions (phosphate, citrate) which are not<br />
interfering.<br />
5. ACKNOWLEDGEMENT<br />
This work was supported by Ministry of Education of the Czech Republic<br />
(ME09065, LC06035, MUNI/A/0992/2009) and performed in framework of COST D38<br />
EU program.<br />
307
XI. Workshop of Physical Chemists and Electrochemists ´11 Brno<br />
6. REFERENCES<br />
[1] Wu S.-Li, DeW. Horrocks W., Anal. Chem. (1996), 68, 394.<br />
[2] Kimpe K., D’Olieslager W., Görller-Wahrland C., Figurienha A., Kovács Z., C.F.G.C. Geraldes, J.<br />
Alloys Comp. (2001), 323-324, 828<br />
[3] Supkowski R., DeW. Horrocks W., Inorg. Chem. (1999), 38, 5616<br />
[4] Táborský P., Svobodová I., Hnatejko Z., Lubal P., Lis S., Försterová M., Hermann P., Lukeš I., Havel<br />
J., J. Fluorescence (2005) 15, 507.<br />
[5] Táborský P., Svobodová I., Lubal P., Hnatejko Z., Lis S., Hermann P., Polyhedron (2007), 26, 4119.<br />
308
XI. Workshop of Physical Chemists and Electrochemists ´11 Brno<br />
MONITORING DNA MODIFICATION BY<br />
PLATINUM COMPLEXES USING<br />
CATALYTIC HYDROGEN EVOLUTION AT<br />
MERCURY ELECTRODES<br />
Pavlína VIDLÁKOVÁ 1 , Petra HORÁKOVÁ 1 , Hana PIVOŇKOVÁ 1 , Luděk HAVRAN 1 ,<br />
Miroslav FOJTA 1<br />
1 Pavlína Vidláková, Petra Horáková, Hana Pivoňková, Luděk Havran, Miroslav Fojta Institute of<br />
Biophysics ASCR,v.v.i., Královopolská 135, CZ-612 65 Brno, Czech Republic<br />
Abstract<br />
The voltammetry at the HMDE was used for the monitoring of DNA modification<br />
with cis-diamminedichloroplatinum (cisplatin), [(1R,2R)-cyclohexane-1,2diamine](ethanedioato-O,O')platinum(II)<br />
(oxaliplatin) and cisdiammine(cyclobutane-1,1-dicarboxylate-O,O')platinum(II)<br />
(carboplatin). These<br />
complexes binds covalently to DNA, forming several kinds of adducts. Using cyclic<br />
voltametry at HMDE was observed remarkable enhancement of cathodic currents in<br />
the presence of platinated DNA. These effects have been ascribed to catalytic<br />
hydrogen evolution accompanying electrochemical reduction of the platinated DNA<br />
adducts. In square-wave voltammetry the catalytic currents gave rise to well<br />
developed and analytically useful peak. This signal was used for monitoring of DNA<br />
modification.<br />
1. INTRODUCTION<br />
Electroanalytical methods are used for analysis of natural as well as chemically<br />
modified nucleic acids since the second half of 50s years of 20th century [1,2]. In<br />
cyclic voltammetry at mercury electrodes adenine and cytosine produce a cathodic<br />
peak CA, guanine produce an anodic peak G (due to oxidation of reduction product of<br />
guanine that is reduced at very negative potentials) [2]. When the DNA is chemically<br />
modified, its electrochemical responses can be changed. In some cases, attachment of<br />
a new electrochemically active group to DNA can give rise to a new signal which can<br />
be used for monitoring of DNA modification.<br />
Cisplatin, oxaliplatin and carboplatin are used as cytotoxic and antineoplastic<br />
metallodrugs by treatment of various malignancies [3]. The drugs binds covalently to<br />
DNA, forming several kinds of adducts, where the primary site the DNA modification<br />
is guanine. The most frequent of them being intrastrand cross-links in sequence<br />
motifs GG, AG and GNG (where N stands for any nucleotide). Previously we proposed<br />
a simple electrochemical technique for the monitoring of DNA modification with<br />
cisplatin [4]. Here, application of the technique is extended towards analysis of DNA<br />
modification with other platinum complexes.<br />
309
XI. Workshop of Physical Chemists and Electrochemists ´11 Brno<br />
2. EXPERIMENTAL<br />
DNA (usually single strand calf thymus DNA) was incubated with cisplatin<br />
(oxaliplatin, carboplatin) in 0.1 M NaClO4 at 37 °C overnight in the dark. DNA<br />
concentration in the reaction mixture was 20 g.ml -1 . Concentracion of platinum<br />
complexes complied with rb values (rb is the number of platinum atoms bound per<br />
DNA nucleotide). Platinated DNA was purified using magnetoseparation procedure.<br />
Voltammetric responses of the modified DNA were measured using the adsorptive<br />
transfer stripping (AdTS) procedure at HMDE. All measurements were performed at<br />
room temperature with an Autolab analyzer connected to VA-Stand 663 in threeelectrode<br />
setup (Ag/AgCl/3 M KCl electrode as a reference and platinum wire as an<br />
auxiliary electrode), under argon.<br />
3. RESULTS AND DISCUSSION<br />
We used CV at HMDE for analysis of unmodified and platinated DNA (Fig.1).<br />
The unmodified DNA yielded two signals - catodic peak CA at -1.51 V and anodic<br />
peak G at -0.25 V. In the cathodic part of voltammogram of DNA modified by<br />
cisplatin, the negative current started to increase sharply around -1.2 V and reached<br />
its maximum at -1.75 V, forming a wide peak. In the anodic part of the<br />
voltammogram were three waves (around -1.75, -1.45 and -1.3 V), and between -1.53<br />
and -1.18 V it was going through higher negative current values than the cathodic<br />
part in the same region. Such behavior suggested a kinetic process coupled to<br />
reversible electron transfer reactions, most likely catalytic hydrogen evolution<br />
accompanying redox processes of the platinum moieties. Peak G produced by the<br />
cisplatinated DNA was lower than the same signal produced by the unmodified DNA<br />
and was shifted to more negative potentials.<br />
In square wave voltammograms of DNA modified by cisplatin, oxaliplatin or<br />
carboplatin we observed two signals, peak G at -0.26 V (corresponding to signal of<br />
guanine moieties) and peak P at -1.25 V (characteristic for the platinum-DNA adduct)<br />
(Fig. 2). Intensity of this signal increased linearly up to rb=0.12 within the region<br />
relevant for the biochemical studies. Differences in the intensity of the peak P for<br />
DNAs modified with various complexes under the same conditions, suggesting<br />
different feasibilities of the adducts formation.<br />
310
XI. Workshop of Physical Chemists and Electrochemists ´11 Brno<br />
I/A<br />
0<br />
-10<br />
-20<br />
-30<br />
-40<br />
-50<br />
-60<br />
I/mA<br />
0.36<br />
0.18<br />
0.00<br />
-0.18<br />
-0.36<br />
G<br />
-0.40 -0.32 -0.24 -0.16<br />
311<br />
E/V<br />
DNA + cisplatin (rb 1)<br />
unmodified DNA<br />
-2.0 -1.5 -1.0 -0.5 0.0<br />
Fig. 1 CV of DNA modified by cisplatin: background electrolyte 0.3 M ammonium<br />
formate, 0.05 M sodium phosphate, pH 6.9 (AFP), initial potential 0.0 V,<br />
switching potential -1.85 V, scan rate 1 Vs -1<br />
I/A<br />
0.98<br />
0.84<br />
0.70<br />
0.56<br />
0.42<br />
0.28<br />
0.14<br />
0.00<br />
P<br />
P<br />
E/V<br />
DNA + oxaliplatin (rb 0.1)<br />
DNA + carboplatin (rb 0.1)<br />
unmodified DNA<br />
DNA + cisplatin (rb 0.1)<br />
-1.5 -1.0 -0.5 0.0<br />
E/V<br />
Fig. 2 AdTS SWV of DNA modified by platinum complexes: background electrolyte<br />
AFP, initial potential -1.85 V, end potential 0.0 V, frequency 200 Hz,<br />
amplitude 50 mV, potential step 5 mV<br />
4. CONCLUSION<br />
Using square-wave voltammetry at HMDE the catalytic currents gave rise to<br />
well developed and analytically useful catalytic peak (peak P). Intensity of this peak<br />
responded to the extent of DNA modification at levels relevant for biochemical<br />
studies (rb=0.01 – 0.10, where rb is the number of platinum atoms bound per DNA<br />
nucleotide). We show that intensity of the peak P reflects different reactivity of<br />
individual platinum complexes towards the DNA.<br />
5. ACKNOWLEDGEMENT<br />
This work was supported by grants of the GA ASCR (IAA400040903,<br />
IAA500040701), Czech Science Foundation (P206/11/1638), MEYS CR (LC06035) and<br />
institutional research plans Nos. AV0Z50040507 and AV0Z50040702.<br />
G
XI. Workshop of Physical Chemists and Electrochemists ´11 Brno<br />
6. REFERENCES<br />
[1] Palecek, E., Jelen, F: In Electrochemistry of nucleic acids and proteins Towards electrochemical<br />
sensors for genomics and proteomics Palecek, E., Scheller, F., Wang, J., Elsevier, 2005,<br />
Amsterodam<br />
[2] Fojta, M: Collect Czech. Chem. Commun. (2004), 69, 715<br />
[3] Kasparkova, J., Fojta, M., Farrell, N., Brabec, V.: Nucleic Acids Res. (2004), 32, 5546<br />
[4] Horakova, P., Tesnohlidkova, L., Havran, L., Vidlakova, P., Pivonkova, H., Fojta, M.: Anal.<br />
Chem. (2010), 82, 2969.<br />
312
XI. Workshop of Physical Chemists and Electrochemists ´11 Brno<br />
SYNTHESIS AND CHARACTERIZATION OF<br />
NANOPARTICLES OF SN-3,5AG-0,5ZN<br />
Vít VYKOUKAL 1 , Klára SUCHÁNKOVÁ 1 , David ŠKODA 1 , Jíří SOPOUŠEK 1<br />
1 Department of Chemistry, Faculty of Science, Masaryk University, Brno<br />
Abstract<br />
Sn-3,5Ag-0,5Zn alloy nanoparticles were synthesized from NaBH4,<br />
Polyvinylpyrrolidone, SnSO4, AgNO3, Zn(NO3)2 precursors by using chemical<br />
reduction wet synthese at 50°C ubder pernament 12 h stirring. Transmission electron<br />
microscopy (TEM) was used to investigate the size and shape of the nanoparticle alloy<br />
product. TEM observation revealed that smaller aggregations were formed from small<br />
primary nanoparticles with size varied from 3 to 5 nm. Aggregation of small<br />
nanoparticle was spontaneous. It was found that aggregates with a greater proportion<br />
of nanoparticles are heated by passing of electron beam in TEM in such a way that<br />
nanoparticles melt and subsequently redeposit on carbon membrane.<br />
1. INTRODUCTION<br />
Until recently lead-tin alloys were mostly used for soldering. The advantage of<br />
these alloys is the price, ductility and low surface tension. Considerable disadvantage<br />
is toxicity of lead and its negative effects on the environment. Today's modern and<br />
progressive trend for soldering is using solders without addition of lead. These solder<br />
alloys exhibit eutectic behavior and a sufficient reduction in melting point. However<br />
nanoparticles are considered for using.<br />
Physical, electrical and thermodynamic properties of nanoparticles are different<br />
from the compact particles. The melting point of nanoparticles depends on their size<br />
and can be much lower than the melting point of compact materials. On the other<br />
hand, reduction of the melting point can indicate reduction of nanoparticles size. The<br />
reason for this phenomenon is the higher surface energy. Nanoparticles of metals and<br />
their alloys can easily be aggregated and may interact with other materials<br />
(substrates). This phenomenon is a possible alternative to soldering, which is a<br />
common manufacturing process in electrical engineering.<br />
Preparation of nanoparticles is also possible by chemical synthesis. Well usable<br />
are reduction methods, which are cheap and can provide nanoparticles of metals and<br />
their alloys. Reaction conditions can control the size and the shape of synthesized<br />
nanoparticles. However, the choice of suitable reducing agent is also important.<br />
To characterize the obtained nanoparticles of metals and alloys the methods of<br />
electron microscopy and thermal analysis can also be used. The shape and size<br />
of particles can be detected by the methods of electron microscopy.<br />
By means of transmission electron microscopy (TEM) the size distribution curve<br />
of nanoparticle array and the effect of aggregation processes can be determined.<br />
313
XI. Workshop of Physical Chemists and Electrochemists ´11 Brno<br />
Electron microanalysis of the sample (EDX) we can then determine the composition<br />
of the sample. Thermal analysis – differential thermal analysis (DTA) and differential<br />
scanning calorimetry (DSC) – can be used for monitoring depression of the melting<br />
point, which is given by the difference of melting point of nano-objects and compact<br />
materials of the same chemical composition. Melting point depression is a function of<br />
nanoparticle size.<br />
2. EXPERIMENT<br />
Sn-3,5Ag-0,5Zn alloy nanoparticles were synthesized by precipitation with<br />
2,405 g NaBH4 and 2 g PVP in 200 ml aqueous solutions at 50°C. This solution was<br />
prepared in the first beaker. At first we dissolved the PVP in water. PVP is not well<br />
soluble in water. We adjusted water pH to about 9 and then we added NaBH4. By<br />
increasing of pH we wanted to relieve reaction boisterousness. NaBH4 is releasing<br />
hydrogen in acidic environment and reaction could be very turbulent. In the 2nd<br />
beaker we simultaneously dissolved 0,138 g AgNO3, 3,471 g SnSO4 a 0,030 g<br />
Zn(NO3)2.The salts were dissolving very badly, pH of solution was about 2. Yellow<br />
suspension was formed, which looked like a thick porridge. For better solubility of the<br />
suspension we heated it. From resulted color we concluded that SnSO4 is very badly<br />
soluble. Suspension during heating became darker and the black dots began to<br />
explore. After heating we filtered suspension at atmospheric pressure. The filtrate was<br />
clear, filter paper, beige with black dots. Afterwards we very carefully and dropwise<br />
got together both solutions. We added filtrate to the solution of NaBH4 a PVP. The<br />
solution immediately began to darken. First it was brown, but progressively it was<br />
getting dark until black. A large amount of gas released and formed in the center of<br />
beaker large bubble. During permanent stirring both solutions were mixed at<br />
laboratory temperature. After mixing we started to heat the final solution. We heated<br />
for 12h with permanent stirring.<br />
3. RESULTS AND DISCUSSION<br />
The final product was a suspension containing solid phase containing the<br />
nanoparticles and liquid water phase. Solid phase could be separated by decantation,<br />
like black powder. The obtained solid samples were sent for analysis by TEM. Before<br />
TEM analysis the samples of the suspensions were briefly shaken in the ultrasound<br />
and then deposited onto copper grid with carbon membrane. As follows from the<br />
micrographs the particles form clusters (aggregates). The high degree of aggregation<br />
can be explained by a large part of unoxidized ( metallic) nanoparticle surface by<br />
means of which the nanoparticles reduce their energy. For smaller aggregates we can<br />
conclude that primary size of nanoparticles was 3-5 nm (see Fig. 1-2). Unfortunately<br />
aggregation is not controlled, it is spontaneous. Therefore this process was not<br />
monitored by the thermal analysis.<br />
314
XI. WWorkshop<br />
of Phyysical<br />
Chemists and Electrocheemists<br />
´11<br />
Fig. . 1: Agregattes<br />
of nanop particles (TTEM)<br />
Fig. 2: Detail of o agregatees<br />
of nanop particles<br />
(TEM)<br />
It was ffound<br />
that aggregatess<br />
with a greater g prop portion of nanoparticles<br />
are<br />
heaated<br />
by passsing<br />
of electron<br />
beam in TEM in such a way y that nanooparticles<br />
melt m and<br />
subssequently<br />
rredeposite<br />
(small ( ballss)<br />
on carbon n membran ne. The ball lls are form med with<br />
dimmensions<br />
of 10 nm to 100 1 nm (seee<br />
Fig. 3 to 4). 4 Accordin ng to EDX micro-anal lysis the<br />
Sn wwas<br />
confirmed.<br />
The silver and zinc conte ents were on o the deteection<br />
limit<br />
of the<br />
usedd<br />
micro-annalysis.<br />
Fig. 3: AAgregates<br />
of o nanopartticles<br />
Fig. 4: 4 Detail of rede eponted<br />
nanopaarticles<br />
after r interactioon<br />
with elec ctron beam m TEM. Interraction<br />
electronn<br />
beam TEM M.<br />
with<br />
4. CONCLLUSION<br />
Alloy naanoparticles<br />
s of Sn-3,5AAg-0,5Sn<br />
al lloy with si ize 3-5 nmm<br />
were prep pared by<br />
reduuction<br />
of pprecursors<br />
by wet syynthesis<br />
method. m The e particles showed a simple<br />
aggrregation,<br />
caaused<br />
by a low degreee<br />
of adsorp ption of foreign<br />
materrials<br />
on the surface<br />
of thhe<br />
nanoparrticles.<br />
A hi igh proporttion<br />
of met tallic surface<br />
led to agggregation,<br />
which w is<br />
diffficult<br />
to control.<br />
Inter raction witth<br />
electron n beam cau uses furtherr<br />
instability y of the<br />
nannoparticles.<br />
Agregates with high concentration<br />
of nan noparticles easily capt ture the<br />
energy<br />
of thee<br />
electron beam. Naanoparticle<br />
es melt an nd then leead<br />
to sub bsequent<br />
315<br />
Brno
XI. Workshop of Physical Chemists and Electrochemists ´11 Brno<br />
redeposition on carbon membrane. It was proved that tin is the main component of<br />
redeposited particles.<br />
5. ACKNOWLEDGEMENT<br />
The authors acknowledge the project support through grant GACR 106/09/0700<br />
(Thermodynamics and microstructure of environmentally friendly nanoparticle<br />
solders).<br />
6. REFERENCES<br />
[1] C. Y. Lin, U.S. Mohany, J. H. Chou: Journal of Alloys and Compounds 501 (2010) 204-210<br />
[2] Hongjin Jiang, Kyoung-sik Moon, Fay Hua, and C. P. Wong: Chem. Mater. (2007), 19, 4482-4485<br />
316
XI. Workshop of Physical Chemists and Electrochemists ´11 Brno<br />
ELECTROCHEMICAL DETERMINATION OF<br />
BIOLOGICALLY ACTIVE COMPOUNDS<br />
Jiří ZIMA 1 , Jiří BAREK 1 , Hana DEJMKOVÁ 1<br />
1 Charles University in Prague, Faculty of Science, Department of Analytical Chemistry, UNESCO<br />
Laboratory of Environmental Electrochemistry, Albertov 6, 128 43 Prague, Czech Republic<br />
Abstract<br />
This contribution deals with recent studies based on electrochemical determination of<br />
submicromolar and nanomolar concentrations of various biologically active<br />
compounds including carcinogens, environmental pollutants, or pharmaceuticals<br />
(nitrated polycyclic aromatic hydrocarbons, heterocyclic compounds, azo compounds,<br />
aromatic amino compounds, etc.) employing both traditional electrodes as mercury<br />
electrodes and non-traditional types of electrodes such as solid amalgam electrodes,<br />
carbon paste electrodes, boron doped diamond film electrodes, platinum tubular<br />
electrodes in batch or flow arrangement.<br />
1. INTRODUCTION<br />
Modern electrochemical methods possess high sensitivity and could be utilized<br />
for monitoring purposes of biologically active compounds [1,2]. The strength of<br />
electrochemical methods is in their versatility, possibility to determine substances<br />
which are both reducible and oxidizable. Electrochemical methods are especially<br />
suited for large scale monitoring of chemical carcinogens or environmental pollutants<br />
in matrices of drinking and surface waters, biological fluids matrices or<br />
pharmaceutical products [3,4]. When used in a form of electrochemical detectors in<br />
HPLC or electromigration methods, they could be utilized even for more complicated<br />
environmental matrices where preliminary separation is inevitable for successful<br />
analyte determination. The most important factor influencing the performance of the<br />
method is the type and quality of the electrode material. For determination of<br />
electrochemically reducible organic compounds such as azodyes, aromatic nitroso or<br />
nitro compounds, mercury-based electrodes could be utilized with limits of<br />
determination (LOD) being in the range from 10 -9 to 10 -10 mol/L [5], or their<br />
environmentally friendly alternatives - amalgam based electrodes with LODs down to<br />
10 -7 mol/L, which are also suitable for both batch methods of analysis and for HPLC.<br />
For determination of electrochemically oxidizable organic compounds such as<br />
phenols, thiols or aromatic amines, classical bare or chemically or biologically<br />
modified carbon paste electrodes are well suited with with LOD down to 10 -7 mol/L,<br />
pastes based on glassy carbon spherical microparticles which are compatible with high<br />
content of organic solvents and thus applicable for HPLC [6] with LOD down to 10 -7<br />
mol/L [7]. The main disadvantage of electrochemical methods, which is lower<br />
selectivity, could be overcome by their combination with a suitable preliminary<br />
separation method such as liquid-liquid extraction or solid phase extraction, the<br />
317
XI. Workshop of Physical Chemists and Electrochemists ´11 Brno<br />
passivation of the electrode surface could be eliminated with periodical<br />
electrochemical or mechanical renewal of working surface of the electrode, sensor or<br />
detector [8].<br />
2. 2.EXPERIMENTAL<br />
Studied substances were purchased from Sigma or Merck. Their stock solutions<br />
(usually c = 1 mmol/L) were prepared by dissolving the exact amount of the respective<br />
substance in methanol or water and were kept at a laboratory temperature.<br />
Spectrophotometric measurements were used for checking their stability for<br />
prolonged periods of time. Britton-Robinson (B-R) buffers served as supporting<br />
electrolytes for voltammetric measurements. The same 10 times diluted buffers or<br />
phosphate buffers in mixtures with methanol or acetonitrile of various ratios served as<br />
mobile phases in HPLC or FIA measurements. The details for carbon paste<br />
composition, amalgam electrode composition or other details will be described. Other<br />
used chemicals were of commercial origin and of p.a. or of HPLC purity. Deionized<br />
water was prepared by Millipore system.<br />
Voltammetric batch measurements were performed using Eco-Tribo-<br />
Polarograph, controlled by software Polar Pro 5.1 (both PolaroSensors, Prague, Czech<br />
Republic) and they included cyclic voltammetry (CV), differential pulse voltammetry<br />
(DPV), direct current voltammetry (DCV) and their adsorptive stripping variants in<br />
three electrode arrangement with a chosen working electrode, a platinum wire<br />
auxiliary electrode, and Ag/AgCl (3 M KCl) reference electrode RAE 113<br />
(Monokrystaly Turnov, Czech Republic), to which all the potential values are<br />
referred. The same electrode set was used for electrochemical detection in a flow<br />
arrangement. HPLC measurements were performed using high pressure pump Beta<br />
10, injector valve with 20 L loop, UV/VIS detector Sapphire 800 (all Ecom, Czech<br />
Republic) and amperometric detector ADLC 2 (Laboratorní přístroje, Czech Republic)<br />
if not specified otherwise. The HPLC system was controlled via Clarity 2.3 software<br />
(DataApex, Czech Republic).<br />
3. 3.RESULTS AND DISCUSSION<br />
Electroanalytical chemistry has to deal with the growing requirements and<br />
demands for solving practical tasks in more and more complicated matrices and in<br />
lower and lower concentration ranges. So that new types of electrodes or<br />
arrangements are sought, together with new potential programs and workup of<br />
current signals including preliminary electrochemical pre-treatment of the working<br />
electrode. Preliminary separation and pre-concentration of analytes is helping to<br />
further increase the sensitivity, robust methods deal with the most serious problem of<br />
electrochemistry which is the passivation. Nevertheless, electrochemical methods<br />
could be successfully used for large scale monitoring of electroactive compounds in<br />
the environment as the absence of proper signal is often enough for claiming the<br />
absence of particular analyte of interest, while in positive case more expensive and<br />
demanding separation methods could be used. Electroanalytical methods thus present<br />
independent alternative to separation or optical methods of analysis.<br />
318
XI. Workshop of Physical Chemists and Electrochemists ´11 Brno<br />
In this contribution, examples of successful use of carbon paste electrodes,<br />
carbon film electrodes, mercury electrodes, amalgam electrodes, amalgam crystal<br />
electrodes, boron doped diamond film electrodes, in batch and flow methods, in walljet,<br />
tubular and thin layer arrangement in HPLC or FIA will be described.<br />
The illustration of the importance of proper regeneration of electrode surface is<br />
depicted in Figure 1 showing the repeatability of DPV signal of 2,4-dinitrophenol<br />
using meniscus modified silver solid amalgam electrode (m-AgSAE). Under the<br />
chosen potential program up to 25 curves could be measured with standard deviations<br />
not exceeding 5 %.<br />
I p [nA]<br />
-600<br />
-400<br />
-200<br />
0<br />
0 5 10 15 20 25<br />
N<br />
Fig. 1 Peak heights of DP voltammograms of 1.10 -4 M 2,4-dinitrophenol using m-<br />
AgSAE in BR buffer pH 4.<br />
Electrochemical electrode regeneration: 1 Eini = 100 mV; Efin = -1100 mV; 2 Eini = 100<br />
mV; Efin = -1400 mV; 3 Eini = 0 mV; Efin = -1400 mV.<br />
In case of carbon paste electrode quite nice illustration of the persistence of bare<br />
carbon paste based on microspheres of glassy carbon in a mobile phase with high<br />
content of methanol is depicted in Figure 2. The chromatograms of consecutive 30<br />
injections of 20 μL of 1.10 -4 M aminoglutethimide for HPLC with electrochemical<br />
detection (Edet = 1.3 V) using carbon paste electrode in a mobile phase composed of<br />
phosphate buffer and methanol (1:1, v/v) had the relative standard deviation (RSD) of<br />
only 1.4 % compared with RSD 1.9 % for UV detection at 242 nm. Carbon pastes<br />
based on spherical microparticles of glassy carbon could be used the whole day<br />
without mechanical or electrochemical renewal of working area during single<br />
measurements, the paste does not decompose, the noise being the same and very low.<br />
319<br />
2<br />
3<br />
1
XI. Workshhop<br />
of Physical l Chemists and Electrochemists<br />
E<br />
s ´11<br />
Fig. 2<br />
Chromatogram[9]<br />
of o 30 reppeated<br />
injections<br />
of<br />
aminogluteethimide,<br />
mobile m phasse<br />
0.01M ph hosphate bu<br />
(v/v), ED at<br />
CPE +1,3 V. flow ratte<br />
1 ml·min n−1 f 20 μl 1·10<br />
uffer pH 4:<br />
.<br />
−4 mo ol·l<br />
:MeOH = 5<br />
−1<br />
0:50<br />
OOther<br />
intereesting<br />
electrode<br />
materrials<br />
which is at present<br />
studied intensively y are<br />
boron ddoped<br />
diammond<br />
film electrodes<br />
(BBDBFE).<br />
BD DDFEs hav ve usually hhave<br />
very br road<br />
potentiial<br />
window spanning for f more thhan<br />
3 V, low w noise, low w passivatioon,<br />
mechan nical<br />
and eleectrochemiical<br />
stability,<br />
they aare<br />
biocom mpatible an nd already commercially<br />
availablle.<br />
BDDFEE<br />
could be used for bboth<br />
batch methods and<br />
flow mmethods<br />
in thin<br />
layer orr<br />
wall jet aarrangemen<br />
nt. On the oother<br />
hand d, the inertness<br />
of its surface usu ually<br />
preventts<br />
utilizatioon<br />
of adsor rptive accummulation<br />
of o analytes on their suurface<br />
and thus<br />
furtherr<br />
decreasingg<br />
limits of f determinaation.<br />
Exam mples of th he use of BBDDFE<br />
for r the<br />
determmination<br />
off<br />
carcinoge ens and otther<br />
organ nic analyte es in moddel<br />
samples<br />
of<br />
environnmental<br />
and<br />
biologica al matrices wwill<br />
be give en.<br />
Fiinally,<br />
exammples<br />
of a single silveer<br />
amalgam m crystal as detector inn<br />
voltamme etric<br />
analysiss<br />
will be deescribed.<br />
4. CCONCLUSION<br />
Both<br />
traditiional<br />
and non-tradittional<br />
elec ctrode materials<br />
conttribute<br />
to the<br />
renaissaance<br />
of eleectrochemi<br />
ical methoods<br />
for mo onitoring purposes<br />
wh where they can<br />
compette<br />
with seeparation<br />
methods m oor<br />
can be used as electrochem<br />
e mical sensi itive<br />
detectoors<br />
for separration<br />
meth hods. The ffact<br />
that th he analyte molecule m orr<br />
ion is a di irect<br />
source of signal, high sensi itivity, brooad<br />
linear dynamic ranges, r neww<br />
strategie es in<br />
minimiizing<br />
probllems<br />
with the passivvation,<br />
poss sibility of analysing ooxidizable<br />
and<br />
reducibble<br />
compouunds<br />
even in the preesence<br />
of large l amou unts of nonn-electroac<br />
ctive<br />
substannces,<br />
new mmaterials<br />
or r componennts<br />
of sensor<br />
materials,<br />
high speed,<br />
low runn ning<br />
and invvestment<br />
ccosts,<br />
comp patibility wwith<br />
green chemistry,<br />
support tthis<br />
trend. We<br />
have shhown<br />
that either new w electrodee<br />
materials s or classic cal electrodde<br />
material ls in<br />
combinnation<br />
withh<br />
new pre- -concentrattion<br />
approa aches or electrode<br />
arrrangement<br />
can<br />
320<br />
Brno
XI. Workshop of Physical Chemists and Electrochemists ´11 Brno<br />
provide us with sensitive and selective methods of determination of biologically active<br />
compounds including carcinogenics, environmental pollutants, toxic compound etc.<br />
Performance of electrochemical methods of analysis, especially the utilization of<br />
micro electrodes is of special importance in in vivo measurements, and in<br />
voltammetric immunoanalysis. Also membrane electrodes, fast measurement<br />
techniques and dual or multi-channel detection are the future of electrochemistry.<br />
5. ACKNOWLEDGEMENT<br />
The work has been supported by project No. SVV 261204 and by the Czech<br />
Ministry of Education, Youth and Sports (projects No. MSM 0021620857, RP14/63<br />
and LC 06035) and KONTAKT (AMVIS) project ME10004.<br />
6. REFERENCES<br />
[1] Barek J., Mejstřík V., Muck A., Zima J.: Polarographic and Voltammetric Determination of<br />
Chemical Carcinogens. Crit. Rev. Anal. Chem. 30 (2000), 35.<br />
[2] Zima J., Barek J., Muck A.: Monitoring of Environmentally and Biologically Important Organic<br />
Substance at Carbon Paste Electrodes. Rev. Chim. (Bucuresti) 55 (2004), 657.<br />
[3] Barek, J., Cvačka J., Muck A., Quaiserová V., Zima, J.: Electrochemical methods for monitoring<br />
of environmental carcinogens. Fresenius J. Anal. Chem. 369 (2001), 556.<br />
[4] Švancara I., Vytřas K., Barek J., Zima J.: Carbon paste electrodes in modern electroanalysis. Crit.<br />
Rev. Anal. Chem. 31 (2001), 311.<br />
[5] Barek, J.; Fogg, A.G.; Muck, A.; Zima, J. Polarography and voltammetry at mercury electrodes.<br />
Crit. Rev. Anal. Chem. 31(2001), 291.<br />
[6] Zima J., Cienciala M., Barek J., Moreira J.C.: Determination of thymol using HPLC-ED with<br />
glassy carbon paste electrode, Chem. Anal. (Warsaw) 52 (2007) 1049.<br />
[7] Yosypchuk B., Novotný L.: Nontoxic electrodes of solid amalgams. Crit. Rev. Anal. Chem. 32<br />
(2002), 141.<br />
[8] Zima J.,Svancara I., Barek J., Vytras K.: Recent Advances in Electroanalysis of Organic<br />
Compounds at Carbon Paste Electrodes, Crit. Rev. Anal. Chem. 39 (2001), 204.<br />
[9] Vlachova K.: Diploma Thesis, Charles University in Prague, Faculty of Science, 2010.<br />
321
XI. Workshop of Physical Chemists and Electrochemists ´11 Brno<br />
SPECTROFOTOMETRIC ANALYSIS OF<br />
CYSTEINE-CADMIUM COMPLEXES USING<br />
MUREXIDE INDICATOR<br />
Ondřej ZÍTKA 1 , Jiří SOCHOR 1 , Vojtěch ADAM 1 , René KIZEK 1, *<br />
1 Department of Chemistry and Biochemistry, Faculty of Agronomy, Mendel University in Brno,<br />
Zemedelska 1, CZ-613 00 Brno, Czech Republic<br />
Abstract<br />
Question of interaction of biomolecules with heavy metals is not sufficiently<br />
determined area of the research. We can principally divide the metals into two groups<br />
by physiological point of view. Essential metals are beneficial for organism in nature<br />
physiological biochemical proceses. Toxic metals or essential metals in higher<br />
concentration could cause death of organism. Metal ions are not occurring in the<br />
organism in the free state because they are bond to the biomolecules eg<br />
metalloproteins. The possibility of the bonding on the smaller molecules such as<br />
aminoacids is partially remaining unclear. Aminoacid analysis could be done by many<br />
various approaches. Study of complexes of free amino acids with toxic metals is not so<br />
well known area but it has its importance in bioscience and biochemical research. In<br />
vitro studies of aminoacids and heavy metals could be done for obtaining basic<br />
knowledge about the complex creation of particular group of compounds of interest.<br />
In our work we presented using of UV-VIS spectrophotometric detection as easy to<br />
use method for these purposes. Aim of this work was to observe an interaction<br />
between free aminoacids Cysteine, Homocysteine and N-acetyl cysteine with<br />
cadmium ions.<br />
1. INTRODUCTION<br />
Free amino acids are these which are not in the time or along of its whole<br />
existence bounded neither in any peptide chain which is representing proteins or<br />
enzymes nor in other biomolecules. Next group is biogenic amines or their precursors<br />
during their biosynthesis or group of biogenic amines which originates by<br />
modification of other common aminoacids. If the metal is free occurring in the<br />
organism it can induce a number of reactive oxygen species (ROS) which are danger<br />
for the organism [1]. Free metals like a copper and iron could have a negative role<br />
because could acting like an catalizators for creation of hydroxyl radicals [2] . These<br />
radicals can cause damaging of genetic information of cytoplasmatic membranes and<br />
thus to disturbing of the homeostasis of the organism. In the front defend line against<br />
these influences stays the metal binding proteins or aminoacid which often contains<br />
thiol groups like cysteine, homocysteine or N-acetyl-cysteine. Cysteine is part of well<br />
known tripeptide glutathione (GSH) which is very important and has many benefitial<br />
and crucial functions. Other aminoacids which could have the similar qualities and<br />
322
XI. Workshop of Physical Chemists and Electrochemists ´11 Brno<br />
thus could bind some toxic metal are methionine, histidine or tryptophan. All of these<br />
has a nucleophilic qualities because of their side chains. In this work we studied<br />
interaction between free aminoacids cysteine, homocysteine and N-acetyl-cysteine<br />
with cadmium ions. Cadmium is one of most dangerous metal in the environment<br />
thanks to anthropogenic influence. Various methods for determination of specific<br />
amino acid could be used. Specifity and selectivity of the reaction is critical and<br />
depends on the concrete method according the reagent and structure of the<br />
determined amino acid. In the stationary systems which are common like a reaction<br />
in the cuvette are the products of reactions of aminoacids with specific reagent<br />
monitored to obtain informations about change of absorption maximum or intensity<br />
in one wavelength. These changes could be monitored in the ultraviolet or visible part<br />
of spectra. Methods like a Sakaguchi reaction are based on by eye visible color change<br />
and it is specific on the side chain of the amoniacid. Determination of aminoacids like<br />
tyrosine, tryptophan and Phenylalanin, is possible by Xantoprotein reaction. Pauly´s<br />
reaction is suitable for detection of tyrosine a histidin. For the cystein and its dimer<br />
cystin most suitable method is reaction with Ellman reagent 5,5´-dithiobis-2nitrobenzooic<br />
acid (DNTB) called as Ellman´s method. Thiol group is reacting under<br />
simultanoueous cleaving of DTNB on two monomers. One monomer is immedietly<br />
connected to the free thiol group of Cysteine and second monomer (5-merkapto-2nitrobenzoic<br />
anino) is monitored under 412 nm [3]. There is many other methods<br />
which could be mentioned but we interested about studying of complexes with metals<br />
and thus we decided to apply rather different approach. We used a metalochromic<br />
indicator murexide and we supposed that it will indicate the cadmium ions in free<br />
state. On the other side when metal will be bounded by the aminoacid there should<br />
be a change of absorbance or absorption spectrum occuring.<br />
2. EXPERIMENT<br />
Murexide was achieved from Lachema (Brno, Czech Republic). All other used<br />
chemicals includind cadmium chloride were purchased from Sigma Aldrich in ACS<br />
purity, if there is´t noted otherwise. Stock solutions of all standards (concentrations 1<br />
mg.ml -1 ) were prepared in ACS water (Aldrich, USA) and stored in dark and<br />
temperature -20 °C. New working solutions were prepared every day. The pH value<br />
was measured using inoLab Level 3 with terminal Level 3 (Wissenschaftlich-<br />
Technische Werkstätten - WTW, Weilheim, Germany), controlled by the personal<br />
computer program (MultiLab Pilot; WTW). The pH-electrode (SenTix-H, pH 0–<br />
14/3M KCl) was calibrated by set of buffers (WTW). The pH value and conductivity<br />
was measured using inoLab Level 3 (Wissenschaftlich-Technische Werkstatten<br />
GmbH; Weilheim, Germany). Deionised water underwent demineralization by<br />
reverse osmosis using the instruments Aqua Osmotic 02 (Aqua Osmotic, Tisnov,<br />
Czech Republic) and then it was subsequently purified using Millipore RG (Millipore<br />
Corp., USA, 18 MΏ) – MiliQ water. For spectrophotometric analysis UV-VIS<br />
spectrophotometer Specord - 210 (Jena Analytic, Germany) was used.<br />
Spectrophotometer was equipped by moving carousel for eight samples. Plastic<br />
cuvettes (Kartell, Italy) with optical length 1cm and total volume 1,5ml were used.<br />
323
XI. Workshhop<br />
of Physical l Chemists and Electrochemists<br />
E<br />
s ´11<br />
Carouseel<br />
were teermostated<br />
on speciffic<br />
temper rature by flow aggreegate<br />
JULA ABO<br />
F12/EDD<br />
(Labortecchnik<br />
Gmb bH, Germmany),<br />
whe ere a distilled<br />
waterr<br />
was used d as<br />
mediumm.<br />
All anallysis<br />
was done<br />
under temperatu ure 25°C. In n the scannning<br />
mode the<br />
range wwas<br />
400-7000<br />
nm.<br />
3. RRESULTS<br />
AND DIS SCUSSIONN<br />
WWe<br />
used a Murexide as a colorr<br />
change in ndicator w<br />
functioon<br />
which iss<br />
bounding to heavy mmetals<br />
Cu, Cd, C Co, Pb<br />
[4]. Wee<br />
supposedd<br />
that by in nteraction of Murexi ide with he<br />
createdd<br />
a colored complex which w absorrption<br />
max ximum cou<br />
400-7000<br />
nm. We aalso<br />
assume ed that afteer<br />
an addition<br />
of amin<br />
compleex<br />
with thee<br />
metal we will be abble<br />
to moni itor some c<br />
the commplex<br />
and thus to cha ange of thee<br />
height an nd position<br />
The preeparation<br />
oof<br />
reaction mixture wwas<br />
done pa artially acco<br />
one diffference.<br />
WWe<br />
used fr ree cysteinn<br />
instead of o glutathio<br />
solutionn<br />
of the reagent<br />
consists<br />
of 50 mmM<br />
KCl a 50 mM Tri<br />
every rrepetitions<br />
we used same<br />
conceentration<br />
of f the Mure<br />
repetitiions<br />
differdd<br />
in applied d concentrat ations of Cd d<br />
0,16; 0, ,32; 0,48 a 0,64 mM. For each vvariant<br />
of<br />
four cooncentratioon<br />
repetitions<br />
of cyssteine<br />
10,<br />
Homoccysteine<br />
and<br />
N-acetyl l cysteine wwere<br />
studie<br />
and fastt<br />
mixing off<br />
all parts of<br />
solution wwere<br />
8 cuve<br />
row off<br />
the cadmmium<br />
and d in one independe<br />
concenntration<br />
of each amin noacid anaalyzed.<br />
For<br />
dependdent<br />
measurrement<br />
was s done.<br />
+2 with a commpetitive<br />
lig gand<br />
, Zn, Ag a Hg in ratio o 1:1<br />
eavy metall<br />
there wil ll be<br />
ld be moniitored<br />
in ra ange<br />
no acid whic ich can crea ate a<br />
hange of thhe<br />
structur re of<br />
of absorpttion<br />
maxim mum.<br />
ording literrature<br />
[5] with w<br />
one reuducced.<br />
The basic b<br />
is-Mes undder<br />
pH 7,0. For<br />
exide 100 μμM.<br />
Individual<br />
, which were w 0,01; 00,02;<br />
0,04; 0,08; 0<br />
Murexide with w cadmmium<br />
there was<br />
25, 50 a 100 μM. All Cyste eine,<br />
ed by this approach. After addi ition<br />
ettes which h containedd<br />
concentra ation<br />
nt analysis<br />
every tiime<br />
only one<br />
r these sam mples discoontinual<br />
ti ime-<br />
Fig.1 SStructure<br />
oof<br />
murexide<br />
(A) and d record of f spectra of o murexidd<br />
complex (B).<br />
Complexess<br />
are ma arked: Muurexide+Cysteine+Cad<br />
dmium (mmodrá<br />
křiv vka),<br />
Murexid+KKadmium<br />
(b blue curve) ), Murexide+Cysteine<br />
(green currve)<br />
and single<br />
Murexid (ppurple<br />
curv ve).<br />
The<br />
changess<br />
of height of o absorptioon<br />
maximu um of murex xide whichh<br />
testified by b its<br />
decreasse<br />
and shift ft respective ely about ccreation<br />
of f complex between b mmetal,<br />
murexide<br />
and amminoacid.<br />
Thhe<br />
change of the absoorption<br />
ma aximum of murexide wwas<br />
influen nced<br />
324<br />
Brno
XI. Workshop of Physical Chemists and Electrochemists ´11 Brno<br />
by two factors actually by concentration of metal and concentration of amino acid.<br />
Intensity was influenced by time. Firstly we analyzed individual combinations: single<br />
murexide 100 μM, murexide 100 μM + cysteine 100 μM, murexide 100 μM + cadmium<br />
0,64 mM a murexide + cysteine 100 μM + cadmium 0,64 mM. After comparing<br />
obtained spectra we determined the addition of cysteine as decreases absorption of<br />
maximum of murexide. Addition of cadmium moves the absorption maximum to<br />
longest wavelengths. But if all three components are in mixture, the absorption<br />
maximum moved to shorter wavelengths and decreased slightly (Fig. 1). For quantify<br />
of rate of complex formation which is based on the change of absorption maximum,<br />
we must proceed to normalize output values. Normalization was performed on the<br />
basis of presumption that the highest value of absorbation is getting from interaction<br />
with all three components. We subtracted from highest signal murexide + amino acid<br />
+ cadmium the absorbance values of mixtures murexide + aminoacid and murexide +<br />
cadmium. To realize our computation we had to do same time dependent analysis for<br />
concentration repetitions of murexide + cadmium and murexide + amino acid. Values<br />
of differences for amino acid cystein in appropriated concentration repetitions are<br />
showed in graphs. For all dependences for changes of absorbance based on change of<br />
concentrations of metal and amino acid on various terms which are mentioned in<br />
graphs in this chapter was performed correlation through power law trendline. This<br />
curve is very objective expressing behavior for all trends and it’s characterized by<br />
quadratics Y=a.Xb. It is seem differences of absorbance for all concentrations of<br />
cysteine are uniformly decreased in time. This fact could induct of competitive<br />
character of interactions of murexide with metal, where cysteine molecules are<br />
bonded to metal ions in time and because of this the proportion of free metal ions for<br />
bond with murexide is decreasing. By that are decreasing value of absorbance in<br />
absorption maximum, this was for complex of murexide + aminoacid + metal in<br />
485nm. This assumption confirms trend, where is the lowest dispersion between<br />
highest and lowest values of absorbance of time dependence at the highest applied<br />
concentrations. In coincidence with this thesis is change, which could see between<br />
particular applied concentrations. After comparison of scale of particular axis<br />
(absorbance) is seen, that with highest concentration of cystein occurs for penetrative<br />
decreases of absorbance. In the case of amino acid homocysteine, the creation of<br />
complex wasn´t so intensive. For middle applied concentrations was decrease of<br />
absorbance in time hardly 25% compared to decrease observing in the case of cystein.<br />
Increased creation of complex was noted for amino acid N-acetyl-cystein. The<br />
different of the highest and the lowest values of absorbance isn´t change slightly at<br />
time dependent measurement, but the change of absorbencies between particular<br />
applied concentrations of metal was relatively very high. The highest differencies of<br />
values of complex absorbance was again determined by the highest applied<br />
concentration of amino acid, like both previous cases.<br />
4. CONCLUSION<br />
We proved that the spectrophotometric method could be useful as easy to use<br />
method for characterizing of complex creation between amino acids and free metal<br />
325
XI. Workshop of Physical Chemists and Electrochemists ´11 Brno<br />
ions like cadmium. More options like time dependent measurements, temperature or<br />
concentrations of both reagents could be studied. We observed the best interaction<br />
between cadmium and cysteine 50 μM after 60 minutes of incubation. Interactions of<br />
homocysteine and N-acetyl-cysteine had a smaller efficiency. Moreover homocysteine<br />
best conditions for interaction were recorded in concentration 50 μM after 10-15<br />
minutes and N-acetyl-cysteine interaction were slightly increasing to 30 minutes but<br />
then were negligible.<br />
5. ACKNOWLEDGEMENT<br />
The work has been supported by NANIMEL GA ČR 102/08/1546, NANOSEMED<br />
GA AV and KAN208130801 and NanoBioTECell P102/11/1068 GA ČR.<br />
6. REFERENCES<br />
[1] W. Droge, Physiological Reviews 82 (2002) 47.<br />
[2] B. Halliwell, Journal of Neurochemistry 59 (1992) 1609.<br />
[3] J.Z. Karasova, K. Kuca, D. Jun, J. Bajgar, Chemicke Listy 104 46.<br />
[4] J. Zolgharnein, H. Tahmasebi, S. Amani, Russian Journal of Coordination Chemistry 35 (2009)<br />
512.<br />
[5] P. Leverrier, C. Montigny, M. Garrigos, P. Champeil, Analytical Biochemistry 371 (2007) 215.<br />
326
XI. Workshop of Physical Chemists and Electrochemists ´11 Brno<br />
DETERMINATION OF LACTOFERRINE IN<br />
HUMAN SALIVA<br />
Ondřej ZÍTKA 1 , Jiří SOCHOR 1 , Sylvie SKALÍČKOVA 1 , Jiří LITZMAN 2 ,Marcela<br />
VLKOVA 2 , Ester MEJSTRIKOVÁ 3 ,Vojtěch ADAM 1 , René KIZEK 1<br />
1 Mendel University in Brno, Brno, Czech Republic<br />
2 Department of Clinical immunology and allergology, University Hospital, Pekarska 53, CZ-656 91<br />
Brno, Czech Republic<br />
3 Department of Paediatric Haematology and Oncology, 2 nd Faculty of Medicine, Charles University,<br />
V Uvalu 84, CZ-150 06 Prague 5, Czech Republic<br />
Abstract<br />
Salivary is body fluid, which consists of a lot of substances as enzymes, hormones,<br />
proteins, glykoproteins, electrolytes and perform lot of tasks for body functions.<br />
Lactoferrin is a glycoprotein of about 77000 Da and into of two its domains, C- and Nterminal,<br />
can bind one iron ion to each domain. Aims of this work were to optimize<br />
FPLC separation for purification of lactoferrin from whole saliva and to determine<br />
concentration of lactoferrin in real samples of whole saliva by spectrophotometry. We<br />
analyzed of whole saliva by four healthy volunteers. After isolation of fraction which<br />
contained a purified lactoferrin this fraction was analyzed by Pyrogallol red method<br />
which was conducted by automatic spectrophotometer. Sample of whole saliva was<br />
also analyzed for determination of albumin concentrations. Then the amount of<br />
Lactoferrin was corrected on amount of albumin concentrations (μg of lactoferrin / mg<br />
of albumin) because of different physiological dilution of real sample. Obtained resuts<br />
for 4 volunteers were: 78,2 μg/mg, 82 μg/mg, 100,1 μg/mg, 89,5 μg/mg. Verification of<br />
purity of from FPLC yielded fractions was performed by capillary chip<br />
electrophoresis.<br />
1. INTRODUCTION<br />
Saliva is a fluid secretion of human salivary glands, specifically parotid glands,<br />
submaxillary glands, sublingual gland and other small glands which are interspersed<br />
in oral cavity. Production of saliva is controlled by autonomic vegetative system based<br />
on conditioned and unconditioned reflexes. Daily production of saliva is 1,5 – 2 l per<br />
day in humans depending on type of ingested food and frequency of eating. Rapid<br />
decrease of salivary production is in sleep or in deficiency of liquids [1]. Saliva is<br />
composed of 99% water. Remaining components are mucin, electrolytes (Na, Ca, K,<br />
Mg, F), hormones, proteins – immunoglobulin A, lysozyme, lactoferrin, digestive<br />
enzymes which enable digestion of some compounds as a starch or fats [2]. The main<br />
functions of saliva are antimicrobial activity, ability to reduce acidity, disinfection and<br />
protection against formation of dental decay [3]. Lactoferrin (LF) is a glycoprotein<br />
consisted from 703 amino acid residues. Hololactoferrin is formed from one linear<br />
polypeptide chain forming two spherical domains (C- and N-terminal), each domain<br />
contains one iron binding site (see in the picture). Its molecular weight is of about<br />
327
XI. Workshhop<br />
of Physical l Chemists and Electrochemists<br />
E<br />
s ´11<br />
77000 D<br />
place, b<br />
Co3+ Da. Lactofe<br />
but with lo<br />
, CCu<br />
iron ho<br />
It is<br />
antiinfl<br />
tumour<br />
2+ , Zn2+ errin is abl le to bind different heavy h meta als into the<br />
ower affinit ty. For exaample<br />
it is able to bin nd Ga<br />
, aand<br />
trivale ent lanthannoids.<br />
The biological<br />
omeostasis rregulation.<br />
Iron captuuring<br />
occurs s primary in<br />
related too<br />
cell gro owth reguulation,<br />
cel ll differen<br />
lammatory activity [ 4], [5]. Baased<br />
on th hese functi<br />
r diseases annd<br />
metastas ses has beenn<br />
published d [6].<br />
3+ e same bind<br />
, All<br />
function o<br />
n the intest<br />
ntiation an<br />
ions possib<br />
3+ , VO2+ ding<br />
, Mn M<br />
of lactoferri<br />
tine from f<br />
nd it has<br />
ble relation<br />
3+ ,<br />
in is<br />
food.<br />
an<br />
n to<br />
2. EXPERIME<br />
The<br />
instrum<br />
deliveryy<br />
pumps, c<br />
Sloveniia),<br />
auto-inj<br />
collectoor.<br />
Volume<br />
(25mMM,<br />
pH = 7), B<br />
linear iincreasing<br />
g<br />
(100% B) -> 10.40<br />
was 1 mmLmin-1<br />
ENT<br />
ment for FPLC<br />
(Bio-Raad,<br />
USA) (F Fig. 1) was composed of two solv vent<br />
chromatogr raphic monnolithic<br />
colu umn (CIM SO3 disk, BBia<br />
separati ions,<br />
jection valv ve with 2 mml<br />
injection n loop, UV- -VIS detecttor<br />
and frac ction<br />
e of collecte ed fraction was 1ml. Mobile M pha ase consist of A: Tris-HCl<br />
B: NaCl in mobile m phaase<br />
A (2M). Lactoferrin n was eluteed<br />
by follow wing<br />
gradient: 0 – 1 min (1100%<br />
A) -> > 1 – 10 min<br />
(100% BB)<br />
-> 10 – 10.40<br />
0 – 13.40 min m (100% A) -> 13.4 40 – 13.80 min (100% % A). Flow rate<br />
.<br />
Fig. 3: : FPLC syst tem<br />
Testing<br />
grouup<br />
was 4 healthy<br />
subjjects<br />
22 – 28 2 years old.<br />
Saliva wwas<br />
collecte ed in<br />
the moorning<br />
1 hoour<br />
before eating. Sammples<br />
were collected using u Salivvette<br />
centrifuge<br />
vessel ( (Sarstedt, GGermany)<br />
by b chewingg<br />
swab for 2 minutes. After thatt,<br />
samples were w<br />
centrifuugated<br />
(30000<br />
rcf 5 min), m (Eppenndorf<br />
centr rifuge). The<br />
preparedd<br />
samples were w<br />
diluted 1:1 with wwater<br />
and filtered usiing<br />
micro filter f (micr roStar 0,45μμm<br />
CA, Co ostar<br />
Cambriidge).<br />
Apprroximate<br />
ac cquired voluume<br />
of sam mple was 1 ml. m Before purification n on<br />
FPLC ssamples<br />
weere<br />
analyzed<br />
for conteent<br />
of albu umin by spectrophotoometry<br />
analysis<br />
(BS 2000,<br />
Mindray,<br />
China). Prepared<br />
sammples<br />
were e fractionali ized on FPLLC.<br />
Conten nt of<br />
LF in ssaliva<br />
was iinvestigated<br />
d by spectrrophotometry<br />
(BS 200 0, Mindrayy,<br />
China) using u<br />
Pyrogalllol<br />
red reaagent.<br />
Used d wavelengtth<br />
was 605 5 nm. Obtained<br />
fractioons<br />
of LF were w<br />
analyzeed<br />
by capilllary<br />
chip electrophoreesis<br />
(Exper rion, Bio-Ra ad, USA). AAnalyses<br />
on n an<br />
328<br />
Brno
XI. Workshop of Physical Chemists and Electrochemists ´11 Brno<br />
automated microfluidic Experion electrophoresis system (Bio-Rad, USA) were carried<br />
out according to the manufacturer’s instructions with supplied chemicals (Experion<br />
Pro260 analysis kit, Bio-Rad). Each sample was diluted with water to the same protein<br />
concentration of 300 μg.mL-1, 4 μl aliquots were then mixed with 2 μl of reducing<br />
sample buffer, and after 4 min of boiling, 84 μl of water was added. After priming of<br />
the chip with gel and gel-staining solution in the diluted priming station sample, the<br />
mixture (6 μl) was loaded into sample wells. The Pro260 Ladder included in the kit<br />
was used as a standard.<br />
3. RESULTS AND DISCUSSION<br />
There are many interfering compounds in saliva. Therefore isoelectric point<br />
of lactoferrin (IP~7.8) could be separated using ion exchange chromatography from<br />
other protein substances which have lower IP. Content of LF in human whole saliva<br />
was determined using purification by FPLC and subsequent quantitative analysis by<br />
spectrophotometer. At first, we optimized separation of LF on FPLC. Firstly we<br />
observed dependence of signal height on flow rate. We tested following flow rates: 1<br />
ml/min, 2 ml/min, 3 ml/min, 4 ml/min, 5 ml/min. According to results obtained (Fig.<br />
2A.) the best flow rate was 4 ml/min. We investigated influence of different<br />
concentration of NaCL as an eluting mobile phase. We tested: 0,5M, 0,75M, 1M, 1,<br />
25M, 1,5M and 2M solutions of NaCl (mobile phase B). With increasing concentration<br />
of NaCl there was increased separation resolution. The 2M NaCl was the most<br />
effective for elution of LF from chromatographic column (Fig 2B.).<br />
Fig. 4: Comparison of eluting conditions; (a): Dependence of<br />
signal height on flow rate (b): Dependence of signal height on salt<br />
concentration in eluent<br />
After optimizing of separation conditions, we fractionalized LF from saliva<br />
samples. After that we also analyzed some obtained fractions from saliva by capillary<br />
chip electrophoresis to ensure about the purity of the fraction. We analyzed LF alone<br />
(Fig.3A) and then LF fractionalized (Fig. 3B). The migration time was almost same<br />
nevertheless there were not any other peaks on the electroforeogram detected.<br />
329
XI. Workshop of Physical Chemists and Electrochemists ´11 Brno<br />
Obtained fractions were analyzed by automatic spectrophotometer with Pyrogallol<br />
red method employed. To determination of the reliability of the whole approach we<br />
prepared two types of calibration curves. One was pure LF standard disolved in the<br />
mobile phase B (2M NaCl). Second we calibration was LF standard in the water and<br />
then we separated fractions by optimized FPLC method. These fractions were then<br />
used as second calibration curve. Both standard curves showed good linearity but they<br />
were slightly different. We assumed that it was thanks to little differed structure of LF<br />
which could be caused by ionic strength of the 2M NaCl. With regard to optimized<br />
process we definitely used this second calibration for determinination of LF<br />
concentration. Limit of detection was 15μg/ml. Other step which was necessary to be<br />
done was to determine level of albumin protein in the whole saliva and then<br />
recalculate the amount of the LF on Albumin because of correction of physiological<br />
dilution of real sample of saliva. Limit of detection for Albumin method was 60 μg/ml.<br />
Results were reached as μg of LF on mg of albumin in whole saliva. As shown in Tab.<br />
1, the content of LF in saliva was between 78,2 – 100,1 μg/mg of albumin. Other<br />
authors were found 10 – 25 μg/ml LF in whole saliva by spectrophotometric analysis<br />
[7], [8]<br />
Fig. 5: (a): Peak of standard LF (500μg/ml); (b): Peak of fractionalized saliva<br />
Tab. 1 Concentration of LF in whole saliva<br />
Sample of Concentration of LF Concentration of total concentration of LF on<br />
saliva<br />
(pyrogal red) proteins (albumin) total proteins<br />
(µg/ml) (µg/ml) (µg/mg)<br />
S 1 75,1 960,3 78,2<br />
S 2 74,0 902,4 82,0<br />
S_3 76,4 763,3 100,1<br />
S_4 67,4 752,4 89,5<br />
A. B.<br />
Fluorescence (mFU)<br />
120<br />
100<br />
80<br />
60<br />
40<br />
20<br />
77 kDa<br />
0<br />
25<br />
‐20<br />
30 35 40 45 50<br />
Migration time (s)<br />
330<br />
Fluorescence (mFU)<br />
35<br />
30<br />
25<br />
20<br />
15<br />
10<br />
5<br />
0<br />
35 37 39 41<br />
‐5<br />
Migration time (s)
XI. Workshop of Physical Chemists and Electrochemists ´11 Brno<br />
4. CONCLUSION<br />
Lactoferrin is related to antimicrobial activity, cell grow regulation and<br />
differentiation. It could also play a role as marker for various diseases associated with<br />
immune system. In this study we optimized purification of LF by FPLC and<br />
subsequent analysis by spectrophotometer with possible clarification of purity of<br />
obtained fractions. The most effective conditions were flow rate 4 ml/min and elution<br />
by 2M NaCl. To determine of level of LF in whole saliva the spectrophotometric<br />
analysis was used. The concentrations of LF of healthy humans were 78,2 μg/mg<br />
albumin, 82 μg/mg albumin, 100,1 μg/mg albumin, 89,5 μg/mg albumin.<br />
5. ACKNOWLEDGEMENT<br />
The work has been supported by NANOSEMED GA AV KAN208130801,<br />
NANIMEL GA ČR 102/08/1546 and NanoBioTECell GA ČR P102/11/1068.<br />
6. REFERENCES<br />
[1] I.D. Mandel, Journal of Dental Research 66 (1987) 623.<br />
[2] N.N. Rehak, S.A. Cecco, G. Csako, Clinical Chemistry and Laboratory Medicine 38 (2000) 335.<br />
[3] W.M. Edgar, British Dental Journal 172 (1992) 305.<br />
[4] D. Legrand, E. Elass, M. Carpentier, J. Mazurier, Cellular and Molecular Life Sciences 62 (2005)<br />
2549.<br />
[5] Y. Pan, A. Lee, J. Wan, M.J. Coventry, W.P. Michalski, B. Shiell, H. Roginski, International<br />
Dairy Journal 16 (2006) 1252.<br />
[6] P.P. Ward, E. Paz, O.M. Conneely, Cellular and Molecular Life Sciences 62 (2005) 2540.<br />
[7] K. Komine, T. Kuroishi, A. Ozawa, Y. Komine, T. Minami, H. Shimauchi, S. Sugawara,<br />
Molecular Immunology 44 (2007) 1498.<br />
[8] J. Tenovuo, O.P.J. Lehtonen, A.S. Aaltonen, P. Vilja, P. Tuohimaa, Infection and Immunity 51<br />
(1986) 49.<br />
331
XI. Workshop of Physical Chemists and Electrochemists ´11 Brno<br />
EMPLOYMENT OF HPLC WITH<br />
COULOMETRIC DETECTION FOR<br />
ANALYSIS OF PHYTOCHELATIN<br />
SYNTHASE ACTIVITY<br />
Ondřej ZÍTKA 1 , Olga KRYŠTOFOVÁ 1 , Pavlína ŠOBROVÁ 1 , Josef ZEHNÁLEK 1 ,<br />
Miroslava BEKLOVÁ 1 , Vojtěch ADAM 1 , René KIZEK 1<br />
1 Department of Chemistry and Biochemistry, Faculty of Agronomy, Mendel University in Brno,<br />
Zemedelska1, CZ-613 00 Brno, Czech Republic<br />
Abstract<br />
Phytochlatins are physiologically active peptides which have to be synthesized by<br />
phytochelatin synthase (PCS). The main aim of this study was to optimize high<br />
performance liquid chromatography coupled with electrochemical detector (HPLC-<br />
ED) as suitable tool for determination of the phytochelatin synthase activity.<br />
Coulometric detector with porous graphite working electrode was used. Firstly we<br />
optimized a separation of two compounds which are important for monitoring of PCS<br />
activity. It was glutathione reduced as substrate for the reaction and fytochelatin-2 as<br />
a product. PCS is the best activated by cadmium ions. We used a model with BY-2<br />
tobacco cells. We conducted the in vivo 3 day cultivation experiment where BY-2<br />
cells were treated by various concentrations of cadmium. We then homogenized the<br />
cells and immediately analyzed the extracts by optimized HPLC-ED method.<br />
Moreover we observed that with higher concentrations of applied cadmium there was<br />
increasing of amount of PC-2. The lowest concentration of the toxic metal ions caused<br />
almost three times enhancing PCS activity compared to control samples.<br />
1. INTRODUCTION<br />
Heavy metals are occurring in the environment partially due to increasing<br />
anthropogenic activities. The heavy metals are toxic for both plants and animals [1-3].<br />
But plants has an advantage against animals to be more resistant to them because are<br />
able to synthesize plant stress peptides as phytochelatins (PC; a basic formula (γ-Glu-<br />
Cys)n-Gly (n = 2 to 11)) [4-7]. Phytochelatins can bind heavy metal ions via –SH<br />
groups of cysteine units and consequently transport them to vacuole [5-9], thereby<br />
toxicity of the metal is decreased. Biosynthesis of Phytochelatins is catalyzed by γ-<br />
Glu-Cys dipeptidyl transpeptidase (EC 2.3.2.15), which has been named as<br />
phytochelatin synthase (PCS) [10-11]. In the most preferred reactions of PCS it takes<br />
two molecules of reduced glutathion (γ-Glu-Cys-Gly) as an substrate and produces of<br />
one molecule of PC-2 and one molecule of Glycine. The same mechanism is applied in<br />
case of biosynthesis of PC-3,4 or 5 but every time a GSH is donor and PC is an<br />
acceptor of γ-Glu-Cys dipeptide Fig. 1. We decided to optimize an HPLC method with<br />
coulometric detection for analysis of GSH and PC-2 simultaneously in Cell BY-2<br />
332
XI. Workshop of Physical Chemists and Electrochemists ´11 Brno<br />
Tobacco extract. Electrochemical techniques as differential pulse and cyclic<br />
voltammetry are suitable methods for detection of thiols [12-17]. The electrochemical<br />
methods are sensitive but for our purposes it need to be connected to separation<br />
method such as high performance liquid chromatography. The coulometric detector is<br />
one of the most suitable because of its sensitivity, low noise background and<br />
possibility in baseline correction application which is needed if gradient elution is<br />
applied. Moreover the higher area of the working electrode which is made from<br />
porous graphite is capable to oxidise or reduce more then 90% of the analyzed<br />
substance. And this is more than classic graphite planar electrodes in flow<br />
arrangement [18].<br />
2. EXPERIMENT<br />
Reduced (GSH) and oxidized (GSSG) glutathione, and trifluoroacetic acid (TFA)<br />
were purchased from Sigma-Aldrich (St. Louis, USA). Phytochelatin2 (PC2) (γ-Glu-<br />
Cys)2-Gly was synthesized in Clonestar Biotech (Brno, Czech Republic) with a purity<br />
above 90 %. HPLC-grade methanol (>99.9%; v/v) was from Merck (Dortmund,<br />
Germany) were used. Other chemicals were purchased from Sigma-Aldrich (St. Louis,<br />
USA) unless noted otherwise. Stock standard solutions of the thiols (1 mg.ml -1 ) were<br />
prepared with ACS water (Sigma-Aldrich, USA) and stored in dark at -20 °C. Working<br />
standard solutions were prepared daily by dilution of the stock solutions. All solutions<br />
were filtered through 0.45 μm Nylon filter discs (Millipore, Billerica, Mass., USA)<br />
prior to HPLC analysis. The pH value was measured using WTW inoLab Level 3 with<br />
terminal Level 3 (Weilheim, Germany), controlled by software MultiLab Pilot;<br />
Weilheim, Germany. The pH-electrode (SenTix H, pH 0..14/0..100°C/3mol.l -1 KCl)<br />
was regularly calibrated by set of WTW buffers (Weilheim, Germany). HPLC-ED<br />
system consisted of two solvent delivery pumps operating in the range of 0.001-9.999<br />
ml.min -1 (Model 582 ESA Inc., Chelmsford, MA), Zorbax eclipse AAA C18 (150 × 4.6;<br />
3,5 μm particles, Agilent Technologies, USA) and a CoulArray electrochemical<br />
detector (Model 5600A, ESA, USA). The electrochemical detector includes one flow<br />
cells (Model 6210, ESA, USA). The cell consists of four analytical cells containing<br />
working carbon porous electrode, two auxiliary and two reference electrodes. The<br />
sample (20 μl) was injected using autosampler (Model 542, ESA, USA). Other<br />
experimental parameters were optimized.<br />
3. RESULTS AND DISCUSSION<br />
Firstly we optimized the chromatographic method for separation of glutathiones<br />
reduced (GSH) and oxidized (GSSG) and PC-2. We were able to observe clearly<br />
separated peaks of all compounds of interest. The PC-2 has a retention time about 10,7<br />
minutes. Than BY-2 Tobacco cells in liquid medium were treated by Cd(NO3)2 in<br />
various concentrations 0, 5, 10, 25, 50 and 100 μM. Cells were harvested after 3 day of<br />
cultivation and in same time centrifuged and then immediately homogenized in liquid<br />
nitrogen and phosphate buffer with 1mM TCEP added. After centrifugation we<br />
obtained supernatant which was initial solution for further tests of activity. We took<br />
100 μl of the supernatant from cell extract and added a various concentrations of<br />
333
XI. Workshop of Physical Chemists and Electrochemists ´11 Brno<br />
reduced glutathione (0, 0.05, 0.1, 0.25, 0.5, 1, 2 and 5 mM) as a substrate for the PCS<br />
reaction.<br />
GSH……..….<br />
PC‐2….<br />
γ‐glu‐cys‐gly<br />
PC‐3….<br />
γ‐glu‐cys‐gly<br />
γ‐glu‐cys‐gly + γ‐glu‐cys‐gly<br />
(γ‐glu‐cys) n=2 ‐gly + gly<br />
(γ‐glu‐cys) n=3 ‐gly + 2gly<br />
PC‐4….………….<br />
PC‐5….………….<br />
n = 4<br />
n = 5<br />
Fig.1 Scheme of Fytochelatin synthase functions.<br />
Than cadmium(II) ions (50 μM Cd(NO3)2) were added for initializing of PCS<br />
activity. We optimized that mixtures should be incubated at 35 °C for 30 min for<br />
obtaining the highest yield of PC-2. Using HPLC-ED, PC2 was determined. The signal<br />
of PC-2 were increasing with increase of applied concentration of GSH. The highest<br />
activity of PCS as 278 fkat was determined in cells treated with 100 Cd(II) ions.<br />
4. CONCLUSION<br />
We optimized HPLC-ED method for detection of PC-2 in femtomole<br />
concentrations and we used this method for analysis of the series of cells extracts<br />
treated by different concentrations of cadmium. With partially optimized method we<br />
processed the cells extracts and we analyzed the PCS activity. The cells treated with<br />
100 μM Cd(II) ions had more than seven times active PCS compared to control ones.<br />
These results are in well agreement with those published by Nakazawa et al. [19] and<br />
334<br />
PHYTOCHELATIN<br />
SYNTHASE<br />
EC 2.3.2.15
XI. Workshop of Physical Chemists and Electrochemists ´11 Brno<br />
Ogawa et al. [20]. We proved that HPLC-ED method like this we developed can be<br />
useful for these kinds of biochemical purposes.<br />
5. ACKNOWLEDGEMENT<br />
The work has been supported by REMEDTECH GACR 522/07/0692, GACR<br />
204/09/H002 and IGA MENDELU 2/2011.<br />
6. REFERENCES<br />
[1] C.S. Cobbett, Plant Physiol. 123 (2000) 825.<br />
[2] J.L. Hall, J. Exp. Bot. 53 (2002) 1.<br />
[3] M.H. Zenk, Gene 179 (1996) 21.<br />
[4] W. Bae, W. Chen, A. Mulchandani, R.K. Mehra, Biotechnology and Bioengineering 70 (2000)<br />
518.<br />
[5] C.S. Cobbett, Curr. Opin. Plant Biol. 3 (2000) 211.<br />
[6] M.H. Zenk, Gene 179 (1996) 21.<br />
[7] L.S. di Toppi, R. Gabbrielli, Environmental and Experimental Botany 41 (1999) 105.<br />
[8] C.S. Cobbett, P.B. Goldsbrough, Annu. Rev. Plant. Biol. 53 (2002) 159.<br />
[9] E. Grill, E.-L. Winnacker, M.H. Zenk, Science 320 (1985) 674.<br />
[10] C.S. Cobbett, Trends Plant Sci. 4 (1999) 335.<br />
[11] O.K. Vatamaniuk, E.A. Bucher, J.T. Ward, P.A. Rea, J. Biol. Chem. 276 (2001) 20817.<br />
[12] R. Kizek, J. Vacek, L. Trnkova, F. Jelen, Bioelectrochemistry 63 (2004) 19.<br />
[13] J. Vacek, J. Petrek, R. Kizek, L. Havel, B. Klejdus, L. Trnková, F. Jelen, Bioelectrochemistry 63<br />
(2004) 347.<br />
[14] B. Yosypchuk, I. Sestakova, L. Novotny, Talanta 59 (2003) 1253.<br />
[15] N.S. Lawrence, J. Davis, L. Jiang, T.G.J. Jones, Analyst 125 (2000) 661.<br />
[16] I. Sestakova, P. Mader, Cell. Mol. Biol. 46 (2000) 257.<br />
[17] J. Vitecek, J. Petrlova, J. Petrek, V. Adam, D. Potesil, L. Havel, R. Mikelova, L. Trnkova, R.<br />
Kizek, Electrochim. Acta 51 (2006) 5087.<br />
[18] C.N. Svendsen, Analyst 118 (1993) 123.<br />
[19] R. Nakazawa, H. Kato, Y. Kemeda, H. Takenaga, Biol. Plantarum 45 (2002) 311.<br />
[20] S. Ogawa, T. Yoshidomi, T. Shirabe, E. Yoshimura, Journal of Inorganic Biochemistry 104 (2010)<br />
442.<br />
335
XI. Workshop of Physical Chemists and Electrochemists ´11 Brno<br />
FAST AND ROBUST METHOD FOR<br />
DETECTION COPPER AND CADMIUM<br />
IONS BY FLOW INJECTION METHOD<br />
WITH AMPEROMTRIC DETECTION<br />
Ondřej ZÍTKA 1 , Miguel-Ángel MERLOS 2 , Nuria FERROL 2 , Vojtěch ADAM 1 , René<br />
KIZEK 1<br />
1 Department of Chemistry and Biochemistry, Faculty of Agronomy, Mendel University in Brno,<br />
Zemedelska 1, CZ-613 00 Brno, Czech Republic<br />
2 Departamento de Microbiología del Suelo y Sistemas Simbióticos, Estación Experimental del Zaidín,<br />
CSIC, Profesor Albareda 1, Granada 18008, Spain<br />
Abstract<br />
The problem of heavy metal contamination is obvious in the less developed countries.<br />
Besides this problem is often connected to mining which has a devastating impact on<br />
the landscape, agriculture and whole environment. The contamination of water and<br />
farmland has a direct influence on local inhabitants. We developed a method which is<br />
suitable, fast and robust for determination of metals as cadmium and copper in the<br />
water. Cadmium is one of most environmental occurring toxic heavy metal but copper<br />
is intensively mined. Copper even it is essential element it can be in some case<br />
generating of ROS which are dangerous for organism. Our method based on<br />
amperometric detection using glassy carbon planar electrode as working is due to<br />
connection with flow injection analysis (FIA) method robust and fast enough for this<br />
purposes. We optimized a parameters like flow rate, pH of the working buffer of most<br />
effective potential from hydrodynamic voltammograms which has been constructed.<br />
1. INTRODUCTION<br />
The toxic metals contamination in some less developed countries is world-wide<br />
problem which has only partial scientific of public importance. The hardest impact<br />
has contamination in the pour countries such like in Africa or South America where<br />
the ore and precious metal mining is in motion. And even if the mining stopped many<br />
years after that there is still danger of toxic metals which is mostly occurring in the<br />
water and soil. Soil is then used for growing of the plants for local inhabitants and this<br />
causes the most risk which is hard predictable. But extraordinary dangerous still be<br />
the water which is used in these localities. The monitoring of the contamination level<br />
of the water is most important step to have an initial solution of these kinds of<br />
problems. Problem of metal contamination is not black and white because there are<br />
many aspects as what metal and in which concentration is occurring. In case there are<br />
many of metal there could be very completive dangerous for the human organism.<br />
Physiologicaly we can take cobalt, iron, manganese, molybdenum, nickel, selenium,<br />
vanadium, calcium, tungsten, zinc and copper like essential metals. These are very<br />
336
XI. Workshop of Physical Chemists and Electrochemists ´11 Brno<br />
important by its occurring in proteins. Functionality up to 70% of all described<br />
proteins is dependent on the metals which are bond in their structures [1-3]. The most<br />
toxic metals for human are arsenic, lead, mercury and cadmium [4-5]. Toxicity of the<br />
metals is widely studied but it is important to say that even essential metals could be<br />
toxic if are occurring in organism in high concentrations. There are many ways of<br />
toxic affection for various metals. Arsenic, chromium and platinum are cancerotoxic.<br />
Gold, cobalt, chromic, nickel and platinum are immunotoxic. Mercury has<br />
terratogenic and embryotoxic affecting. Cadmium, lead and thalium are spermiotoxic.<br />
Cadmium and uranium are nefrotoxic and copper, iron, selen and zinc are neurotoxic<br />
[6]. There are many reasons why we should study all of these metals because their<br />
biological danger. In this study we oriented to cadmium which is one of the most<br />
environmental occurring toxic metal nex to lead and mercury and copper which is<br />
essential but in some cases it can play some negative roles. If the copper ions are free<br />
occurring in the organism it can induce a number of reactive oxygen species (ROS)<br />
which are danger for the organism [7]. We used an electrochemical amperometric<br />
detector with glassy carbon planar electrode. We have chosen a flow injection<br />
analysis arrangement. The methods like a flow injection analysis or sequential<br />
injection analysis were founded for easy to use method for mixing of any reagents and<br />
immediate analysis by simple detectors as UV-VIS or than more difficult like ICP-MS.<br />
The next generation of this method is sequential injection analysis SIA which<br />
complementary to Lab on Valve area which is analogous to Lab on Chip area.<br />
2. EXPERIMENT<br />
HPLC-grade methanol (>99.9%; v/v) was from Merck (Dortmund, Germany)<br />
were used. Other chemicals were purchased from Sigma-Aldrich (St. Louis, USA)<br />
unless noted otherwise. Stock standard solutions of the thiols (1 mg.ml -1 ) were<br />
prepared with ACS water (Sigma-Aldrich, USA) and stored in dark at -20 °C. Working<br />
standard solutions were prepared daily by dilution of the stock solutions. All solutions<br />
were filtered through 0.45 μm Nylon filter discs (Millipore, Billerica, Mass., USA)<br />
prior to HPLC analysis. The pH value was measured using WTW inoLab Level 3 with<br />
terminal Level 3 (Weilheim, Germany), controlled by software MultiLab Pilot;<br />
Weilheim, Germany. The pH-electrode (SenTix H, pH 0..14/0..100°C/3mol.l -1 KCl)<br />
was regularly calibrated by set of WTW buffers (Weilheim, Germany). The<br />
instrument for flow injection analysis with electrochemical detection (FIA-ED)<br />
consisted of solvent delivery pump operating in range of 0.001-9.999 ml.min-1 (Model<br />
582 ESA Inc., Chelmsford, MA, USA), a reaction coil (1 m) and an electrochemical<br />
detector. The electrochemical detector includes one low volume flow-through<br />
analytical cell (Model 5040, ESA, USA), which is consisted of glassy carbon working<br />
electrode, hydrogen-palladium electrode as reference electrode and auxiliary<br />
electrode, and Coulochem III as a control module. The sample (5 μl) was injected<br />
manually using 6-way injection valve. The data obtained were treated by Clarity<br />
software (Version 3.0.04.444, Data Apex, Czech Republic). The measuring<br />
experiments were carried out at room temperature. A glassy carbon electrode was<br />
polished mechanically by 0.1 μm of alumina (ESA Inc., USA) and sonicated at room<br />
337
XI. Workshhop<br />
of Physical l Chemists and Electrochemists<br />
E<br />
s ´11<br />
temperrature<br />
for 5 min usin ng a Sonorrex<br />
Digital l 10 P Son nicator (Ban andelin, Berlin,<br />
Germanny)<br />
at 40 WW.<br />
Other ex xperimentall<br />
parameter rs were opti imized.<br />
3. RRESULTS<br />
AND DIS SCUSSIONN<br />
AAim<br />
of this work was s to optimiize<br />
fast and d high thro oughput mmethod<br />
for easy<br />
determmination<br />
of f these tw wo metals in the wa ater. We used u an eelectrochem<br />
mical<br />
amperoometric<br />
dettector<br />
with h glassy carrbon<br />
planar r electrode.<br />
We have chosen a flow f<br />
injectioon<br />
analysiss<br />
arrangem ment for hhigh<br />
throu ughput ana alsis. We cconnected<br />
the<br />
electrocchemical<br />
ddetector<br />
to automated a autosample er wich con ntained a 66-way<br />
injec ction<br />
valve aand<br />
1m lonng<br />
reaction n coul betwween<br />
valve and detect tor. Thankks<br />
this fact one<br />
analysiss<br />
of the saample<br />
took k about 15 second wh hen the fastest<br />
injecttion<br />
mode was<br />
appliedd.<br />
We optimmized<br />
the parameters p like influen nce of flow w rate on thhe<br />
peak hei ight,<br />
influennce<br />
of pH oon<br />
the peak k height annd<br />
we analyzed<br />
all of o these parrameters<br />
like<br />
a<br />
compleex<br />
hydroodynamic<br />
voltammmogram<br />
(HDV) ( records.<br />
HHydrodyna<br />
amic<br />
voltammmograms<br />
wwere<br />
built from numbber<br />
of injections<br />
and each injecction<br />
was done d<br />
under cconcrete<br />
coontrolled<br />
po otential. WWe<br />
measured d HDV´s in n different sscales<br />
like from f<br />
0mV too<br />
1000mV. The upper r range is deeterminate<br />
by durabil lity and staability<br />
of gl lassy<br />
carbon electrodee.<br />
After selecting the best conditions<br />
for meeasurement<br />
t of<br />
hydroddynamic<br />
volltammograms<br />
which wwas<br />
flow ra ate 1 ml/ml and injectiion<br />
about 20uL 2<br />
we anaalyzed<br />
the different pH p of workking<br />
buffer r Britton-Robinson.<br />
TThis<br />
buffer was<br />
very usseful<br />
for widde<br />
pH rang ging from 2 to 8.<br />
Fig.1 (AA)<br />
Hydrodyynamic<br />
vol ltammogramms<br />
for various<br />
concen ntration of copper(II) ions<br />
(100,200 annd<br />
400 μg/m ml). (B) Eleectrochemic<br />
cal cell ESA A 5040 withh<br />
glassy car rbon<br />
electrode.<br />
338<br />
Brno
XI. Workshop of Physical Chemists and Electrochemists ´11 Brno<br />
4. CONCLUSION<br />
The most simplification of the analysis approach is very important in<br />
development of the method which should be complementary to be applied in extreme<br />
conditions. The FIA method is fast and robust for these purposes. If we combine the<br />
automatic injection system which can by easy replaced by manual valve with an<br />
electrochemical detector we obtain fast and robust instrument.<br />
5. ACKNOWLEDGEMENT<br />
The work has been supported by REMEDTECH GA ČR (522/07/0692)<br />
INCHEMBIOL MSM0021622412 and IGA MENDELU 2/2011.This work is dedicated<br />
to UNEP Lead and Cadmium activities.<br />
6. REFERENCES<br />
[1] W. Shi, M.R. Chance, Cellular and Molecular Life Sciences 65 (2008) 3040.<br />
[2] J.A. Tainer, V.A. Roberts, E.D. Getzoff, Current Opinion in Biotechnology 2 (1991) 582.<br />
[3] K. Degtyarenko, Bioinformatics 16 (2000) 851.<br />
[4] N.N. Greenwood, Earnshaw, Chemie prvku I., II., Informatorium, Praha, 1993.<br />
[5] D. Voet, J.G. Voet, Biochemie, Victoria Publishing, Praha, 1995.<br />
[6] J. Szpunar, Analytical and Bioanalytical Chemistry 378 (2004) 54.<br />
[7] W. Droge, Physiological Reviews 82 (2002) 47.<br />
339
XI. Workshop of Physical Chemists and Electrochemists ´11 Brno<br />
IMPLEMENTATION OF WATERRING<br />
MEASUREMENT<br />
TO ENVIRONMENT MONITOR SYSTEM<br />
Jaromír ŽÁK 1 , Jaromír HUBÁLEK 1 , René KIZEK 2<br />
1 Department of microelectronics, Brno University of Technology, Brno, Czech Republic<br />
2 Department of chemistry and biochemistry, Mendel University, Brno, Czech Republic<br />
Abstract<br />
Environment monitoring is these days one of the most important areas of<br />
environmental measurements. In this work new modules for various values<br />
measurements are being developed (temperature, conductivity and pH of waterring).<br />
These modules are constructed for being connected to Environment Monitor –<br />
universal measuring device which has been developed in our laboratories. In<br />
connection to the later developed device for basic meteorological values<br />
measurements, the new complex device becomes a strong tool for ecology applications<br />
too.<br />
1. INTRODUCTION<br />
New modules that measure humidity, acidity, conductivity, and temperature of<br />
precipitation are being developed for interconnection to the actual device called<br />
Environment Monitor using the previously developed communication protocols and<br />
standard links. General description of the device is in the [1]. Communication<br />
protocols were developed for simple and efficient data transferring between main<br />
device and one of the sensor modules. We can connect up to 16 various sensor<br />
modules with internal calibration and automatic type of module detection.<br />
Communication can be realized by one wire (and ground) or by wireless connection<br />
via IQRF [2] modules. Communication has implemented Master Slave serial protocol<br />
with 9bits word length and three types of packets (Command, Data and<br />
Acknowledgement packets are used).<br />
2. EXPERIMENT<br />
There is a design of multipurpose sensor made first, with integrated three sensor<br />
types. Sensors are designed with respect to thick film technology, there are five<br />
sensors on standard ceramic substrate (a square substrate with side length 2”). We<br />
have created a small thick-film sensor for impedance, temperature and pH<br />
measurements (see Figure 1A). The sensor topology has small dimensions: 15 mm × 10<br />
mm for sensing area. There are six layers of materials used on the sensor. The first<br />
layer is conductive layer (grey colour) realized by Ag/Pd paste. Next four layers are<br />
function layers. Meander for temperature sensing (on the left side) is realized by PTC<br />
thermo resistive paste. Electrodes for conductivity measurement are made by Au<br />
paste. Dimensions and number of electrodes are selected with relation to expected<br />
340
XI. WWorkshop<br />
of Phyysical<br />
Chemists and Electrocheemists<br />
´11<br />
preccipitation<br />
cconductivit<br />
ty, which wwill<br />
be rela atively high h (water iss<br />
contamin nated by<br />
ferttilizers;<br />
connductivity<br />
is s similar to drinking water). w<br />
pH sensoor<br />
is compo osed of twoo<br />
electrodes s. MnO2 [4]<br />
or IrOx+TTiO2<br />
[5] is used u for<br />
senssing<br />
electroode<br />
(greater r circle elecctrode<br />
on the t right sid de in the mmiddle,<br />
red colour).<br />
Thee<br />
powders wwere<br />
synth hesized, mixxed<br />
with 3w wt% of glas ss frit and hhomogeniz<br />
zed with<br />
terppineol<br />
based<br />
vehicle to t obtain thhixotropic<br />
paste print ted circle aand<br />
fired at t 520°C.<br />
Ag/ /AgCl pastee<br />
is used fo or referencce<br />
pH elec ctrode (rect tangle electtrode<br />
in th he right<br />
botttom<br />
cornerr,<br />
light blue e colour).<br />
The last layer is a standard dielectric layer l with low absorrption<br />
of moisture m<br />
(greeen<br />
colour) ). This laye er covers noon<br />
sensing parts of th he sensor, sseparates<br />
analyzed a<br />
elecctrolyte<br />
frrom<br />
critic cal parts of sensor r and im mproves ellectrical<br />
isolating i<br />
characteristicss.<br />
Sensor will<br />
be connnected<br />
to th he electron nic circuits by 1.27 mm<br />
pitch<br />
connnector.<br />
Thiis<br />
connecto or must be iisolated<br />
and d waterproo of too.<br />
Fig.1 Me easuring sennsor<br />
and electronic<br />
module<br />
desiggn<br />
Input mmodules<br />
were<br />
designeed<br />
for auto onomic ser rvice withoout<br />
externa al cable<br />
connnections.<br />
PPower<br />
supp ply can be realized by y standard slim 3.3 V batteries for one<br />
monnth<br />
measurement,<br />
bu ut it can bbe<br />
connect ted to exte ernal poweer<br />
supplies s too, if<br />
prefferable.<br />
Daata<br />
connection<br />
to thhe<br />
main module<br />
is re ealized wirreless<br />
using<br />
IQRF<br />
moddules<br />
[2], bbut<br />
they can c be connnected<br />
dir rectly by wire w conneection<br />
as standard s<br />
(earrlier<br />
develooped)<br />
modu ules. Measuurement<br />
of conductivi ity (or imppedance,<br />
if needed)<br />
is reealized<br />
on one fixed frequency generated by genera ator in powwer<br />
supply circuits<br />
(seee<br />
Figure 1B) ). Temperature<br />
is meaasured<br />
by si imple resist tance to volltage<br />
conve erter.<br />
Output oof<br />
the pH sensor is vvoltage<br />
with h negative offset (aboout<br />
250 mV V). This<br />
offsset<br />
is comppensated<br />
by y adding thhis<br />
voltage e and the signal s is ammplified.<br />
All A three<br />
signnals<br />
are coonverted<br />
to o digital siggnals<br />
in microcontro<br />
m oller and thhey<br />
are pr rocessed<br />
digiitally.<br />
341<br />
Brno
XI. Workshhop<br />
of Physical l Chemists and Electrochemists<br />
E<br />
s ´11<br />
3. 3.RESULTSS<br />
AND DISCUSSIO<br />
D ON<br />
Fiifty<br />
waferss<br />
with prot totypes of sensors were w created d first (1255<br />
sensors with w<br />
MnO2 [ [4] and 1255<br />
sensors with w IrOx+TTiO2<br />
[5] ion n selective layer l of pHH<br />
sensor). After A<br />
that, baasic<br />
characcteristics<br />
of f sensors wwere<br />
measu ured. First measuremment<br />
was made m<br />
with thhe<br />
temperatture<br />
sensor r. Measuredd<br />
resistance of created sensor wass<br />
about 300 00 Ω<br />
and aveerage<br />
tempperature<br />
coe efficient wwas<br />
13 Ω/K. Temperatu ure dependdency<br />
was very v<br />
linear. The secondd,<br />
pH senso or didn’t haave<br />
strictly linear characteristics<br />
s (see Figure<br />
2).<br />
Each of<br />
measuredd<br />
sensors had h a differrent<br />
output t voltage to o pH. The most diffe erent<br />
value wwas<br />
offset vvoltage.<br />
The e offset volltage<br />
was varied v betw ween 150 mmV<br />
and 300 mV<br />
(measured<br />
for miinimal<br />
volt tage with pH 14). This T offset will be coompensated<br />
d by<br />
hardwaare.<br />
The nnext<br />
comp pensation step will be realize ed in thee<br />
firmware e of<br />
microcoontroller.<br />
OOpposite<br />
to t temperaature<br />
senso or, calibrati ion of pH sensor is not<br />
linear, but it is rrealized<br />
by polynomiaal<br />
equation n. MnO2 la ayer has smmaller<br />
abra asion<br />
resistannce<br />
and layeer<br />
cohesion n was unstaable.<br />
RReal<br />
cell connstant<br />
for sensor<br />
of coonductivity<br />
y was determ<br />
with thhe<br />
standard calibration n conductivve<br />
solution (1413 μS/c<br />
μS/cm). . We obtainned<br />
average e cell consttant<br />
KREAL = 299.6 m<br />
= 0.9933.<br />
-1 mined fromm<br />
measurem ment<br />
m, 5000 μSS/cm<br />
and 12 2880<br />
, the correcction<br />
factor r is α<br />
Fig.2 3-point<br />
calibrration<br />
of pH H measurem ment<br />
4. CCONCLUSION<br />
There<br />
are soome<br />
device es which wwere<br />
design ned for thi is project. It is the main m<br />
device and its sofftware<br />
for collecting c iinformation<br />
n from slav ve measuremment<br />
modu ules.<br />
There aare<br />
two typpes<br />
of meas surement mmodules.<br />
There<br />
is the e measuremment<br />
modul le of<br />
temperrature,<br />
hummidity,<br />
atmo ospheric preessure,<br />
illumination<br />
and<br />
CO2 gass<br />
concentra ation<br />
(develooped<br />
in the first part of o this projeect).<br />
The other o measu urement moodule<br />
has been b<br />
developped<br />
and it allows us s to measuure<br />
values of pollutio on, temperrature,<br />
pH and<br />
conducctivity.<br />
WWe<br />
have created sm mall thick film sens sors for measuring m nneeded<br />
va alues<br />
altogethher<br />
as welll.<br />
Measurem ment for teesting<br />
and describing d newly n creaated<br />
sensors s for<br />
pollutioon<br />
was madde<br />
after com mpleting thhe<br />
prototyp pe of sensor rs. The nexxt<br />
work on this<br />
project will be to iimplement<br />
new technniques<br />
to th he existing device. d<br />
342<br />
Brno
XI. Workshop of Physical Chemists and Electrochemists ´11 Brno<br />
5. ACKNOWLEDGEMENT<br />
This work has been supported by Grant Agency of the Czech Republic under<br />
the contract GACR 102/08/1546 (NANIMEL) and by the Czech Ministry of Education<br />
in the frame of Research Plan MSM 0021630503 (MIKROSYN).<br />
6. REFERENCES<br />
[1] Zak, J.: "Pristroj pro monitorovani prostredi pri kultivaci rostlin – Bakalarska prace", Brno, 2008,<br />
65p.<br />
[2] MICRORISC, IQRF solution specification, Jicin, 2011, Available from the web:<br />
.<br />
[3] Hubalek, J., Adamek, M.: "Mikrosenzory a mikroelektromechanicke systemy", Brno, 1999, 122p.<br />
[4] Qingwen, L., Yiming, W., Guoan, L.: "pH Response of nanosized MnO2 prepared with solid state<br />
reaction route at room temperature", Sensors and Actuators B 59, 1999, page 42 – 47, China<br />
[5] G. M. da Silva, S. G. Lemos, L. A. Pocrifka, P. D. Marreto, A. V. Rosario, E. C. Pereira:<br />
"Development of low cost metal oxide pH electrodes based on the polymeric precursor method",<br />
Analytica Chimica Acta 616, 2008, page 36 – 41, Available from the web:<br />
<br />
343
XI. Workshop of Physical Chemists and Electrochemists ´11 Brno<br />
TOXIC METALS IN BRNO URBAN SOILS<br />
AND THE PLANTS OF COMMON<br />
DANDELION (TARAXACUM OFFICINALE)<br />
Andrea KLECKEROVÁ 1 , Michaela ŠEBKOVÁ 2 , Hana DOČEKALOVÁ 1<br />
1 Department of Chemistry and Biochemistry, Faculty of Agronomy, Mendel University in Brno, Brno,<br />
Czech Republic<br />
2 Institute of Chemistry and Technology of Environmental Protection, Faculty of Chemistry, Brno<br />
University of Technology, Brno, Czech Republic<br />
Abstract<br />
To examine the metal content of dandelion leaves and roots in relation to<br />
environmental metal levels, the concentrations of cadmium, mercury and lead were<br />
analyzed in plant part and soil samples collected at five sites in the Brno city<br />
differentially impacted by pollution. The sampling place Opuštěná represented the<br />
heavily polluted locality with heavy traffic density situated in the city centre.<br />
Sampling places Vídeňská and Podstránská belonged to medium polluted localities<br />
that were situated close to frequented roads. Relatively clean localities were<br />
represented by Musorgského and Šrámkova Street, which were situated in peripheral<br />
city district with lower traffic density. Soils and plants were collected twice in<br />
November 2008 and March 2009. In the studied soil samples average amounts of<br />
cadmium, mercury and lead did not exceed the limits based on the Regulation No.<br />
13/1994 of the Ministry of Environment Czech Republic. The highest value of metals content<br />
was found in the soil sampled at Opuštěná site in accordance with contamination<br />
loading. The content of lead and mercury in leaves of common dandelion was higher<br />
than the content in roots that indicated preferred atmospheric pollution. On the other<br />
hand the higher cadmium content was measured in underground part of the plant<br />
that indicated soil contamination. The content of toxic metals in soils and common<br />
dandelion plants corresponded well with the contamination load of the sampling<br />
place.<br />
1. INTRODUCTION<br />
The accumulation of high levels of toxic metals in urban soils is caused by many<br />
antropogenic activities. These toxic metals can present an environmental risk,<br />
therefore searching to find reliable, low cost methods of assessing the extent of metal<br />
contamination at a locality and the exposure risk to the biota is high desirable. Toxic<br />
metal deposition in plants from antropogenic sources has increased the attention on<br />
inorganic pollution and established plants as passive biological monitors. A good<br />
biological monitor should be a species that is represented by large numbers of<br />
individuals over a wide geographic area, has a broad toxitolerance, and accumulates<br />
metals at levels reflecting those in the environment so that their chemical<br />
composition will provide a quantitative measure of the magnitude of contamination<br />
344
XI. Workshop of Physical Chemists and Electrochemists ´11 Brno<br />
[1-3]. The widespread distribution of the common dandelion (Taraxacum officinale)<br />
make this ‘species’ an attractive candidate for biological monitoring at the global level<br />
[4]. A number of studies have begun to investigate the suitability of dandelions for<br />
monitoring metal pollution at sites in Europe and Canada [5] Common dandelion is<br />
characterized by a high relative accumulation factor of some contaminants. It uses<br />
include evaluating environmental pollution with SO2, polycyclic aromatic<br />
hydrocarbons and heavy metals [6].<br />
The aim of this work was to investigate the suitability of the common dandelion<br />
for monitoring environmental metal pollution by analyzing the metal content of<br />
dandelion leaves and roots from plants growing at sites in Brno city with a range of<br />
pollution contamination. While previous studies indicated that dandelions could<br />
accumulate metals from the atmosphere as well as from the soil [7] the contents of<br />
studied metals (cadmium, mercury and lead) in the soil were measured<br />
simultaneously.<br />
2. EXPERIMENT<br />
Brno is the second largest city of Czech Republic with wide range of industrial<br />
activities including smelting operations and automotive exhaust. The soil and plant<br />
samples were collected from the topsoil of five sampling sites of the Brno city twice at<br />
November 2008 and March 2009. Location of sampling sites is shown in Figure No 1.<br />
The sampling site Opuštěná represents the heavily polluted locality with high traffic<br />
density situated in the city centre. Sampling sites Vídeňská and Podstránská belong to<br />
medium polluted localities that are situated close to frequented roads. Relatively clean<br />
localities are represented by Musorgského and Šrámkova Street, which are situated in<br />
peripheral city district with smaller traffic density. The soils were sampled from a<br />
depth horizon of 0-10 cm, ten samples at every sampling place, represented an area of<br />
3x3m. Ten plants of common dandelion grown on the sampling place were extracted<br />
from the soil, washed with distilled water and air-dried. For characterization of soils,<br />
a fine soil fraction of particle size below 2 mm was obtained by sieving the air-dried<br />
raw sample, from which large components were separated (stones, plant parts). Single<br />
leaching procedure with 2 mol.l -1 HNO3 was used for cadmium and lead determination<br />
in soils samples.<br />
345
XI. Workshhop<br />
of Physical l Chemists and Electrochemists<br />
E<br />
s ´11<br />
Fig. 1 LLocation<br />
off<br />
sampling sites: A – OOpuštěná,<br />
B – Vídeňs ská, C – Poodstránská,<br />
D –<br />
Musorgského,<br />
E – Šrámkova<br />
Portion<br />
of 7 g dried and d sieved soil was shake<br />
temperrature<br />
(25ºCC)<br />
with 70 ml of 2 mmol.l<br />
immediiately<br />
filterred<br />
and the e filtrate w<br />
homogeenized<br />
plannt<br />
samples were w minera<br />
1200, Ittaly)<br />
using 6 ml of conc centrated HN<br />
Mercury in ddried<br />
and sie eved soil an<br />
absorption<br />
spectrommetry<br />
using g the AMA<br />
concenntrations<br />
wwere<br />
determ mined in b<br />
Electroothermal<br />
attomic-abso<br />
orption spe<br />
Germanny)<br />
was useed<br />
under th he recomme<br />
-1 en in an ext traction boottle<br />
at amb bient<br />
nitric c acid for 16<br />
hours. TThe<br />
extract was<br />
was collected<br />
in polyet thylene botttle.<br />
Dried and<br />
alized in th he microwa ave oven (MMilestone,<br />
MLS M<br />
NO3 and 1 ml l of 30% H2O O2.<br />
nd in dried plant p samples<br />
was deterrmined<br />
by at tomic<br />
A 254 (Altec,<br />
s.r.o., ČR). Č Cadmiium<br />
and lead<br />
both the HNO3 H leac chates and plant dig gests.<br />
ectrometer (AAS ZEEnit<br />
60, AAnalytik<br />
Jena, J<br />
ended cond ditions specified<br />
by thee<br />
producer. .<br />
3. RRESULTS<br />
AND DIS SCUSSIONN<br />
Thhe<br />
highest mmercury<br />
co ontent in soiil<br />
was found<br />
Novemmber<br />
2008 aand<br />
March 2009. The average co<br />
0.607 ± 0.101mg.kg-1<br />
. At the sam mpling site PPodstránská<br />
w<br />
of merccury<br />
in the soil, 0.212 ± 0.022 mgg.kg<br />
collecteed<br />
from othher<br />
three sampling<br />
sit<br />
dandelioon<br />
roots corrresponded<br />
with w the merc<br />
green pplant<br />
partss<br />
was high her than i<br />
atmosphheric<br />
deposittion<br />
of mercu ury species.<br />
-1 d at the sam mpling site OOpuštěná<br />
both<br />
at<br />
ncentration of mercury wwas<br />
at this site<br />
was recorded<br />
the secondd<br />
highest content<br />
. The concentra ations of mmercury<br />
in soil<br />
tes were much m lower.<br />
Contents oof<br />
mercury in n the<br />
cury content ts in soil. Th he content of mercur ry in<br />
in roots at t all samp pling sites. That indic cates<br />
The low contamination<br />
of soil as weell<br />
as of plan nt by<br />
346<br />
Brno
XI. Workshop of Physical Chemists and Electrochemists ´11 Brno<br />
mercury, comparable with Brno clean areas, was found at Vídeňská Street. Obtained results are<br />
summarized at Fig. 2.<br />
mHg (g.kg -1 DW)<br />
650<br />
600<br />
550<br />
500<br />
450<br />
400<br />
350<br />
300<br />
250<br />
200<br />
150<br />
100<br />
50<br />
0<br />
607<br />
66<br />
84<br />
58<br />
9<br />
37<br />
212<br />
43<br />
74<br />
Fig. 2. Average content of mercury in soil, roots and leaves of dandelion.<br />
The highest content of lead in soil was found at the sampling site Opuštěná. The<br />
average amount of lead in soil was 51.6 ± 9.3 mg.kg-1. Approximately half the levels<br />
of lead in soil were detected at sampling locations Vídeňská, Podstránská and<br />
Musorgského. The lowest lead concentration, 9 ± 1.1 mg.kg-1, was measured in soil<br />
samples collected at sampling site Šrámkova. The contents of lead in the dandelion<br />
roots fluctuated around 2 mg.kg-1 at all sampling sites. The contents of lead in<br />
dandelion leaves corresponded to contamination load, the highest lead content, 10.04<br />
± 3.1 mg.kg-1, was found at the sampling site Opuštěná with heavy traffic density<br />
(Fig. 3.). Similarly to mercury higher contents of lead were found in dandelion leaves.<br />
The content of mercury and lead in dandelion leaves could predict atmospheric<br />
pollution of these two toxic elements.<br />
mPb (mg.kg -1 DW)<br />
60<br />
55<br />
50<br />
45<br />
40<br />
35<br />
30<br />
25<br />
20<br />
15<br />
10<br />
5<br />
0<br />
Fig. 3. Average content of lead in soil, roots and leaves of dandelion<br />
The highest content of cadmium in soil was found at the sampling site<br />
Opuštěná, average concentration 0.645 ± 0.022 mg.kg-1. Significantly lower amounts<br />
of cadmium than other collector sites were detected at the sampling site Šrámkova,<br />
the average content of cadmium in soil was 0.114 ± 0.026 mg.kg-1. Obtained results<br />
were summarized in (Fig. 4.). Compared to lead and mercury higher contents of<br />
cadmium were found in dandelion roots collected at all studied localities. The main<br />
source of cadmium was in this case in the soil. Conversely to mercury and lead<br />
347<br />
48<br />
5<br />
34<br />
41<br />
8<br />
25<br />
Opuštěná Vídeňská Podstránská Mosurgského Šrámkova<br />
51,6<br />
2,39<br />
10,04<br />
25,7<br />
2,09<br />
6,49<br />
Sampling sites<br />
25,9<br />
2,14<br />
6,15<br />
18,7<br />
2,02<br />
4,77<br />
9<br />
1,82<br />
soil<br />
root<br />
leaves<br />
Opuštěná Vídeňská Podstránská<br />
Sampling sites<br />
Mosurgského Šrámkova<br />
soil<br />
root<br />
leaves<br />
2,67
XI. Workshop of Physical Chemists and Electrochemists ´11 Brno<br />
cadmium was found in soils at the mobile and labile forms and enters the plant<br />
primarily through the root system.<br />
Fig. 4. Average content of cadmium in soil, roots and leaves of dandelion<br />
4. CONCLUSION<br />
Levels of cadmium, mercury and lead in studied Brno urban soil samples based<br />
on the Regulation No. 13/1994 of the Ministry of Environment Czech Republic were<br />
not exceed. The amount of metals measured in soils and in leaves and roots of<br />
common dandelion corresponded with the contamination load of the sampling place.<br />
It was demonstrated, that the common dandelion could be used as biological monitor.<br />
The higher content of lead and mercury in dandelion leaves than in roots indicated<br />
predominantly atmospheric pollution of sampling place. Cadmium was preferentially<br />
accumulated in dandelion roots and thus determination of cadmium in dandelion<br />
roots could be used for prediction of soil contamination.<br />
5. ACKNOWLEDGEMENT<br />
The work has been supported by Grant Agency of the Czech Republic, Project<br />
No. P503/10/2002).<br />
6. REFERENCES<br />
mCd (g.kg -1 DW)<br />
700<br />
650<br />
600<br />
550<br />
500<br />
450<br />
400<br />
350<br />
300<br />
250<br />
200<br />
150<br />
100<br />
50<br />
0<br />
645<br />
217<br />
118<br />
427<br />
[1]. Bargagli, R., Trace elements in terrestrial plants : an ecophysiological approach to biomonitoring<br />
and biorecovery. Environmental intelligence unit. 1998: Berlin [etc.] : Springer.<br />
[2]. Martin, M.H. and P.J. Coughtrey, Biological monitoring of heavy metal pollution: land and air.<br />
Biological monitoring of heavy metal pollution: land and air., 1982.<br />
[3]. Wittig, R., General aspects of biomonitoring heavy metals by plants. Plants as biomonitors, ed.<br />
B. Markert. 1993: Weinheim, Germany: VCH Verlagsgesellschaft.<br />
[4]. Djingova, R. and I. Kuleff, Monitoring of heavy metal pollution by Taraxacum officinale. . Plant<br />
as biomonitors, ed. B. Markert. 1993: Wiley-VCH Verlag GmbH. 435-460.<br />
[5]. Marr, K., H. Fyles, and W. Hendershot, Trace metals in montreal urban soils and the leaves of<br />
Taraxacum officinale. Canadian Journal of Soil Science, 1999. 79(2): p. 385-387.<br />
149<br />
348<br />
54<br />
330<br />
130<br />
Opuštěná Vídeňská Podstránská Mosurgského Šrámkova<br />
48<br />
Sampling sites<br />
317<br />
82<br />
35<br />
114<br />
59<br />
soil<br />
root<br />
leaves<br />
32
XI. Workshop of Physical Chemists and Electrochemists ´11 Brno<br />
[6]. Krolak, E., Accumulation of Zn, Cu, Pb and Cd by dandelion (Taraxacum officinale Web.) in<br />
environments with various degrees of metallic contamination. Polish Journal of Environmental<br />
Studies, 2003. 12(6): p. 713-721.<br />
[7]. Kabata-Pendias, A. and S. Dudka, Trace metal contents;Taraxacum officinale (dandelion) as a<br />
convenient environmental indicator. Environmental Geochemistry and Health, 1991. 13(2): p.<br />
108-113.<br />
349
XI. Workshop of Physical Chemists and Electrochemists ´11 Brno<br />
LANTHANUM 3+ - A NEW PHOSPHATE<br />
CHELATOR USED IN CHRONIC KIDNEY<br />
DISEASE - POTENTS APOPTOSIS IN PC-3<br />
AND 22RV1 PROSTATE CANCER CELL<br />
LINES AND IN HEALTHY PROSTATE CELLS<br />
PNT1A<br />
Marian HLAVNA 1 , Michal MASAŘÍK 1 , Petr BABULA 2 , Jaromír GUMULEC 1 , Markéta<br />
SZTALMACHOVÁ 1<br />
1 Department of Pathological Physiology, Faculty of Medicine, Masaryk University, Kamenice 5, CZ-<br />
625 00 Brno, Czech Republic<br />
2 Department of Natural Drugs, Faculty of Pharmacy, University of Veterinary and Pharmaceutical<br />
Sciences, Palackeho 1-3, CZ-612 42 Brno, Czech Republic,<br />
1. INTRODUCTION<br />
Lanthanum 3+ belongs to group of lanthanides – a so called rare Earth’s elements.<br />
Lanthanides are widely used in agriculture, chemistry and industry as well as<br />
medicine; so, they are able to enter the living environment and food chains.<br />
Ecological risk, as well as effect of lanthanides on living organisms on different levels<br />
– molecular, cytological, histological – are still almost unknown. Lanthanum 3+<br />
carbonate is used as a relatively new drug for binding an inorganic phosphate in<br />
patients suffering with renal functional impairment [1-3]. Nevertheless, the fact that<br />
lanthanum 3+ is considered to be only low available, increase of lanthanum 3+ plasmatic<br />
levels was detected in pharmacological studies. Incorporation of lanthanum 3+ ions into<br />
bone structures was shown [4]. In animals, interference of lanthanum 3+ ions with<br />
calcium channels as well as inhibition of different enzymes was demonstrated.<br />
Recently, in in vitro experiments, affinity of lanthanides ions to possible binding sites<br />
for zinc 2+ ions has been demonstrated [5]. As prostate cancer cells are characteristic by<br />
decreased ability to uptake, accumulate and metabolize zinc ions and lanthanum 3+<br />
shows some similar properties, we decided to investigate effect of lanthanum 3+<br />
treatment on PC-3 and 22Rv1 prostate cancer cell lines and PNT1A cell line<br />
representing healthy prostate epithelial cells.<br />
2. EXPERIMENT<br />
We treated PC-3 and 22Rv1 prostate cancer cell lines and PNT1A healthy<br />
prostate epithelium cell line with increasing concentration of lanthanum 3+ . 22Rv1 and<br />
PNT1A cell lines were treated with 100 μM, 300 μM, 600 μM and 1200 μM<br />
concentration of lanthanum 3+ in medium, and 50 μM, 150 μM, 500 μM and 1000 μM<br />
for Firstly, after lanthanum 3+ treatment we observed morphological changes in nuclei<br />
350
XI. Workshop of Physical Chemists and Electrochemists ´11 Brno<br />
of prostate cell lines. Therefore we decided to investigate gene expression after<br />
lanthanum 3+ treatment on mRNA level using RT-PCR combined with real time-PCR<br />
quantification. We concerned especially on genes conducted with zinc uptake (ZIP1)<br />
and its extracellular exclusion (ZnT-1), proliferation (FOS, JUN) apoptosis (p53, NFkB),<br />
genes involved in metabolism, transport and storage of heavy metals and<br />
protection against oxidative stress (MT1A, MT2A). Furthermore, we looked in detail<br />
on morphological changes on cellular level using immunohistochemistry and<br />
fluorescent microscopy.<br />
3. RESULTS AND DISCUSSION<br />
Morphological changes in cells observed after lanthanum 3+ treatment are shown<br />
in Fig. 1. In case of PNT1A and PC-3 cells is clear evidence of chromatin<br />
condensation, fragmentation of nuclei and apoptosis. A bit different morphological<br />
changes have been found in 22Rv1 cell line. We observed forming of micronuclei<br />
after lanthanum 3+ treatment rather than nuclei segmentation and apoptosis (Fig.1 C<br />
and F.) showing that this cell line is sensitive for lanthanum 3+ treatment in different<br />
manner.<br />
Interestingly, lanthanum 3+ treatment has different effect on transcriptional level<br />
of some investigated genes across used prostate cancer/healthy epithelium cell lines<br />
(shown in Fig. 2).<br />
We found that increasing lanthanum 3+ concentration caused increasing<br />
expression of MT1A in 22Rv1 cancer cell line but rapid decrement of MT1A<br />
expression in PC-3 cancer cell line. Moreover, in healthy prostate epithelium cell line<br />
PNT1AA caused lanthanum 3+ treatment, except 100 μM concentration (>8-fold<br />
increase), no significant change in MT1A expression (Fig 2). Similarly, we found that<br />
only 100 μM lanthanum 3+ treatment caused significant change in MT2A expression<br />
and only in PNT1AA cell line (>5-fold increase). Surprisingly, we observed in 22Rv1<br />
and PC-3 cell line opposite lanthanum 3+ effect than in MT1A. Lanthanum 3+ caused<br />
slightly decreasing trend in MT2A expression in 22Rv1 and increasing in PC-3,<br />
respectively.<br />
351
XI. Workshhop<br />
of Physical l Chemists and Electrochemists<br />
E<br />
s ´11<br />
A.<br />
B.<br />
C.<br />
Fiig.<br />
1: Propiidium<br />
iodid de stained p<br />
(A) PNNT1AA<br />
proostate<br />
cell line l withou<br />
prostatee<br />
cancer ceell<br />
line con ntrol and (C<br />
(D) PNNT1AA<br />
cellls<br />
after 48 hour lanth<br />
Upper arrow shoows<br />
nucleu us fragmen<br />
chromaatin<br />
condennsation<br />
and d lower arr<br />
cells aft fter 48h 10000<br />
μM lant thanum<br />
late apooptosis.<br />
(F) ) 22RV1 ce<br />
show mmicronucleii.<br />
3+ prostate ce<br />
ut lanthan<br />
C) are 22R<br />
hanum<br />
tr<br />
ell line afte<br />
3+ ll lines afte<br />
num<br />
tre<br />
ntation an<br />
row shows<br />
reatment. A<br />
er 48h 1200<br />
3+ er lanthanu<br />
treatm ment (cont<br />
v1 prostate e cancer ce<br />
eatment in 1200 μM<br />
nd apoptosis,<br />
middle<br />
formation of micronu<br />
Arrow show ws cell frag<br />
0 μM lanth hanum3+ um<br />
tre<br />
3+ treatm ment.<br />
trol), (B) PC-3 P<br />
ell line con ntrol.<br />
concentrat tion.<br />
arrow sh hows<br />
uclei. (E) PC-3 P<br />
gmentation and<br />
eatment, ar rrow<br />
AAs<br />
we obserrved<br />
by fluo<br />
investiggation<br />
the llanthanum3<br />
orescent miicroscopy<br />
apoptosis a we w have beeen<br />
intereste ed in<br />
3+ treatmennt<br />
effect on cell cycle regulatory r ggenes<br />
FOS/ /JUN<br />
352<br />
D.<br />
E. .<br />
F. .<br />
A<br />
Brno
XI. WWorkshop<br />
of Phyysical<br />
Chemists and Electrocheemists<br />
´11<br />
andd<br />
also antiaapoptotic<br />
ge ene NF-kB.<br />
No signif ficant chan nge on mRNNA<br />
level has h been<br />
obseerved<br />
in thhese<br />
genes.<br />
As prosta<br />
andd<br />
our prev<br />
trannsporters<br />
fo<br />
leveels<br />
of Zip1<br />
humman<br />
cells. I<br />
ZnTT-1<br />
transpo<br />
lantthanum3+<br />
ate cancer cells are chharacteristi<br />
ic by zinc ion metaboolism<br />
dereg gulation<br />
vious exper riments shhow<br />
that ZIP1/ZnT-1<br />
Z 1 transport rters can serve s as<br />
or other me etal ions suuch<br />
as cadm mium or copper,<br />
we innvestigated<br />
d mRNA<br />
– the main n zinc ion iimporter<br />
an nd ZnT1 – main expoorter<br />
of zinc<br />
ion in<br />
In our experiment<br />
wee<br />
did not observe o sig gnificant chhange<br />
in ZI IP1 and<br />
orter expres ssion. It is likely, that t these tran nsporters arre<br />
not essen ntial for<br />
immport<br />
and export e fromm<br />
the cell.<br />
In case oof<br />
22Rv1 an nd PNT1A c<br />
p533<br />
expressionn<br />
after lanthanum<br />
expression<br />
in PPC-3<br />
cell l<br />
thesse<br />
cell liness<br />
are likely<br />
3+ cell lines we w also foun nd non-signnificant<br />
cha anges in<br />
trreatment<br />
an nd only mo odest decreeasing<br />
trend d in p53<br />
ine (Fig 2). . Our resul lts suggestin ng that apooptosis<br />
obse erved in<br />
p53 indepeendent.<br />
Fig. 2: RRelative<br />
exp pression of<br />
22RRv1<br />
and PNNT1AA<br />
lan nthanum<br />
decrrease<br />
(p=0, ,05) in mRN<br />
alsoo<br />
found stattistically<br />
sig<br />
ZIPP1<br />
in 22RRv1<br />
cell li<br />
3+<br />
f investigated<br />
genes after<br />
prostat<br />
treatment t. We obse erved statis<br />
NA level oof<br />
MT2A af fter lanthan num<br />
gnificant inncrease<br />
of MT1A M mRN<br />
ine (p=0,055).<br />
PNT1A A cells sh<br />
3+ te cell line es PC-3,<br />
stically sig gnificant<br />
treattment<br />
in PC3. P We<br />
NA and decrrease<br />
of Zn nT-1 and<br />
how signifi ficant increase<br />
in<br />
353<br />
Brno
XI. Workshop of Physical Chemists and Electrochemists ´11 Brno<br />
MT1A/MT2A expression only in relatively low concentrations of lanthanum 3+<br />
(100μM).<br />
4. CONCLUSION<br />
Our results show, that lanthanum 3+ causes chromatin condensation, forming of<br />
micronuclei and nuclei segmentation in prostate cancer cell lines and healthy prostate<br />
epithelial cells. This nuclei segmentation and apoptosis are most probably NF-kB and<br />
p53 independent. Even that lanthanum 3+ shows similar properties as zinc ions, main<br />
zinc ion cell transporters ZIP1 (influx) and ZnT-1 (efflux) are likely not involved in<br />
lanthanum 3+ transport and lanthanum 3+ ions are coming through membranes by other<br />
mechanism. To reveal apoptotic pathway activated after lanthanum 3+ treatment is<br />
desirable to investigate also other possible pathways e.g. Ca 2+ dependent or Fas<br />
receptor mediated apoptotic pathways.<br />
5. ACKNOWLEDGEMENT<br />
The work has been supported by grants GACR 301/09/P436 and NSI0200-3<br />
6. REFERENCES<br />
[1] Scaria, P.T., Gangadhar, R., Pisharody, R.: Indian J. Pharmacol. 41, (2009), 187-191.<br />
[2] Arenas, M.D., Rebollo, P., Malek, T., Moledous, A., Gil, M.T., Alvarez-Ude, F., Morales, A.,<br />
Cotilla, E.: J. Nephrol. 23, (2010), 683-692<br />
[3] Samy, R., Faustino, P.J., Adams, W., Yu, L., Khan, M.A., Yang, Y.S.: J. Pharm. Biomed. Anal. 51<br />
(2010), 1108-1112.<br />
[4] Bronner, F., Slepchenko, B.M., Pennick, M., Damment, S.J.P.: Clin. Pharmacokinet. 47, (2008),<br />
543-552.<br />
[5] Huidrom, B., Devi, N.R., Ch, S., Singh, T.D., Yaiphaba, N., Singh, N.R.: J. Indian Chem. Soc. 87,<br />
(2010), 1391-1394.<br />
354
XI. Workshop of Physical Chemists and Electrochemists ´11 Brno<br />
OPTIMIZATION OF PLANAR THREE-<br />
ELECTRODES SYSTEMS<br />
FOR ELECTROCHEMICAL APPLICATIONS<br />
Jan PRÁŠEK 1<br />
1 Dept. of Microelectronics, Brno University of Technology, Technicka 10, 616 00 Brno, Czech Republic<br />
Abstract<br />
This paper studies the optimization possibilities of planar thick film three-electrode<br />
electrochemical systems for detection of species in aqueous solutions. The aim of this<br />
work was to find suitable material for reference electrodes fabrication and determine<br />
how the shape and size of the electrodes affect the output signal. Various commercial<br />
and own materials were used for Ag/AgCl reference electrodes fabrication and<br />
compared with standard reference electrode. The best results were achieved with<br />
commercial materials for reference electrodes fabrication. Moreover several<br />
differently sized and shaped electrodes were fabricated for their electrochemical<br />
behaviour evaluation. Finally some conclusions and recommendations for electrodes<br />
sizes and shapes come out too.<br />
1. INTRODUCTION<br />
Commercial solid electrodes are usually created from a big glass body with<br />
attached metal wire or plate, but the necessities of today’s analyses are small-size<br />
electrodes. One possibility of miniaturization of solid electrodes is their integration<br />
onto a small substrate. Such electrochemical system forming a small sensor could be<br />
fabricated using thick film technology (TFT). The advantages of this solution are low<br />
dimensions, good electrical and mechanical properties of electrodes, good<br />
reproducibility and well accessible and ecological fabrication process. Unconventional<br />
applications of TFT also open wide possibilities of creation of electrodes of sensors and<br />
biosensors using chemical active electrode materials.<br />
In last few years, various commercial electrochemical sensors have been<br />
developed and presented. Besides them, many scientific works reported very good<br />
results using different electrochemical thick-film sensors, but nowhere is explained,<br />
why the selected topography, electrode materials, etc. was used. Also their influence<br />
to output current response of electrochemical sensors is not reported. The aim of<br />
presented paper is to check the behaviour of output current response of thick film<br />
planar reference electrodes (RE) depending on material used for their fabrication and<br />
to check, how the size and shape of the electrodes influence the output current<br />
response of the three-electrode electrochemical sensor. The behaviour was studied in<br />
a three-electrode system using standard electrochemical solution of potassium ferroferricyanide.<br />
355
XI. Workshhop<br />
of Physical l Chemists and Electrochemists<br />
E<br />
s ´11<br />
2. EXPERIMEENT<br />
The<br />
design of new thr ree-electrodde<br />
systems for all exp periments ccame<br />
out from f<br />
the stanndard<br />
plannar<br />
voltamm metric elecctrochemica<br />
al three-ele ectrode thiick-film<br />
sensor<br />
topograaphy<br />
commmonly<br />
used d in our labboratory<br />
[1 1]. The sta andard TFTT<br />
voltamme etric<br />
sensor ttopographyy<br />
used in ou ur laboratorry<br />
is shown n in the figu ure 1. For aall<br />
experim ments<br />
the samme<br />
sized aluumina<br />
subst trate (25.4× ×7.2 mm) an nd the same<br />
size of plaanar<br />
electro odes<br />
area (7× ×7 mm) weere<br />
used for r sensors deesign<br />
in this s work.<br />
Figg.1<br />
Standard TFT voltamm metric<br />
sensor ttopography<br />
OOwn<br />
referennce<br />
Ag/AgC Cl electroddes<br />
were ele ectrodeposi ited accordding<br />
to [2] over o<br />
standarrd<br />
Ag based<br />
TFT elec ctrode (ESLL<br />
9912-K). . Another two DuPoont<br />
commercial<br />
polymeer<br />
pastes wwere<br />
used fo or RE fabriication:<br />
pas ste type 5870<br />
(Ag:AgCCl<br />
ratio: 80 0:20)<br />
and 58774<br />
(Ag:AgCCl<br />
ratio: 65: 35). Pastes were scree en-printed and a cured aat<br />
120 °C fo or 10<br />
minutees.<br />
Foor<br />
electroddes<br />
size expe eriment sevven<br />
differen nt sensors with w strip eelectrodes<br />
were w<br />
designeed<br />
(Figure 22).<br />
The size e of workinng<br />
electrod des (WE) was<br />
fixed annd<br />
the auxil liary<br />
electroddes<br />
(AE) annd<br />
RE wer re varied. FFor<br />
electrode<br />
shape experiment,<br />
, seven sen nsors<br />
with diifferent<br />
shaape<br />
of electr rodes and tthe<br />
same ge eometrical electrodes area sizes were w<br />
designeed<br />
(Figure 33).<br />
Soolution<br />
of f a 0.05 mol/L m pottassium<br />
fer rrocyanide, , 0.05 mool/L<br />
potass sium<br />
ferricyaanide<br />
and 00.2<br />
mol/L KOH K was pprepared<br />
us sing 18MΩ redistilled d and deion nized<br />
water and used for all experiments<br />
e s. All the e measurem ments werre<br />
done using u<br />
potentiiostat<br />
Voltalab<br />
PST050<br />
(Radiommeter<br />
analytical,<br />
De enmark). TThe<br />
measu uring<br />
methodd<br />
was cyclicc<br />
voltamme etry (CV) iin<br />
range of f the potent tial from -3300<br />
to 600 mV.<br />
The scaan<br />
rate wass<br />
set to 20 mV/sec. m Thhe<br />
measurement<br />
setup p and respoonse<br />
evalua ation<br />
were ddone<br />
usingg<br />
a stand dard personnal<br />
compu uter. In RE R experimment<br />
stand dard<br />
commeercial<br />
WE aand<br />
SE were e used.<br />
3. RRESULTS<br />
AND DIS SCUSSIONN<br />
Fiirst<br />
experimment<br />
was devoted d to the materi ial of RE fo or electrochhemical<br />
planar<br />
sensorss.<br />
For thhe<br />
first experimennt<br />
severa al Ag/AgC Cl screenn-printed<br />
and<br />
electrocchemically<br />
prepared planar p referrence<br />
electr rodes were fabricated and compa ared.<br />
356<br />
Brno<br />
Fig. 2 Designed D stri rip<br />
electrodes<br />
for electtrode<br />
size<br />
experim ment<br />
Fig. 3 Designed D sennsors<br />
for<br />
the electrode<br />
shapee<br />
experim ment
XI. WWorkshop<br />
of Phyysical<br />
Chemists and Electrocheemists<br />
´11<br />
Thee<br />
results (see<br />
Figure 4) 4 showed that the results r obta ained with h both com mmercial<br />
DuPPont<br />
pastees<br />
are very<br />
similar although the Ag/AgCl<br />
ratio is differen nt. The<br />
commparison<br />
wwith<br />
classic cal Ag/AgCCl<br />
referenc ce electrod de showed that the current<br />
respponse<br />
is commparable.<br />
Different D siituation<br />
wa as obtained d in compar arison of ha alf-wave<br />
poteentials,<br />
whhere<br />
was ob bserved thee<br />
potential shift in ra ange of ~ 1100<br />
mV. Th he half-<br />
wavve<br />
potentiaals<br />
of the el lectrochemmically<br />
fabri icated refer rence electrrodes<br />
were e similar<br />
to hhalf-wave<br />
ppotentials<br />
of<br />
the DuPoont<br />
polymer<br />
pastes. Th he current ddiffered<br />
jus st in the<br />
peakk<br />
current oof<br />
the redu uction proccess.<br />
Mentio oned result ts led us too<br />
decision that t the<br />
DuPPont<br />
pastess<br />
are the be est solutionn<br />
for constr ruction of planar p referrence<br />
electr rodes of<br />
TFTT<br />
sensors beecause<br />
of ve ery good annd<br />
reproduc cible respon nse.<br />
Second eexperiment<br />
t was devooted<br />
to the influence investigatiion<br />
of geom metrical<br />
sizee<br />
of reference<br />
and auxiliary<br />
electrrodes<br />
to the<br />
sensor an nodic outpuut<br />
current response r<br />
andd<br />
wave poteential.<br />
It wa as found thaat<br />
the depe endence of output currrent<br />
respon nse with<br />
the change off<br />
RE area size s had neegative<br />
grad dient in co omparison wwith<br />
our previous p<br />
resuults.<br />
The ccurrent<br />
res sponse deppendence<br />
with w the change<br />
of AAE<br />
area size<br />
was<br />
incrreasing.<br />
Thhe<br />
size of AE A was probbably<br />
chose en badly an nd it needs to be meas sured in<br />
widder<br />
range oof<br />
AE area sizes in thee<br />
next experiments,<br />
but b it couldd<br />
be expect ted that<br />
withh<br />
next incrrement<br />
of the<br />
AE size,<br />
the curren nt will be stabilized s at a fixed va alue due<br />
to mmaximum<br />
ccurrent<br />
den nsity passing<br />
through WE. W The in nfluences oof<br />
RE and AE A areas<br />
sizees<br />
to anodicc<br />
wave pote ential was aalmost<br />
negli igible in bo oth cases.<br />
The thirrd<br />
experim ment was ddevoted<br />
to the influe ence invest stigation of f sensor<br />
elecctrode<br />
area shape with h the fixed geometrica al area size of all three<br />
electrode es to the<br />
senssor<br />
anodicc<br />
output cu urrent respponse<br />
and wave pot tential. Thhe<br />
highest current<br />
respponse<br />
and rreproducibi<br />
ility was acchieved<br />
with<br />
the sens sor numberr<br />
S4 (see Fi igure 5).<br />
Thee<br />
lowest cuurrent<br />
respo onse with a relative good g reprod ducibility wwas<br />
achieved<br />
with<br />
the sensor S1 that repre esents commmonly<br />
used d rounded shape of tthe<br />
electrod de area.<br />
Connsidering<br />
soome<br />
kind of o error for the first se et of electro odes, the chhange<br />
of ha alf wave<br />
poteential<br />
was aalmost<br />
inde ependent onn<br />
the shape e of electrod de area.<br />
Fig. 4 All measured<br />
refe erence electrrodes<br />
mmaterials<br />
commparison<br />
with h standard AAg/AgCl<br />
electrod de<br />
357<br />
I [µA]<br />
9<br />
8<br />
7<br />
6<br />
5<br />
4<br />
3<br />
2<br />
1<br />
0<br />
1<br />
S 1<br />
S 5<br />
S 2 S 3<br />
S 6 S 7<br />
2 3 4<br />
S 4<br />
Set # [-]<br />
Brno<br />
Fig. F 5 Depend dence of outp tput current response r<br />
on the shap pe of the sennsor<br />
electrod de area<br />
5
XI. Workshop of Physical Chemists and Electrochemists ´11 Brno<br />
4. CONCLUSION<br />
The optimization of planar three-electrode system was studied in this work<br />
including material for reference electrodes fabrication, shape and geometrical size of<br />
the electrodes. All obtained results, conclusions and recommendations are mentioned<br />
in previous section.<br />
5. ACKNOWLEDGEMENT<br />
Funding for this work was provided by the Grant agency of the Czech Republic<br />
under the contracts GACR 102/08/1546, and Czech Ministry of Education in the<br />
frame of Research Plan MSM 0021630503 MIKROSYN<br />
6. REFERENCES<br />
[1] Prasek, J., et al.: 33rd International Spring Seminar on Electronics Technology, 2010, pp. 1-4<br />
[2] Lanz, M., et al.: Journal of Photochemistry and Photobiology A: Chemistry, 1999, 120, pp. 105-<br />
117<br />
358
XI. Workshop of Physical Chemists and Electrochemists ´11 Brno<br />
OBSAH<br />
ELECTROCHEMISTRY OF METALLOTHIONEINS ........................................................................ 7<br />
ELECTROCHEMISTRY IN SPACE ................................................................................................ 12<br />
ANATOMICAL STUDY OF VEGETATIVE ORGANS OF RHUS HIRTA (L.) SUDW.<br />
(ANACARDIACEAE) ...................................................................................................................... 17<br />
ANATOMICAL STUDY OF VEGETATIVE ORGANS OF PHARMACEUTICALLY AND<br />
TOXICOLOGICALLY IMPORTANT PLANT ACONITUM NAPELLUS L. EM. SKALICKY<br />
(RANUNCULACEAE) ..................................................................................................................... 24<br />
ANATOMICAL STUDY OF PHARMACEUTICALLY IMPORTANT PLANT MACLURA POMIFERA<br />
(RAF.) C.K. SCHNEID. (MORACEAE) ........................................................................................... 31<br />
VOLTAMMETRIC MONITORING OF RIBOFLAVIN REDUCTION ON MERCURY MENISCUS<br />
MODIFIED SILVER SOLID AMALGAM ELECTRODE ................................................................... 38<br />
PHOTOINDUCED OXYGEN ACTIVATION IN THE PRESENCE OF 4-ANILINOQUINAZOLINES<br />
........................................................................................................................................................ 42<br />
ELECTROCHEMICAL DETECTION OF RNA USING A COMPLEX OF SIX-VALENT OSMIUM .. 46<br />
THE SPECTROSCOPIC STUDY OF PHOTOINDUCED REACTIONS OF N-HETEROCYCLIC<br />
COMPOUNDS ................................................................................................................................ 49<br />
TECHNICAL SOLUTION OF PLANET EXPLORATION ................................................................ 53<br />
ELECTROCHEMICAL DATA FROM SPACE .................................................................................. 56<br />
SPECTROPHOTOMETRIC ACID-BASE CHARACTERIZATION OF ADENINE ANALOGUES ... 59<br />
ROBOTIC MODULE EURYDICE ................................................................................................... 62<br />
CHEMORESITANCE OF CANCER CELLS- MODELS FOR STUDY IN VITRO AND IN VIVO .... 67<br />
PROCESSING OF ELECTROCHEMICAL SIGNALS FOR DETERMINATION OF<br />
METALLOTHIONEIN CONCENTRATION ...................................................................................... 70<br />
STRUCTURE AND MAGNETISM OF CLEAN AND IMPURITY-DECORATED GRAIN<br />
BOUNDARIES IN NICKEL FROM FIRST PRINCIPLES ................................................................ 74<br />
USE OF LIGAND STEP GRADIENT FOCUSING IN COMBINATION WITH<br />
ISOTACHOPHORESIS (LSGF-ITP) FOR THE EFFECTIVE PRE-CONCENTRATION AND<br />
ANALYSIS OF HEAVY METALS .................................................................................................... 78<br />
LIGNITE – A LOW QUALITY SOLID FUEL WITH ATTRACTIVE SORPTION ABILITIES ............. 81<br />
APPLICATIONS OF IRON OXIDE NANOPARTICLES .................................................................. 85<br />
EXPRESSING OF BACTERIAL DIHYDRODIPICOLINATE SYNTHASE IN GRAIN OF<br />
TRANSGENIC BARLEY ................................................................................................................. 89<br />
DETERMINATION PROSTATE SPECIFIC ANTIGEN AND TESTOSTERONE IN TUMOUR CELL<br />
LINES WITH ENCORE ZINC AND SARCOSINE AS WELL AS IN PROSTATE CANCER<br />
PATIENTS ....................................................................................................................................... 95<br />
FABRICATION AND CHARACTERIZATION OF TIO2 QUANTUM DOTS ARRAY ...................... 101<br />
DETERMINATION OF SARCOSINE AS POSSIBLE TUMOUR MARKER OF PROSTATE<br />
TUMOURS AND ROUTINE BIOCHEMICAL TESTS IN URINE SAMPLES ................................ 105<br />
PHOTOCURRENT GENERATION IN INKJET PRINTED TIO2 LAYERS .................................... 111<br />
OPTICAL SPECTROSCOPY IN MODERN BIOPHYSICAL RESEARCH ................................... 115<br />
AN ELECTROCHEMICAL SPM UNDER FULL ENVIRONMENTAL CONTROL ......................... 118<br />
359
XI. Workshop of Physical Chemists and Electrochemists ´11 Brno<br />
HEAVY METALS IN PROSTATE CANCER CELL LINES ............................................................. 119<br />
NEW POSSIBILITIES IN FUNCTIONALIZATION AND LABELING OF DNA FOR<br />
ELECTROCHEMICAL ANALYSIS ............................................................................................... 125<br />
REVIEW OF ELECTROREDUCTION OF HYDROGEN IONS ON MERCURY .......................... 128<br />
QUANTUM DOTS WITH FUNCTIONALIZED SHELL LAYERS FOR ENHANCED<br />
BIOCONJUGATION AND FLUOROIMMUNOASSAYS ............................................................... 129<br />
USING OF TEMPLATES BASE METHOD FOR FARICATION OF NANORODS STRUCTURES<br />
FOR ELECTROCHEMICALSENZING ELEMENTS .................................................................... 133<br />
TRENDS IN CHEMICAL SENSORS ............................................................................................ 137<br />
NANOTECHNOLOGY FOR SENSORS AND DIAGNOSIS ......................................................... 140<br />
ELECTROCHEMICAL ANALYSIS OF DNA AND CADMIUM IONS INTERACTION ................... 144<br />
FABRICATION OF COPPER MICROPARTICLES BASED WORKING ELECTRODES FOR<br />
ELECTROCHEMICAL DETECTION OF ADENINE ..................................................................... 148<br />
PREPARATION OF WATER SOLUBLE GLUTATHIONE-COATED CDTE QUANTUM DOTS ... 152<br />
APPLICATION OF CITP FOR BIOMINERAL ANALYSIS ............................................................ 156<br />
UTILIZATION OF FRACTIONAL EXTRACTION FOR CHARACTERIZATION OF THE<br />
INTERACTIONS BETWEEN HUMIC ACIDS AND METALS ....................................................... 158<br />
MONITORING OF STRESS MARKERS IN MAIZE (ZEA MAYS L.) EXPOSED TO CADMIUM<br />
AND ZINC IONS .......................................................................................................................... 162<br />
SYNDROM OF NEWLY FILLED RESERVOIR FROM THE MERCURY POINT OF VIEW ........ 168<br />
UTILIZATION OF TOTAL ANTIOXIDANT CAPACITY TO EVALUATE THE EFFECT OF<br />
MULTIWALL CARBON NANOTUBES AND MAGNETIC NANOPARTICLES ON SUSPENSION<br />
TOBACCO CULTURE .................................................................................................................. 171<br />
EPR AND UV-VIS SPECTROELECTROCHEMICAL STUDIES OF NOVEL SYNTHESIZED<br />
COPPER, NICKEL AND COBALT-BASED COMPLEX DERIVATIVES ....................................... 174<br />
VARIOUS MICROWAVE DIGESTION PROCEDURE OF SAMPLES FOR HEAVY METALS<br />
ELECTROCHEMICAL DETERMINATION ................................................................................... 177<br />
ELECTROCHEMICAL DETERMINATION OF HEAVY METALS IN RAINWATER ...................... 182<br />
ELECTROCHEMICAL DETERMINATION OF MT1 AND MT2 ISOFORMS ................................ 185<br />
INFLUENCE OF PTCL4 ON MAIZE AND PEA ............................................................................ 190<br />
PLATINUM GROUPS ELEMENTS AND THEIR INFLUENCE ON PEA SEEDLINGS ................ 193<br />
UTILIZATION OF ELECTROCHEMICAL METHODS IN STUDIES OF TRANSPORTING<br />
PROCESSES ACROSS THE PHOSPHOLIPID BILAYERS ........................................................ 196<br />
OPTICAL CHARACTERIZATION OF ORGANIC SEMI-CONDUCTORS .................................... 200<br />
ELECTROCHEMISTRY OF BIOMACROMOLECULES. TRENDS IN PROTEIN ANALYSIS ..... 203<br />
THE STUDY OF 6 – BENZYLAMINOPURINE AND ITS DERIVATIVES BY ELECTROCHEMICAL<br />
AND SPECTRAL METHODS ....................................................................................................... 207<br />
SPRAY-COATED WORKING ELECTRODES FOR ELECTROCHEMICAL SENSORS ............. 213<br />
IMPROVEMENT OF SENSING PROPERIES OF THE THICK-FILM ELECTROCHEMICAL<br />
SENSORS BY SPECIFICATION MEASUREMENT WITH THE ROTATING VESSEL CELL ...... 217<br />
FLUORO/NITRO DERIVATIVES OF QUINOLONES: THEORETICAL AND SPECTROSCOPIC<br />
STUDY ......................................................................................................................................... 221<br />
360
XI. Workshop of Physical Chemists and Electrochemists ´11 Brno<br />
THIOPHENOLS: ENERGETICS OF S–H BOND CLEAVAGE ..................................................... 225<br />
ANALYSIS OF METALLOTHIONEIN ISOFORMS BY CAPILLARY ELECTROPHORESIS ........ 228<br />
ANALYSIS OF SARCOSINE BY CAPILLARY ELECTROPHORESIS ......................................... 233<br />
LAB-ON-CHIP: STATE OF THE ART ........................................................................................... 237<br />
THIN FILM HYDROGEN SENSOR BASED ON DIKETOPYRROLO-PYRROLES ANALOGUES<br />
...................................................................................................................................................... 239<br />
INSTRUMENT FOR FLUORESCENT BIOSENSOR ................................................................... 243<br />
NOVEL REACTIVITY – MAPPING TECHNIQUE FOR CHARACTERIZATION OF<br />
POLYELECTROLYTE BIOPOLYMERS ....................................................................................... 246<br />
DPPH AQUEOUS ANTIOXIDANT ASSAY SOLUTION ................................................................ 250<br />
QUANTUM CHEMICAL CALCULATIONS OF [LI(DMSO) N] + COMPLEXES ............................... 255<br />
ANALYSIS OF THIOL COMPOUNDS AND ANTIOXIDANT ACTIVITY IN PATIENTS SUFFERING<br />
FROM MALIGNANT DISEASE .................................................................................................... 259<br />
ANTIOXIDANT ACTIVITY OF TUMOUR CELL AND EFFECT OF CYTOSTATICS ON<br />
ANTIOXIDANT STATUS ............................................................................................................... 264<br />
ELECTROCHEMICAL ANODIZATION AS TOOL FOR NANOSTRUCTURES FORMATION ..... 268<br />
THE IMPACT OF SELECTED PLATUM GROUP ELEMENTS ON ANTIOXIDANT ACTIVITY OF<br />
DUCKWEED (LEMNA MINO L.) ................................................................................................. 272<br />
IMPORTANCE OF DIFFERENTIAL PULSE VOLTAMMOGRAMS FOR STUDYING OF<br />
BIOLOGICAL IMPORTANT PHENOMENONS ............................................................................ 276<br />
ELECTROCHEMICAL BEHAVIUOR OF (PRP C ) AND CHANGED (PRP SC ) PRION PROTEIN .. 279<br />
ELECTROCHEMICAL BIOSENSOR FOR DETECTION OF BIOAGENTS ................................. 282<br />
ELECTROANALYSIS WITH NON-MERCURY METAL-MODIFIED CARBON PASTE<br />
ELECTRODES IN THE NEW MILLENNIUM ................................................................................ 284<br />
ELECTROCHEMISTRY OF OSMIUM(VI)-MODIFIED CARBOHYDRATES ................................ 287<br />
ADSORPTIVE STRIPPING ELIMINATION VOLTAMMETRY ...................................................... 290<br />
THEORETICAL STUDY OF N–H BOND DISSOCIATION ENTHALPIES IN PARA SUBSTITUTED<br />
ANILINES ..................................................................................................................................... 294<br />
SOFTWARE FOR PROCESSING OF CATALYTIC METALLOTHIONEIN SIGNALS .................. 297<br />
MATERIALS FOR ORGANIC ELECTRONICS ............................................................................ 301<br />
DEVELOPMENT OF OPTICAL SENSORS BASED ON COMPLEXES OF MACROCYCLIC<br />
COMPOUNDS .............................................................................................................................. 305<br />
MONITORING DNA MODIFICATION BY PLATINUM COMPLEXES USING CATALYTIC<br />
HYDROGEN EVOLUTION AT MERCURY ELECTRODES ......................................................... 309<br />
SYNTHESIS AND CHARACTERIZATION OF NANOPARTICLES OF SN-3,5AG-0,5ZN ........... 313<br />
ELECTROCHEMICAL DETERMINATION OF BIOLOGICALLY ACTIVE COMPOUNDS ............ 317<br />
SPECTROFOTOMETRIC ANALYSIS OF CYSTEINE-CADMIUM COMPLEXES USING<br />
MUREXIDE INDICATOR .............................................................................................................. 322<br />
DETERMINATION OF LACTOFERRINE IN HUMAN SALIVA ..................................................... 327<br />
EMPLOYMENT OF HPLC WITH COULOMETRIC DETECTION FOR ANALYSIS OF<br />
PHYTOCHELATIN SYNTHASE ACTIVITY .................................................................................. 332<br />
361
XI. Workshop of Physical Chemists and Electrochemists ´11 Brno<br />
FAST AND ROBUST METHOD FOR DETECTION COPPER AND CADMIUM IONS BY FLOW<br />
INJECTION METHOD WITH AMPEROMTRIC DETECTION ..................................................... 336<br />
IMPLEMENTATION OF WATERRING MEASUREMENT TO ENVIRONMENT MONITOR<br />
SYSTEM ....................................................................................................................................... 340<br />
TOXIC METALS IN BRNO URBAN SOILS AND THE PLANTS OF COMMON DANDELION<br />
(TARAXACUM OFFICINALE) ...................................................................................................... 344<br />
LANTHANUM 3+ - A NEW PHOSPHATE CHELATOR USED IN CHRONIC KIDNEY DISEASE -<br />
POTENTS APOPTOSIS IN PC-3 AND 22RV1 PROSTATE CANCER CELL LINES AND IN<br />
HEALTHY PROSTATE CELLS PNT1A ........................................................................................ 350<br />
OPTIMIZATION OF PLANAR THREE-ELECTRODES SYSTEMS FOR ELECTROCHEMICAL<br />
APPLICATIONS ........................................................................................................................... 355<br />
OBSAH ......................................................................................................................................... 359<br />
AUTORSKÝ REJSTŘÍK ............................................................................................................... 363<br />
POZNÁMKY ................................................................................................................................. 366<br />
SEZNAM ÚČASTNÍKŮ XI. PRACOVNÍHO SETKÁNÍ FYZIKÁLNÍCH CHEMIKŮ A<br />
ELEKTROCHEMIKŮ .................................................................................................................... 367<br />
PODĚKOVÁNÍ OBCHODNÍM SPOLEČNOSTEM ZA SPONZOROVÁNÍ XI. SETKÁNÍ<br />
FYZIKÁLNÍCH CHEMIKŮ A ELEKTROCHEMIKŮ:...................................................................... 370<br />
362
XI. Workshop of Physical Chemists and Electrochemists ´11 Brno<br />
AUTORSKÝ REJSTŘÍK<br />
Vojtěch ADAM 7, 12, 17, 24, 32, 57, 63,<br />
120, 145, 153, 163, 172, 191, 194, 229,<br />
251, 260, 265, 273, 277, 280, 323, 328,<br />
333, 337<br />
Petr BABULA ..... 17, 24, 32, 90, 96, 106,<br />
120, 260, 265, 350<br />
Jana BALÁŽIKOVÁ ............................ 43<br />
Zdeňka BALCAROVÁ ...................... 208<br />
Lenka BANDŽUCHOVÁ ................... 39<br />
Zuzana BARBIERIKOVÁ ................... 43<br />
Jiří BAREK ........................................ 318<br />
Martin BARTOŠÍK ............. 47, 204, 288<br />
Miroslava BEKLOVÁ ....... 191, 194, 273,<br />
277, 280, 333<br />
Šárka BIDMANOVÁ ........................ 244<br />
Ondřej BLASTIK ................................... 7<br />
Miroslava BOBENIČOVÁ .................. 50<br />
Martin BREZA .................................. 256<br />
Vlasta BREZOVÁ ....................... 43, 222<br />
Pavel BUČEK ...................................... 60<br />
Petra BUŠÍNOVÁ . 82, 86, 134, 149, 214<br />
Natalia CERNEI ... 90, 96, 106, 163, 194,<br />
234<br />
Hana ČERNOCKÁ ............................ 204<br />
Hana DEJMKOVÁ ............................ 318<br />
Hana DOČEKALOVÁ ...................... 344<br />
Jana DRBOHLAVOVÁ ..... 102, 134, 153<br />
Dana DVORANOVÁ .................. 50, 222<br />
Jiří DVOŘÁČEK ............................... 298<br />
Petr DZIK .......................................... 112<br />
Tomáš ECKSCHLAGER ............. 68, 265<br />
Ivo FABRIK .......................................... 7<br />
363<br />
Tomáš FESSL ..................................... 116<br />
Nuria FERROL .................................. 337<br />
Miroslav FOJTA ........................ 126, 310<br />
Fiona FREHILL ................................. 119<br />
Lenka GAJDOVÁ ............................. 169<br />
Petr GALUSZKA ................................ 90<br />
Eliška GLOVINOVÁ .......................... 79<br />
Jaromír GUMULEC ... 96, 106, 120, 260,<br />
350<br />
Tereza HÁJKOVÁ ............................ 229<br />
Wendy A. HARWOOD ..................... 90<br />
Luděk HAVRAN ....................... 126, 310<br />
Patricie HEINRICHOVÁ ................. 201<br />
Michael HEYROVSKÝ ..................... 129<br />
Antonín HLAVÁČEK ....................... 130<br />
Marian HLAVNA ..................... 120, 350<br />
Michal HOCEK ................................. 126<br />
Sylvie HOLUBOVÁ .......................... 208<br />
Petra HORÁKOVÁ .................. 126, 310<br />
Roman Hrabec .................................. 120<br />
Jan Hraběta.......................................... 68<br />
Zuzana HRDINOVÁ ........................ 172<br />
Radim HRDÝ .................................... 134<br />
Jaromír HUBÁLEK .... 12, 54, 57, 63, 82,<br />
86, 102, 134, 138, 141, 149, 153, 229,<br />
238, 244, 269, 280, 341<br />
Dalibor Hůska ........................... 145, 280<br />
David HYNEK .. 163, 178, 183, 186, 191,<br />
194<br />
Jana CHOMOUCKÁ .. 86, 134, 149, 153,<br />
214<br />
Michal Ilčin ....................................... 256
XI. Workshop of Physical Chemists and Electrochemists ´11 Brno<br />
Soňa JANTOVÁ .................................. 43<br />
Libor JANU ....................................... 153<br />
Zdeňka Jarolímová ............................ 157<br />
Ondřej JAŠEK ................................... 172<br />
Michal KALINA ................................ 159<br />
Anne-Marie KELTERER .................. 222<br />
Renata KENSOVÁ ............................ 169<br />
René KIZEK 7, 12, 17, 24, 32, 57, 63, 71,<br />
90, 96, 106, 120, 141, 145, 153, 163,<br />
172, 178, 183, 186, 191, 194, 229, 234,<br />
238, 251, 260, 265, 273, 277, 280, 298,<br />
323, 328, 333, 337, 341<br />
Andrea KLECKEROVÁ .................... 163<br />
Andrea KLECKEROVÁ .................... 344<br />
Erik KLEIN ........................ 222, 226, 295<br />
Martin KLIMEK ................................ 298<br />
Martina KLUČÁKOVÁ ............ 159, 247<br />
Anna KORVASOVÁ ........................... 17<br />
Kamila KRUŽÍKOVÁ ....................... 169<br />
Olga KRYŠTOFOVÁ 163, 172, 191, 194,<br />
333<br />
Sona KRÍŽKOVA ...................... 120, 172<br />
Vladimíra KUBICOVÁ ....................... 71<br />
Vít KUDRLE ..................................... 172<br />
Šárka KUCHTICKOVÁ .................... 120<br />
Simona KVAŠŇÁKOVÁ ..................... 24<br />
Jiří LITZMAN ................................... 328<br />
Přemysl LUBAL ................................ 157<br />
Přemysl LUBAL .................. 60, 157, 306<br />
Vladimír LUKEŠ ....... 222, 226, 256, 295<br />
Hana MACÍČKOVÁ-CAHOVÁ ...... 126<br />
Petr MAJZLÍK 7, 71, 178, 183, 186, 229,<br />
280, 298<br />
364<br />
Vladimír MAREČEK ........................ 197<br />
Michal MASAŘÍK ...... 96, 106, 120, 234,<br />
260, 350<br />
Ester MEJSTRIKOVÁ ....................... 328<br />
Miguel-Ángel MERLOS ................... 337<br />
Břetislav MIKEL ............................... 244<br />
Hana Mikulášková .................... 191, 194<br />
Magdalena Morozová ....................... 112<br />
Katarina MRIZOVÁ ........................... 90<br />
Tomáš NAVRÁTIL ........................... 197<br />
Petra NETROUFALOVÁ ................... 60<br />
Lenka NOVÁKOVÁ ......................... 277<br />
Ludmila OHNOUTKOVÁ .................. 90<br />
Veronika OSTNATÁ ........................ 204<br />
Imad OUZZANE ............................... 201<br />
Emil PALEČEK ................... 47, 204, 288<br />
Miloslav PEKAŘ ................................. 82<br />
Jitka PETRLOVÁ .................................. 7<br />
Iveta PILAŘOVÁ .............................. 208<br />
Hana PIVOŇKOVÁ ................. 126, 310<br />
Kristýna PLEVOVÁ ............................ 50<br />
Jitka POLJAKOVÁ ............................. 68<br />
Jan POSPÍCHAL ................................. 79<br />
Jan PRÁŠEK ...... 134, 149, 214, 218, 355<br />
Zbyněk PROKOP ............................. 244<br />
Ivo PROVAZNÍK ........ 71, 229, 251, 298<br />
Jan PŘIBYL ....................................... 283<br />
Kraiwan PUNYAIN .......................... 222<br />
Zdenek PYTLÍČEK ........................... 218<br />
M.A. RAHMAN .................................. 68<br />
Tereza REICHLOVÁ ........................ 186<br />
Ján RIMARČÍK ................. 222, 226, 295
XI. Workshop of Physical Chemists and Electrochemists ´11 Brno<br />
Lenka ROTTMANNOVÁ ......... 226, 295<br />
Arne ROVNÝ .................................... 120<br />
Markéta RYVOLOVÁ ..... 153, 229, 234,<br />
238<br />
Ota SALYK ........................................ 240<br />
Jiří SedlÁČek ..................................... 244<br />
Petr SEDLÁČEK ....................... 159, 247<br />
Karel SEDLÁŘ ................................... 251<br />
Núria SERRANO ............................... 208<br />
Eliška SISPEROVA ............................. 79<br />
Sylvie SKALÍČKOVA ....................... 328<br />
Petr SKLÁDAL .......................... 130, 283<br />
Vladimír SLÁDEK ............................ 256<br />
Jan SLAVÍK ....................................... 145<br />
Mark A. SMEDLEY ............................ 90<br />
Kristýna SMERKOVÁ ...................... 251<br />
Jiří SMILEK ....................................... 247<br />
Jiří SOCHOR ...... 96, 106, 172, 251, 260,<br />
265, 273, 323, 328<br />
Dmitry SOLOVEI ............................. 102<br />
Dmitry SOLOVEI ..................... 102, 269<br />
Jíří SOPOUŠEK ................................. 314<br />
Ivana SOUKUPOVÁ ......................... 273<br />
Marie STIBOROVÁ .................... 68, 265<br />
Lenka STRAKOVÁ ........................... 273<br />
Klára SUCHÁNKOVÁ ...................... 314<br />
Zdeňka SVOBODOVÁ ..................... 169<br />
Markéta SZTALMACHOVÁ .... 120, 350<br />
Michaela ŠEBKOVÁ ......................... 344<br />
Martin ŠEDINA ................................ 201<br />
Renáta ŠELEŠOVSKÁ ......................... 39<br />
Ivana ŠESTÁKOVÁ .......................... 197<br />
365<br />
David Škoda ...................................... 314<br />
Helena ŠKUTKOVÁ ......................... 251<br />
Mojmír ŠOB ........................................ 75<br />
Pavlína ŠOBROVÁ ...... 7, 163, 191, 194,<br />
277, 280, 333<br />
Olga ŠTĚPÁNKOVÁ ........................ 277<br />
Eva ŠVÁBENSKÁ ............................. 283<br />
Ivan Švancara .................................... 285<br />
Jana TABAČIAROVÁ ........................ 50<br />
Jana TKADLEČKOVÁ ........................ 32<br />
Mojmír TREFULKA ........... 47, 204, 288<br />
Libuše TRNKOVÁ . 7, 60, 145, 149, 208,<br />
291<br />
Adam VAGÁNEK ..................... 226, 295<br />
Martin Vala ....................................... 201<br />
Martin VALLA .................... 71, 298, 302<br />
Jakub VANĚK ................................... 306<br />
Jana VAŠKOVÁ .................................. 90<br />
Michal VESELÝ ................................ 112<br />
Pavlína VIDLÁKOVÁ ...................... 310<br />
Marcela VLKOVA ............................ 328<br />
Marina VOROZHTSOVÁ ................ 134<br />
Milan VRÁBEL ................................. 126<br />
Monika VŠIANSKÁ ............................ 75<br />
Vít VYKOUKAL ............................... 314<br />
Jan VYŇUCHAL ............................... 240<br />
Libor VYSLOUŽIL ............................ 172<br />
Martin WEITER ....................... 201, 302<br />
Josef ZEHNÁLEK ............................. 333<br />
Jiří ZIMA ........................................... 318<br />
Ondřej ZÍTKA ...... 90, 96, 106, 260, 323,<br />
328, 333, 337<br />
Jaromír ŽÁK ...................................... 341
XI. Workshop of Physical Chemists and Electrochemists ´11 Brno<br />
POZNÁMKY<br />
366
XI. Workshop of Physical Chemists and Electrochemists ´11 Brno<br />
SEZNAM ÚČASTNÍKŮ<br />
XI. PRACOVNÍHO SETKÁNÍ FYZIKÁLNÍCH CHEMIKŮ A<br />
ELEKTROCHEMIKŮ<br />
Adam Vojtěch<br />
Ústav chemie a biochemie, Fakulta agronomická, MENDELU Brno, Zemědělská 1, 613 00 Brno<br />
Bandžuchová Lenka<br />
Ústav environmentálního a chemického inženýrství, Fakulta chemicko-technologická, Univerzita<br />
Pardubice, Studentská 95, 532 10 Pardubice<br />
Barbieriková Zuzana<br />
Institute of Physical Chemistry and Chemical Physics, Slovak University of Technology in Bratislava,<br />
Radlinského 9, 812 37 Bratislava, Slovakia<br />
Bartošík Martin<br />
Biofyzikální ústav AV ČR, v.v.i., Královopolská 135, 612 65 Brno<br />
Bittová Miroslava<br />
Ústav chemie, PřF MU v Brně, Kotlářská 2, 611 37 Brno<br />
Bobeničová Miroslava<br />
Institute of Physical Chemistry and Chemical Physics, Slovak University of Technology in Bratislava,<br />
Radlinského 9, 812 37 Bratislava, Slovakia<br />
Buček Pavel<br />
Ústav chemie, PřF MU v Brně, Kotlářská 2, 611 37 Brno<br />
Cernei Natalia<br />
Ústav chemie a biochemie, Fakulta agronomická, MENDELU Brno, Zemědělská 1, 613 00 Brno<br />
Dzik Petr<br />
Ústav fyzikální a spotřební chemie, Fakulta chemická VUT v Brně, Purkyňova 118, 612 00 Brno<br />
Tomáš Fessl<br />
Institute of Physical Biology, University of South Bohemia, Zamek 136, Nove Hrady<br />
Frehill Fiona<br />
Agilent Technologies, 610 Wharfedale Road, IQ Winnersh, Wokingham, Berkshire, RG41 5TP, UK<br />
Gumulec Jaromír<br />
Ústav chemie a biochemie, Fakulta agronomická, MENDELU Brno, Zemědělská 1, 613 00 Brno<br />
Hasoň Stanislav<br />
Biofyzikální ústav AV ČR, v.v.i., Královopolská 135, 612 65 Brno<br />
Havran Luděk<br />
Biofyzikální ústav AV ČR, v.v.i., Královopolská 135, 612 65 Brno<br />
Heyrovský Michael<br />
Ústav fyzikální chemie J. Heyrovského AV ČR, Dolejškova 3, 182 23 Praha 8<br />
Hlaváček Antonín<br />
Ústav biochemie, PřF MU v Brně, Kotlářská 2, 611 37 Brno<br />
Húska Dalibor<br />
Ústav chemie a biochemie, Fakulta agronomická, MENDELU Brno, Zemědělská 1, 613 00 Brno<br />
Janů Libor<br />
Ústav chemie a biochemie, Fakulta agronomická, MENDELU Brno, Zemědělská 1, 613 00 Brno<br />
Jarolímová Zdeňka<br />
Ústav chemie, PřF MU v Brně, Kotlářská 2, 611 37 Brno<br />
Kalina Michal<br />
Fakulta chemická VUT v Brně, Ústav fyzikální a spotřební chemie, Purkyňova 118, 612 00 Brno<br />
Kizek René<br />
Ústav chemie a biochemie, Fakulta agronomická, MENDELU Brno, Zemědělská 1, 613 00 Brno<br />
Klein Erik<br />
367
XI. Workshop of Physical Chemists and Electrochemists ´11 Brno<br />
Institute of Physical Chemistry and Chemical Physics, Slovak University of Technology in Bratislava,<br />
Radlinského 9, 812 37 Bratislava, Slovakia<br />
Koudelka Petr<br />
Ústav chemie a biochemie, Fakulta agronomická, MENDELU Brno, Zemědělská 1, 613 00 Brno<br />
Kryštofová Olga<br />
Ústav chemie a biochemie, Fakulta agronomická, MENDELU Brno, Zemědělská 1, 613 00 Brno<br />
Křížková Soňa<br />
Ústav chemie a biochemie, Fakulta agronomická, MENDELU Brno, Zemědělská 1, 613 00 Brno<br />
Lubal Přemysl<br />
Ústav chemie, PřF MU v Brně, Kotlářská 2, 611 37 Brno<br />
Lušpai Karol<br />
Institute of Physical Chemistry and Chemical Physics, Slovak University of Technology in Bratislava,<br />
Radlinského 9, 812 37 Bratislava, Slovakia<br />
Navrátil Tomáš<br />
Ústav fyzikální chemie J. Heyrovského AV ČR, Dolejškova 3, 182 23 Praha 8<br />
Ouzzane Imad<br />
Ústav fyzikální a spotřební chemie, Fakulta chemická, VUT Brno, Purkyňova 118, 612 00 Brno<br />
Paleček Emil<br />
Biofyzikální ústav AV ČR, v.v.i., Královopolská 135, 612 65 Brno<br />
Pilařová Iveta<br />
Ústav chemie, PřF MU v Brně, Kotlářská 2, 611 37 Brno<br />
Pouch Milan<br />
Ústav chemie a biochemie, Fakulta agronomická, MENDELU Brno, Zemědělská 1, 613 00 Brno<br />
Rimarčík Ján<br />
Institute of Physical Chemistry and Chemical Physics, Slovak University of Technology in Bratislava,<br />
Radlinského 9, 812 37 Bratislava, Slovakia<br />
Rottmannová Lenka<br />
Institute of Physical Chemistry and Chemical Physics, Slovak University of Technology in Bratislava,<br />
Radlinského 9, 812 37 Bratislava, Slovakia<br />
Ruttkay - Nedecký Branislav<br />
Ústav chemie a biochemie, Fakulta agronomická, MENDELU Brno, Zemědělská 1, 613 00 Brno<br />
Ryvolová Markéta<br />
Ústav chemie a biochemie, Fakulta agronomická, MENDELU Brno, Zemědělská 1, 613 00 Brno<br />
Salyk Ota<br />
Ústav fyzikální a spotřební chemie, Fakulta chemická, VUT Brno, Purkyňova 118, 612 00 Brno<br />
Sedláček Petr<br />
Ústav fyzikální a spotřební chemie, Fakulta chemická VUT v Brně, Purkyňova 118, 612 00 Brno<br />
Sládek Vladimír<br />
Institute of Physical Chemistry and Chemical Physics, Slovak University of Technology in Bratislava,<br />
Radlinského 9, 812 37 Bratislava, Slovakia<br />
Sochor Jiří<br />
Ústav šlechtění a množení zahradnických rostlin, Fakulta zahradnická, MENDELU Brno, Valtická 337, 691<br />
44 Lednice<br />
Sztalmachová Martina<br />
Ústav chemie a biochemie, Fakulta agronomická, MENDELU Brno, Zemědělská 1, 613 00 Brno<br />
Šob Mojmír<br />
Ústav chemie, PřF MU v Brně, Kotlářská 2, 611 37 Brno<br />
Šobrová Pavlína<br />
Ústav chemie a biochemie, Fakulta agronomická, MENDELU Brno, Zemědělská 1, 613 00 Brno<br />
Švábenská Eva<br />
VOP-026 Šternberk,s.p.,VTÚO Brno Division, Czech Republic<br />
368
XI. Workshop of Physical Chemists and Electrochemists ´11 Brno<br />
Švancara Ivan<br />
Katedra analytické chemie, Fakulta chemicko-technologická, Univerzita Pardubice, Studentská 95, 532 10<br />
Pardubice<br />
Novotná Kamila<br />
Ústav veřejného veterinárního lékařství a toxikologie, FVHE, VFU Brno, Palackého 1/3, 612 42<br />
Trefulka Mojmír<br />
Biofyzikální ústav AV ČR, v.v.i., Královopolská 135, 612 65 Brno<br />
Trnková Libuše<br />
Ústav chemie, PřF MU v Brně, Kotlářská 2, 611 37 Brno<br />
Vagánek Adam<br />
Institute of Physical Chemistry and Chemical Physics, Slovak University of Technology in Bratislava,<br />
Radlinského 9, 812 37 Bratislava, Slovakia<br />
Vala Martin<br />
Ústav fyzikální a spotřební chemie, Fakulta chemická VUT v Brně, Purkyňova 118, 612 00 Brno<br />
Vaněk Jakub<br />
Ústav chemie, PřF MU v Brně, Kotlářská 2, 611 37 Brno<br />
Vidláková Pavlína<br />
Biofyzikální ústav AV ČR, v.v.i., Královopolská 135, 612 65 Brno<br />
Vykoukal Vít<br />
Zima Jiří<br />
Katedra analytické chemie, PřF, UK v Praze, Hlavova 8,128 43 Praha 2<br />
Zítka Ondřej<br />
Ústav chemie a biochemie, Fakulta agronomická, MENDELU Brno, Zemědělská 1, 613 00 Brno<br />
369
XI. Workshop of Physical Chemists and Electrochemists ´11 Brno<br />
PODĚKOVÁNÍ OBCHODNÍM SPOLEČNOSTEM ZA SPONZOROVÁNÍ<br />
XI. SETKÁNÍ FYZIKÁLNÍCH CHEMIKŮ A<br />
ELEKTROCHEMIKŮ:<br />
ANTON PAAR, organizační složka, Bělohorská<br />
85, 169 00 Praha 6 - Břevnov<br />
http://www.anton-paar.cz/<br />
Výroba přístrojů pro aplikace ve výzkumných,<br />
vývojových, provozních a průmyslových<br />
pracovištích<br />
BECKMAN COULTER, Radiová 1, 102 27<br />
Praha,<br />
http://www.immunotech.cz/services.htm<br />
BIO-RAD, Nad ostrovem 1119/7, 147 00<br />
Praha 4<br />
www.qcnet.com/cz<br />
Prodej laboratorních přístrojů<br />
BVT TECHNOLOGIES, Hudcova 78c, 612 00<br />
BRNO<br />
www.bvt.cz<br />
Vývoj a výroba biosenzorů<br />
CLONESTAR PEPTIDE SERVICES, s. r. o.<br />
Křižíkova 70, 612 00 Brno<br />
http://www.clonestar.cz/<br />
Zakázková syntéza peptidů<br />
ENVINET a.s. Modřínová 1094 674 01 Třebíč<br />
www.envinet.cz<br />
Výrobce a dodavatel měřicích a informačních<br />
systémů pro energetiku a průmyslovou<br />
automatizaci.<br />
EPPENDORF Czech&Slovakia, Kolovratská<br />
1476, 251 01 Říčany u Prahy<br />
http://www.eppendorf.cz/<br />
Prodej laboratorní techniky<br />
H Test Šafránkova 1243/3, 155 00 Praha-<br />
Stodůlky<br />
www.htest.cz<br />
Autorizovaný dovozce měřicí techniky Agilent<br />
do ČR a SR<br />
CHROMSERVIS s. r. o. Jakobiho 327, 109 00<br />
Praha 10 – Petrovice http://chromservis.cz/cz<br />
Prodej měřicí a regulační techniky se<br />
specializací na chromatografii a techniku pro<br />
sledování kvality životního a pracovního<br />
prostředí.<br />
370<br />
ChromSpec Jindřicha Plachty 28, 150 00 Praha<br />
www.chromspec.cz<br />
Přístrojová technika pro laboratoře<br />
LABOSERV Hudcova 532/78b, 612 00 Brno<br />
www.laboserv.cz<br />
Partner klinických laboratoří<br />
MANEKO, spol. s.r.o. Na Pískách 71, 16000<br />
Praha 6<br />
www.maneko.cz<br />
Laboratorní přístroje a technika<br />
MEDESA s.r.o., Na Vyšehradě 1092, 572 01<br />
Polička http://www.medesa.cz/<br />
Nabízíme kompletní vybavení klinických<br />
laboratoří.<br />
METROHM ČESKÁ REPUBLIKA S.R.O Na<br />
harfě 935/5c<br />
190 00 Praha 9<br />
www.metrohm.cz<br />
PRAGOLAB s.r.o. Nad Krocínkou 55, 19000<br />
Praha 9<br />
www.pragolab.cz<br />
Vybavení laboratoří – chemické, biologické,<br />
fyzikální<br />
RADANAL s. r. o., Okružní 613, 530 03<br />
Pardubice http://www.radanal.cz<br />
Vědecký výzkum a vzdělávání v oblasti<br />
aplikace přírodních věd Lifescience; výživa a<br />
zdravotní diagnostika<br />
SIGMA ALDRICH Sokolovská100/94, 186 00<br />
Praha 2<br />
http://www.sigmaaldrich.com/czechrepublic.html<br />
SCHOELLER INSTRUMENTS Vídeňská<br />
1398/124, 148 00 Praha<br />
www.schoeller.cz<br />
Prodej a servis laboratorní techniky a<br />
zdravotnických přístrojů<br />
TRIGON-PLUS Západní 93, 251 70 Čestlice<br />
www.trigon-plus.cz<br />
Řešení pro vaši laboratoř
XI. Workshop of Physical Chemists and Electrochemists ´11 Brno<br />
Sborník příspěvků<br />
XI. Pracovní setkání fyzikálních chemiků a elektrochemiků<br />
Uspořádala: Libuše Trnková<br />
Technická úprava: Sylvie Holubová, Petr Koudelka<br />
Vydala: Mendelova univerzita v Brně<br />
Tisk: Ediční středisko MENDELU v Brně<br />
První vydání, 2011¨<br />
Náklad<br />
ISBN 978‐80‐7375‐514‐0<br />
371
➤ Týmová spolupráce<br />
4 Měření hustoty & koncentrace<br />
4 Reometry a viskozimetry<br />
4 Příprava vzorků/mikrovlnné pece<br />
4 Měření CO 2 a O 2 v nápojích<br />
4 Mikrovlnná syntéza<br />
4 Elektrokinetická analýza<br />
4 X-ray strukturální analýza<br />
4 Vysoce přesné měření teploty<br />
4 Refraktometry a polarimetry<br />
Anton Paar GmbH<br />
organizační složka<br />
Česká republika/<br />
Slovenská republika<br />
Bělohorská 238/85<br />
169 00 Praha 6 - Břevnov<br />
CZECH REPUBLIC<br />
Tel.: +420 233 356 634<br />
Fax: +420 233 356 636<br />
info.cz@anton-paar.com<br />
info.sk@anton-paar.com<br />
www.anton-paar.cz<br />
www.anton-paar.sk<br />
210x297_basketball.indd 1 18.04.11 14:17
Pr ˇ ístroje a reagencie<br />
pro klinickou diagnostiku<br />
a biomedicínský výzkum<br />
Genetické<br />
analyzátory<br />
Automatizace<br />
Spektrofotometry<br />
a Readery<br />
Beckman Coulter Česká republika s.r.o.<br />
Murmanská 1475/4, 100 05 Praha 10 - Vršovice, www.beckman.cz<br />
Průtokové<br />
cytometry<br />
Centrifugy<br />
Analyzátory<br />
buněk
Electrochemical tools<br />
BVT Technologies, a.s.,<br />
Hudcova 533/78c<br />
612 00 Brno<br />
Czech Repulic<br />
info@bvt.cz<br />
www.bvt.cz<br />
We offer a wide range of Electrochemical Sensors<br />
TFT Sensor substrates<br />
destinated for amperometric and conductometric measurements and also biosensors with immobilized enzymes.<br />
The standard sensor formats are formed on alumina ceramics with different combinations of electrode materials.<br />
The sensor response can be measured using our Biosensor analyzer or any other suitable potentiostat. Our facility<br />
offer includes design and development of sensor formats depending on user specific needs. Long term R&D projects<br />
co-operations are welcomed also.<br />
AC1 The most often used three-electrode sensor. It has<br />
a working, reference and auxiliary electrode. AC1 sensor is<br />
used as a substrate for glucose oxidase or acetylcholine<br />
esterase biosensor preparation (AC1.GOD, AC1.AChE).<br />
AC3 Narrow single working electrode sensor designed<br />
as replacement of metal electrodes from expensive materials.<br />
AC5 Array of eight working electrodes, each electrode has its own reference electrode.<br />
It is possible to measure eight signals at once. One electrode can be a standard, other<br />
electrodes can be modified by antibodies, enzymes, DNA, etc. to get an assay for more<br />
target substances in one measurement.<br />
AC6 Electrochemical sensor with one working, one<br />
reference and two auxiliary electrodes.<br />
AC8 Electrochemical sensor with 4 working electrodes;<br />
some of them may be modified by enzyme, DNA, antibody,<br />
etc. for multianalyte detection.<br />
AC10 Electrochemical sensor with array of 20 working<br />
electrodes and one common reference electrode; it was<br />
designed for complicated complex analysis of 20 analytes<br />
in one step.<br />
AC2 Electrochemical sensor with two working electrodes<br />
and one reference electrode serves for differential<br />
measurement of two signals at once.<br />
AC4 Single working electrode sensor with bigger metal<br />
surface compared to AC3. It may serve for metal coating.<br />
AC7 This sensor is shorter version of AC1 for different<br />
connector – soldered pins.<br />
AC9 Electrochemical sensor with array of 8 working<br />
electrodes and one common reference electrode; it was<br />
designed as a substrate for biosensor for multianalyte<br />
detection.<br />
CC1 Conductivity measurement sensor with finger<br />
structure of electrodes<br />
CC2 Conductivity measurement sensor designed for<br />
differential measurements of conductivity on the background<br />
of another effect.
Electrochemical tools<br />
Pump<br />
Accessories for Electrochemical Sensors<br />
BVT produces a wide variety of electrochemical sensors using<br />
screen printing technology.<br />
MicroFlow System (MFS)<br />
Our Microflow System is designed to<br />
remove the conventional problems<br />
rising within the standard electrochemical<br />
measurement setup. The<br />
system allows noiseless stirring and regulated<br />
liquid flow onto the electrode surface, control of<br />
temperature and atmosphere. The sensor chamber<br />
design is suitable to our AC1 sensor formats<br />
and permits easy replacement of used substrates.<br />
The Microflow system is predominantly used for<br />
Batch Injection analysis.<br />
Flow Cell<br />
The flow cell enables the use of AC1, CC1 sensor in a flow<br />
through arrangement. The cell ensures the wall-jet flow<br />
around the working electrode. The cell contains also the<br />
contact and output cable.<br />
A range of micro-flow pumps designed and developed to provide you with low<br />
order flow rates (0,01 – 200 µl per minute). The pumps are extremely small in size<br />
and come with pre-defined as well as user changeable flow rates.<br />
Potentiostats<br />
BVT Bioanalyzer<br />
The Biosensor analyzer BA1 is a small<br />
compact amperometric analyzer designed<br />
for sensor and biosensors signal<br />
analysis. The device is equipped with<br />
sophisticated program for biosensors<br />
signals evaluation.<br />
Connector<br />
Cell<br />
Pump<br />
Connector<br />
Sensor<br />
Flow<br />
Potentiostats<br />
Micro Flow<br />
Systems<br />
The connector enables the use of the electrochemical<br />
sensors AC1, AC4, CC1, CC2 in classical electrochemical<br />
arrangement with<br />
stirred vessel.<br />
Cell<br />
Simple glass cell serves for<br />
electrochemical measurements<br />
employing our TFT sensors. Cell openings are<br />
designed for sensor connector and stirrer.<br />
PalmSens potentiostat<br />
the most compact portable potentiostat<br />
for all kinds of electrochemical sensors<br />
and cells. It can be configured for a single<br />
application but can also be used as a generic electrochemical<br />
instrument. PalmSens can be extended to a multichannel potentiostat.<br />
eDAQ potentiostat<br />
a four-channel potentiostat that can operate each channel<br />
independently in three electrode mode, or operate<br />
two (bipotentiostat), three or four working electrodes with a common<br />
reference and auxiliary electrode.
ZAKÁZKOVÁ SYNTÉZA PEPTIDŮ<br />
• Produkt v závislosti na sekvenci a množství v čistotě od 70 do 98 %<br />
• Kvalitativní analýza (MALDI-TOF,ESI)<br />
• Kvantitativní analýza (HPLC)<br />
• Purifi kace peptidu pomocí HPLC<br />
• Možnost modifi kace peptidu (fosforylace, biotinylace, acetylace,<br />
značení izotopem, FAM)<br />
• Možnost konjugace peptidu na proteiny KLH (BSA) přes glutaraldehyd<br />
nebo cystein (vhodné pro přípravu protilátek)<br />
• Dodací lhůty do 3 týdnů<br />
ZAKÁZKOVÁ VÝROBA<br />
PROTILÁTEK<br />
• Syntéza peptidu a následná konjugace na nosič (KLH, BSA)<br />
• Produkce polyklonálních protilátek v králících<br />
• Testování protilátek<br />
• Afi nitní purifi kace až 50 ml séra<br />
• Vzorek 5 -10 mg peptidů zdarma přiloženého k zásilce protilátky<br />
• Standardní dodání za 10-12 týdnů<br />
Clonestar<br />
Peptide Services s. r. o.<br />
Křižíkova 70, 612 00 Brno<br />
Tel.: 549 213 475<br />
GSM: 775 266 192, 775 266 191<br />
E-mail: brno@clonestar.cz<br />
www.clonestar.cz
Eppendorf Xplorer ®<br />
‡ Přehledný a barevný displej<br />
‡ Dobíjecí stojan<br />
‡ Twin.tec PCR Plate 96<br />
‡ Nová elektronická pipeta<br />
‡ Intuitivní ovládání a optimální ergonomie<br />
‡ Výběr z funkcí: pipetování, dávkování,<br />
automatické dávkování, pipetování + míchání<br />
‡ Vysoká reprodukovatelnost výsledků<br />
‡ Nízká hmotnost<br />
‡ Unikátní tlačítko pro nasávání / vypouštění<br />
‡ Pružný dolní konus pipety<br />
Více na: www.eppendorf.de/xplorer<br />
Nové produkty Eppendorf<br />
Eppendorf Xplorer ® – nová elektronická pipeta<br />
Novinky<br />
na trhu!<br />
Eppendorf twin.tec ® PCR Plates<br />
‡ Nové destičky dělitelné na 4 části po 24 jamkách<br />
‡ OptiTrak ® matrix: vysoce kontrastní<br />
alfanumerické značení<br />
‡ K dispozici s max. objemem 250 μl a 150 μl<br />
‡ Vhodné do ještě více termocyclerů<br />
‡ V provedení bezbarvé a modré<br />
‡ Balení 20 ks<br />
Více na: www.eppendorf.com/twintec<br />
Eppendorf Czech & Slovakia s.r.o. · Kolovratská 1476 · 251 01 Říčany u Prahy · Česká republika<br />
Tel./Fax.: +420 323 605 454 · E-mail: eppendorf@eppendorf.cz · www.eppendorf.cz<br />
Zastoupení na Slovensku:<br />
Eppendorf Czech & Slovakia s.r.o. - organizačná zložka · Prírodovedecká fakulta UK v Bratislave · Mlynská dolina<br />
842 15 Bratislava · Slovenská republika · Mobil: +421 911 181 474 · E-mail: eppendorf@eppendorf.sk · www.eppendorf.sk
Technologie AFM/SPM mikroskopů<br />
umožňuje zobrazování v atomárním<br />
měřítku s rozlišením až na desetiny<br />
nanometrů. Zásadní výhodou těchto<br />
mikroskopů je, že vzorky lze zobrazovat v<br />
libovolných podmínkách. Je možné měřit<br />
při různých teplotách dle potřeb aplikace<br />
nebo dokonce i přímo v kapalinách.<br />
AFM mikroskopie<br />
Agilent Technologies<br />
Společnost H TEST a.s. je výhradním distributorem Nanomeasurement Division Agilent<br />
Technologies, která zahrnuje AFM mikroskopii a nanoindentory.<br />
H TEST a.s.<br />
Šafránkova 3<br />
155 00 Praha 5<br />
Tel: 235 365 207<br />
info@htest.cz<br />
www.agilent.com/find/nano<br />
5500 AFM/SPM<br />
AFM mikroskop Agilent 5500 je vrcholný<br />
víceúčelový výzkumný mikroskopický systém<br />
pro AFM a SPM. Modulární koncepce<br />
této série dovoluje jednoduchou integraci<br />
stojanu pro velké vzorky až 150x200mm<br />
(LS), invertovaného mikroskopu (ILM),<br />
skenerů pro malé i velké zobrazované<br />
plochy, adaptérů pro uchycení vzorků,<br />
soupravy pro elektrochemii nebo videomikroskopu.
110415_chromservis_letak_Dani_SHS_CZ_fin.indd 1 21.4.2011 12:23:21
110415_chromservis_letak_Dani_SHS_CZ_fin.indd 2 21.4.2011 12:23:28
•<br />
•<br />
•<br />
•<br />
•<br />
•<br />
AKCE KINETEX<br />
2011<br />
Výběr z fází C18, XB-C18, PFP, C8 a HILIC<br />
Částice 2,6 µm pro systémy do 600 barů,<br />
částice 1,7 µm pro systémy do 1000 barů.<br />
Separační účinnost až až 300 000 teoretických pater.<br />
Nové Nové rozměry.<br />
Až 14× rychlejší analýzy, vyšší citlivost a a rozlišení<br />
Výrazné zvýšení výkonu výkonu a produktivity v laboratoři<br />
PLATNOST NABÍDKY<br />
DO 30. 6. 2011<br />
PHENOMENEX GUARANTEE<br />
SLEVA 20%<br />
PŘI ZAKOUPENÍ JEDNÉ KOLONY KINETEX<br />
SLEVA 30%<br />
PŘI ZAKOUPENÍ DVOU KOLON KINETEX<br />
Pokud kolony Kinetex s pevným jádrem a porézním<br />
povrchem neposkytnou nejlepší výsledky v LC<br />
technologiích, které jste kdy<br />
používali, zašlete nám data<br />
porovnávající srovnatelný<br />
VYŽÁDEJTE SI<br />
produkt do 40 dnů<br />
CENOVOU NABÍDKU NABÍDKU<br />
a PONECHEJTE SI KOLONU<br />
ZDARMA.<br />
Chromservis s.r.o., Jakobiho 327, 109 00 Praha 10 - Petrovice, www.chromservis.cz, tel: +420 274 021 211<br />
Chromservis SK s.r.o., Nobelova 34, 831 02 Bratislava, www.chromservis-sk.sk, tel: +421 911 181 098
ORGANICKÁ ROZPOUŠTĚDLA A KINETEX<br />
2.6 µm<br />
<br />
Rozpouštědlo<br />
RADY A TIPY<br />
Existuje několik kritických parametrů (viz tabulka dole), které je potřeba vzít v úvahu při výběru vhodného organického<br />
rozpouštědla použitého jako mobilní fáze pro kolony Kinetex. Jednou z nejdůležitějších vlastností je viskozita rozpouštědla,<br />
protože solventy s vysokou viskozitou mohou vyvolat v HPLC systému příliš velký protitlak. Dalšími důležitými vlastnostmi rozpouštědel<br />
jsou UV cuttoff, náklady a index polarity. Rozpouštědlo s vysokým UV cutoff bude mít za následek nízkou citlivost<br />
při použití UV/VIS detekce. Rozpouštědla s nízkým indexem polarity mají zpravidla rychlejší eluci organických sloučenin a jsou<br />
běžně používány pro čištění kolon.<br />
• Acetonitril je pravděpodobně nejlepším organickým rozpouštědlem, protože ve směsi s vodou dává nejnižší protitlak systému<br />
a má také velmi nízký UV cutoff a tím lepší UV/Vis citlivost detekce.<br />
• Metanol je další populární organické rozpouštědlo, protože má srovnatelnou eluční sílu s acetonitrilem, má relativně nízkou<br />
UV absorbanci, a je levnější než acetonitril. Hlavní nevýhodou metanolu, a to zejména při použití malých zrn fáze, je to,<br />
že jeho používání může vést k protitlaku, který překračuje mnohé limity HPLC systémů.<br />
• Aceton je méně běžně používané rozpouštědlo, protože má vysokou UV absorbanci, ale může být úspěšně použit, pokud<br />
analyty absorbují při vyšších vlnových délkách nebo v případě použití jiných typů detektorů jako např. MS. Má podobné<br />
eluční vlastnosti jako acetonitril.<br />
• Etanol se obecně nedoporučuje, protože vede k velmi vysokému protitlaku ve směsi s vodou.<br />
• Iso-, n-propanol mají poměrně velkou eluční sílu a jsou nejběžněji používány k čištění kolon při nízkých průtocích, protože<br />
rovněž dávají v systému vysoký protitlak.<br />
• Tetrahydrofuran má podobnou eluční sílu jako n-propanol.<br />
*Přibližná hodnota tlaku směsi s vodou (50/50) na koloně Kinetex 150 mm × 4,6 mm při<br />
průtoku 1,2 ml/min (20 °C)<br />
1.7 µm<br />
Bližší informace o výrobcích najdete na našich webových stránkách www.chromservis.cz nebo se informujte u našich regionálních zástupců.<br />
Tato nabídka platí do 30. 6. 2011 a nemůže být kombinována s jinými slevami. Cenovou nabídku a bližší informace o nabízených produktech si prosím<br />
vyžádejte prostřednictvím e-mailu prodej@chromservis.cz, nebo predaj@chromservis-sk.sk. Obrázky jsou pouze ilustrativní.<br />
<br />
Viskozita<br />
[cP]<br />
Zpětný tlak<br />
[bar]*<br />
Index<br />
polarity<br />
UV cutoff<br />
[nm]<br />
Acetonitril 0,37 200 5,8 190<br />
Metanol 0,60 390 5,1 205<br />
Aceton 0,32 325 5,1 330<br />
Etanol 1,20 630 5,2 210<br />
n-Propanol 2,27 650 3,9 210<br />
Tetrahydrofuran 0,55 430 4,0 215<br />
Chromservis s.r.o., Jakobiho 327, 109 00 Praha 10 - Petrovice, www.chromservis.cz, tel: +420 274 021 211<br />
Chromservis SK s.r.o., Nobelova 34, 831 02 Bratislava, www.chromservis-sk.sk, tel: +421 911 181 098
NABÍDKA SPEKTROFOTOMETRŮ<br />
Dvoupaprskové UV/Vis spektrofotometry s chlazenými<br />
polovodičovými. SPECORDPlus 250 pro nejnáročnější<br />
aplikace a pro měření opticky hustých suspenzí a<br />
zakalených vzorků.<br />
• detektor s chlazením - CDD (Cooled Double Detection)<br />
• speciální pozice pro měření zakalených vzorků<br />
• monochromátor s vysokým rozlišením (štěrbina 1,4 nm<br />
nebo nastavitelná. Optické prvky Zeiss<br />
• zabudovaný holmiový filtr pro kontrolu vlnových délek<br />
• rychlost měření spekter až 6000 nm/min<br />
• rychlé kinetiky 3D<br />
CHROMSPEC spol. s r.o.<br />
PURELAB flex<br />
AstraGene Life Sciences Spectrophotometer je<br />
spektrofotometrický systém s vláknovou optikou<br />
určený pro rutinní analýzu nukleových kyselin a<br />
bílkovin. Se speciálním držákem umožňuje analýzu<br />
vzorků o objemu od 2 µl přímo ve špičce automatické<br />
pipety s optickou dráhou 1 mm. Změřený vzorek tak<br />
lze použít pro další analýzy bez nebezpečí jeho<br />
kontaminace a odpadá i čištění mikrokyvet či<br />
vlastního spektrometru. Tento unikátní postup šetří<br />
drahocenné vzorky i čas při rutinních analýzách.<br />
Se spektrofotometrem AstraGene je dodávána i<br />
elektronická mikropipeta se špičkami vyrobenými ze<br />
speciálního polymeru propustného pro UV záření.<br />
Mníšek pod Brdy, 252 10, Lhotecká 594<br />
tel.: 318 599 083<br />
fax: 318 591 529<br />
analytikjena<br />
Jednotka pro přípravu ultračisté vody je určena pro<br />
dočištění předupravené vody. Špičková kvalita zajišťuje<br />
resistivitu výstupní vody 18,2 MΩcm a záchyt širokého<br />
spektra organických nečistot.<br />
Pro zajištění nízké úrovně bakteriálního znečištění a<br />
nízkých hodnot TOC je model PURELAB flex vybaven<br />
fotochemickým reaktorem s krátkým UV zářením.<br />
SPOL. S R.O.<br />
SPECORD Plus<br />
AstraGene<br />
email: info@chromspec.cz<br />
www.chromspec.cz
Maneko, spol. s r. o.<br />
Na Pískách 71<br />
160 00 Praha 6<br />
www.maneko.cz<br />
Katalogy zasíláme zdarma<br />
Fax:<br />
233 335 638-9<br />
233 336 579<br />
233 332 656
Metrohm Česká republika s.r.o.<br />
Na Harfě 935/5c Telefon: 00420 246 063 433<br />
190 00 Praha 9 Fax: 00420 246 063 468<br />
Web: www.metrohm.cz<br />
Titrace, iontová chromatografie, elektrochemie…<br />
Kompletní řada iontových analýz pod jednou střechou<br />
Naše firma se specializuje v oblastech přístrojového vybavení<br />
pro:<br />
- iontové analýzy zastoupené produkty firmy Metrohm AG,<br />
- elektrochemie a elektroanalytiky zastoupené firmou<br />
Metrohm Autolab<br />
- aplikované iontové analýzy v průmyslu zastoupené firmou<br />
Applikon.<br />
Naše přístroje jsou široce<br />
využívány v oblastech chemického<br />
průmyslu, petrochemie, farmacie,<br />
potravinářství, analýzy vody a vzduchu a v neposlední<br />
řadě ve vědě a výzkumu.<br />
Metrohm Quality Service ®<br />
Online přístup ke stovkám aplikací<br />
Jen to nejlepší řešení je dost dobré pro Vaše<br />
aplikace!<br />
Kvalifikované poradenství, důvěryhodný servis a nejvyšší<br />
kvalita nám umožnili získat vedoucí postavení na trhu.<br />
Odborníci po celém světě se snaží zajistit, aby tomu tak<br />
bylo i nadále.<br />
Aplikace jsou seřazeny do následujících kategorií:<br />
•Průmysl: Automobilový, biochemický, biopaliva…<br />
•Metody: titrace, iontová chromatografie a další<br />
•Standardy jako jsou ASTM, ISO, DIN,…<br />
•Validační pokyny pro Metrohm zařízení<br />
•Aplikační literatura: Metrohm aplikační bulletiny,<br />
poznámky, články, monografie a technické postery<br />
Spolehlivé výsledky měření po celou dobu životnosti Vašeho přístroje<br />
Bez ohledu na to zda provádíte analýzu vody s<br />
přístrojem 850 Professional IC, prvkovou analýzu s VA,<br />
analýzu lázní se systémy ProcessLab nebo určujete<br />
obsah vody v léčivech s použitím Karl Fischerovy<br />
titrace - Metrohm Quality Service ® zajistí, že se<br />
můžete na 100% spolehnout na Vaše výsledky, a to po<br />
celou dobu životnosti Vašeho přístroje.
VÝROBKY NEJVYŠŠÍ KVALITY<br />
Mrazící boxy - 40°C, - 86°C, -152°C<br />
Lednice laboratorní, farmaceutické, transfúzní<br />
CO 2 inkubátory<br />
Chlazené inkubátory<br />
Autoklávy<br />
Sušárny<br />
www.schoeller.cz<br />
mail@schoeller.cz Tel.: 261 009 111 Fax: 244 470 745
VÝROBKY NEJVYŠŠÍ KVALITY<br />
Mrazící boxy - 40°C, - 86°C, -152°C<br />
Lednice laboratorní, farmaceutické, transfúzní<br />
CO 2 inkubátory<br />
Chlazené inkubátory<br />
Autoklávy<br />
Sušárny<br />
www.schoeller.cz<br />
mail@schoeller.cz Tel.: 261 009 111 Fax: 244 470 745
Breakthrough in HPLC performance!<br />
Ascentis Express Fused-Core HPLC columns<br />
Based on Fused-Core particle technology, Ascentis Express provides the benefi ts of high speed and<br />
high effi ciencies of sub-2 μm particles at much lower backpressures. Due to the high effi ciencies at<br />
low backpressures, Ascentis Express can benefi t both conventional HPLC users as well as UHPLC or<br />
other ultra pressure system users.<br />
Ascentis Express Extreme Performance benefi ts include:<br />
Double the effi ciencies of conventional 3 μm particles<br />
Equal effi ciencies of sub-2 μm columns at half of the backpressure<br />
Rugged design capable of high pressure operation<br />
Reduced solvent consumption<br />
https://www.sigmaaldrich.com/express<br />
Sigma-Aldrich spol. s r.o. Česká republika Tel.: +420 246 003 200 CZECustSV@ sial.com<br />
Slovensko Tel.: +421 02/555 71 562 SVKOrders@ sial.com<br />
sigma-aldrich.com<br />
12357--SIGMA--inz-ascentis--02.indd Bez názvu-1 1 1 15.4.2011 3.12.2009 12:28:32 12:28:329:41:02