Salinity situation statement Tweed River and Gnowergerup Brook
Salinity situation statement Tweed River and Gnowergerup Brook
Salinity situation statement Tweed River and Gnowergerup Brook

You also want an ePaper? Increase the reach of your titles
YUMPU automatically turns print PDFs into web optimized ePapers that Google loves.
<strong>Salinity</strong> <strong>situation</strong> <strong>statement</strong>: <strong>Tweed</strong> <strong>River</strong> & <strong>Gnowergerup</strong> <strong>Brook</strong> WRT 41 Water Resource Technical Series<br />
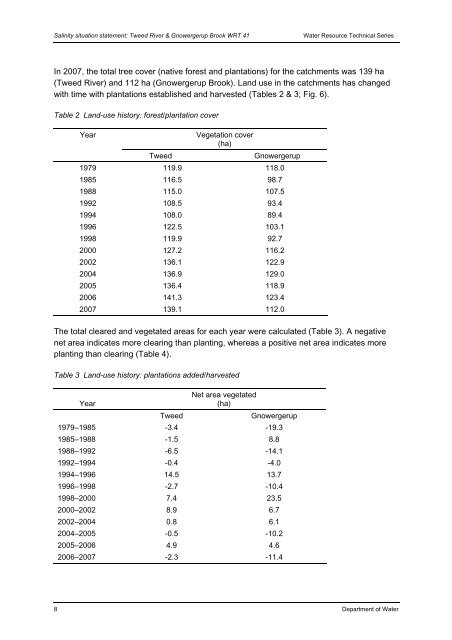
In 2007, the total tree cover (native forest <strong>and</strong> plantations) for the catchments was 139 ha<br />
(<strong>Tweed</strong> <strong>River</strong>) <strong>and</strong> 112 ha (<strong>Gnowergerup</strong> <strong>Brook</strong>). L<strong>and</strong> use in the catchments has changed<br />
with time with plantations established <strong>and</strong> harvested (Tables 2 & 3; Fig. 6).<br />
Table 2 L<strong>and</strong>-use history: forest/plantation cover<br />
Year Vegetation cover<br />
(ha)<br />
<strong>Tweed</strong> <strong>Gnowergerup</strong><br />
1979 119.9 118.0<br />
1985 116.5 98.7<br />
1988 115.0 107.5<br />
1992 108.5 93.4<br />
1994 108.0 89.4<br />
1996 122.5 103.1<br />
1998 119.9 92.7<br />
2000 127.2 116.2<br />
2002 136.1 122.9<br />
2004 136.9 129.0<br />
2005 136.4 118.9<br />
2006 141.3 123.4<br />
2007 139.1 112.0<br />
The total cleared <strong>and</strong> vegetated areas for each year were calculated (Table 3). A negative<br />
net area indicates more clearing than planting, whereas a positive net area indicates more<br />
planting than clearing (Table 4).<br />
Table 3 L<strong>and</strong>-use history: plantations added/harvested<br />
Year<br />
Net area vegetated<br />
(ha)<br />
<strong>Tweed</strong> <strong>Gnowergerup</strong><br />
1979–1985 -3.4 -19.3<br />
1985–1988 -1.5 8.8<br />
1988–1992 -6.5 -14.1<br />
1992–1994 -0.4 -4.0<br />
1994–1996 14.5 13.7<br />
1996–1998 -2.7 -10.4<br />
1998–2000 7.4 23.5<br />
2000–2002 8.9 6.7<br />
2002–2004 0.8 6.1<br />
2004–2005 -0.5 -10.2<br />
2005–2006 4.9 4.6<br />
2006–2007 -2.3 -11.4<br />
8 Department of Water