Salinity situation statement Tweed River and Gnowergerup Brook
Salinity situation statement Tweed River and Gnowergerup Brook
Salinity situation statement Tweed River and Gnowergerup Brook

Create successful ePaper yourself
Turn your PDF publications into a flip-book with our unique Google optimized e-Paper software.
<strong>Salinity</strong> <strong>situation</strong> <strong>statement</strong>: <strong>Tweed</strong> <strong>River</strong> & <strong>Gnowergerup</strong> <strong>Brook</strong> WRT 41 Water Resource Technical Series<br />
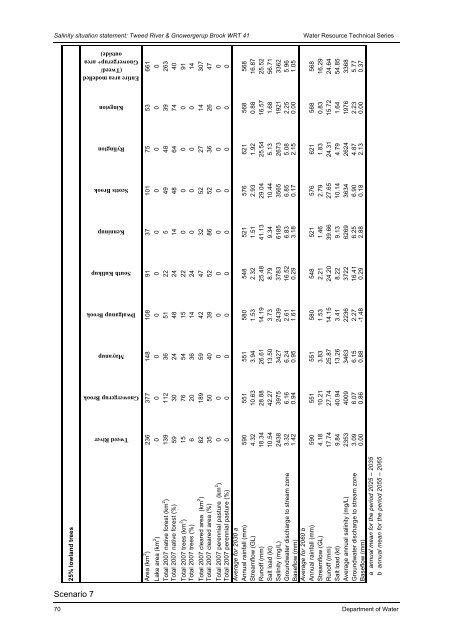
25% lowl<strong>and</strong> trees<br />
Scenario 7<br />
Entire area modelled<br />
(<strong>Tweed</strong>/<br />
<strong>Gnowergerup</strong>+ area<br />
outside)<br />
Kingston<br />
Rylington<br />
Scotts <strong>Brook</strong><br />
Kenninup<br />
South Kulikup<br />
Dwalganup <strong>Brook</strong><br />
Mayanup<br />
<strong>Gnowergerup</strong> <strong>Brook</strong><br />
<strong>Tweed</strong> <strong>River</strong><br />
Area (km 2 ) 236 377 148 108 91 37 101 75 53 661<br />
Lake area (km 2 ) 0 0 0 0 0 0 0 0 0 0<br />
Total 2007 native forest (km 2 ) 139 112 36 51 22 5 49 48 39 263<br />
Total 2007 native forest (%) 59 30 24 48 24 14 48 64 74 40<br />
Total 2007 trees (km 2 ) 15 76 54 15 22 0 0 0 0 91<br />
Total 2007 trees (%) 6 20 36 14 24 0 0 0 0 14<br />
Total 2007 cleared area (km 2 ) 82 189 59 42 47 32 52 27 14 307<br />
Total 2007 cleared area (%) 35 50 40 39 52 86 52 36 26 47<br />
Total 2007 perennial pasture (km 2 ) 0 0 0 0 0 0 0 0 0 0<br />
Total 2007 perennial pasture (%) 0 0 0 0 0 0 0 0 0 0<br />
Average for 2030 a<br />
Annual rainfall (mm) 590 551 551 580 548 521 576 621 568 568<br />
Streamflow (GL) 4.32 10.63 3.94 1.53 2.32 1.51 2.93 1.92 0.88 16.87<br />
Runoff (mm) 18.34 28.88 26.61 14.19 25.48 41.13 29.04 25.54 16.57 25.52<br />
Salt load (kt) 10.54 42.27 13.50 3.73 8.79 9.34 10.44 5.13 1.68 56.71<br />
<strong>Salinity</strong> (mg/L) 2438 3975 3427 2439 3783 6185 3565 2673 1921 3362<br />
Groundwater discharge to stream zone 3.32 6.16 6.24 2.61 16.52 6.83 6.85 5.08 2.25 5.96<br />
Baseflow (mm) 1.42 0.94 0.95 1.61 0.29 3.18 0.17 2.15 0.00 1.05<br />
Average for 2060 b<br />
Annual rainfall (mm) 590 551 551 580 548 521 576 621 568 568<br />
Streamflow (GL) 4.18 10.21 3.83 1.53 2.21 1.46 2.79 1.83 0.83 16.29<br />
Runoff (mm) 17.74 27.74 25.87 14.15 24.20 39.66 27.65 24.31 15.72 24.64<br />
Salt load (kt) 9.84 40.94 13.26 3.41 8.22 9.13 10.14 4.79 1.64 54.85<br />
Average annual salinity (mg/L) 2353 4009 3463 2236 3722 6269 3634 2624 1976 3368<br />
Groundwater discharge to stream zone 3.09 6.07 6.15 2.27 16.41 6.25 6.90 4.87 2.23 5.77<br />
Baseflow (mm) 0.00 0.86 0.88 -1.48 0.29 2.88 0.18 2.13 0.00 0.37<br />
a annual mean for the period 2025 – 2035<br />
b annual mean for the period 2055 – 2065<br />
70 Department of Water