Salinity situation statement Tweed River and Gnowergerup Brook
Salinity situation statement Tweed River and Gnowergerup Brook
Salinity situation statement Tweed River and Gnowergerup Brook

You also want an ePaper? Increase the reach of your titles
YUMPU automatically turns print PDFs into web optimized ePapers that Google loves.
<strong>Salinity</strong> <strong>situation</strong> <strong>statement</strong>: <strong>Tweed</strong> <strong>River</strong> & <strong>Gnowergerup</strong> <strong>Brook</strong> WRT 41 Water Resource Technical Series<br />
<strong>Salinity</strong> (mg/L)<br />
18000<br />
16000<br />
14000<br />
12000<br />
10000<br />
8000<br />
6000<br />
4000<br />
2000<br />
0<br />
Average monthly flow weighted salinity (1999 – 2006)<br />
Average monthly flow (1999 – 2006)<br />
Jan Feb Mar Apr May Jun Jul Aug Sept Oct Nov Dec<br />
Month<br />
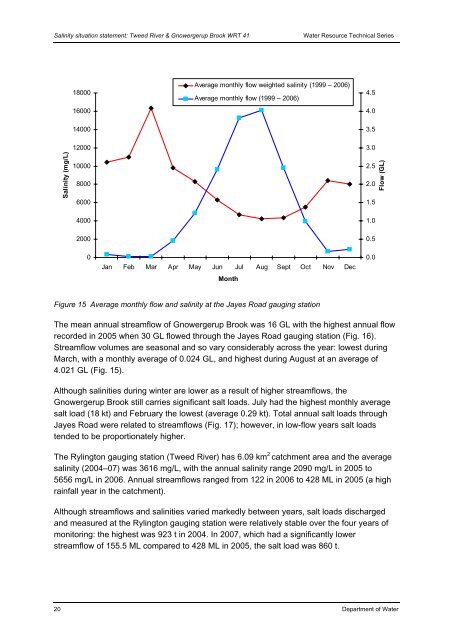
Figure 15 Average monthly flow <strong>and</strong> salinity at the Jayes Road gauging station<br />
The mean annual streamflow of <strong>Gnowergerup</strong> <strong>Brook</strong> was 16 GL with the highest annual flow<br />
recorded in 2005 when 30 GL flowed through the Jayes Road gauging station (Fig. 16).<br />
Streamflow volumes are seasonal <strong>and</strong> so vary considerably across the year: lowest during<br />
March, with a monthly average of 0.024 GL, <strong>and</strong> highest during August at an average of<br />
4.021 GL (Fig. 15).<br />
Although salinities during winter are lower as a result of higher streamflows, the<br />
<strong>Gnowergerup</strong> <strong>Brook</strong> still carries significant salt loads. July had the highest monthly average<br />
salt load (18 kt) <strong>and</strong> February the lowest (average 0.29 kt). Total annual salt loads through<br />
Jayes Road were related to streamflows (Fig. 17); however, in low-flow years salt loads<br />
tended to be proportionately higher.<br />
The Rylington gauging station (<strong>Tweed</strong> <strong>River</strong>) has 6.09 km 2 catchment area <strong>and</strong> the average<br />
salinity (2004–07) was 3616 mg/L, with the annual salinity range 2090 mg/L in 2005 to<br />
5656 mg/L in 2006. Annual streamflows ranged from 122 in 2006 to 428 ML in 2005 (a high<br />
rainfall year in the catchment).<br />
Although streamflows <strong>and</strong> salinities varied markedly between years, salt loads discharged<br />
<strong>and</strong> measured at the Rylington gauging station were relatively stable over the four years of<br />
monitoring: the highest was 923 t in 2004. In 2007, which had a significantly lower<br />
streamflow of 155.5 ML compared to 428 ML in 2005, the salt load was 860 t.<br />
20 Department of Water<br />
4.5<br />
4.0<br />
3.5<br />
3.0<br />
2.5<br />
2.0<br />
1.5<br />
1.0<br />
0.5<br />
0.0<br />
Flow (GL)