Salinity situation statement Tweed River and Gnowergerup Brook
Salinity situation statement Tweed River and Gnowergerup Brook
Salinity situation statement Tweed River and Gnowergerup Brook

Create successful ePaper yourself
Turn your PDF publications into a flip-book with our unique Google optimized e-Paper software.
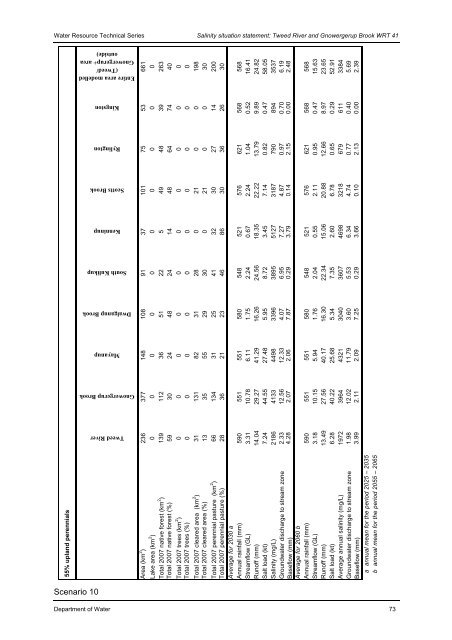
Water Resource Technical Series <strong>Salinity</strong> <strong>situation</strong> <strong>statement</strong>: <strong>Tweed</strong> <strong>River</strong> <strong>and</strong> <strong>Gnowergerup</strong> <strong>Brook</strong> WRT 41<br />
55% upl<strong>and</strong> perennials<br />
Scenario 10<br />
Entire area modelled<br />
(<strong>Tweed</strong>/<br />
<strong>Gnowergerup</strong>+ area<br />
outside)<br />
Kingston<br />
Rylington<br />
Scotts <strong>Brook</strong><br />
Kenninup<br />
South Kulikup<br />
Dwalganup <strong>Brook</strong><br />
Mayanup<br />
<strong>Gnowergerup</strong> <strong>Brook</strong><br />
<strong>Tweed</strong> <strong>River</strong><br />
Area (km 2 ) 236 377 148 108 91 37 101 75 53 661<br />
Lake area (km 2 ) 0 0 0 0 0 0 0 0 0 0<br />
Total 2007 native forest (km 2 ) 139 112 36 51 22 5 49 48 39 263<br />
Total 2007 native forest (%) 59 30 24 48 24 14 48 64 74 40<br />
Total 2007 trees (km 2 ) 0 0 0 0 0 0 0 0 0 0<br />
Total 2007 trees (%) 0 0 0 0 0 0 0 0 0 0<br />
Total 2007 cleared area (km 2 ) 31 131 82 31 28 0 21 0 0 198<br />
Total 2007 cleared area (%) 13 35 55 29 30 0 21 0 0 30<br />
Total 2007 perennial pasture (km 2 ) 66 134 31 25 41 32 30 27 14 200<br />
Total 2007 perennial pasture (%) 28 36 21 23 46 86 30 36 26 30<br />
Average for 2030 a<br />
Annual rainfall (mm) 590 551 551 580 548 521 576 621 568 568<br />
Streamflow (GL) 3.31 10.78 6.11 1.75 2.24 0.67 2.24 1.04 0.52 16.41<br />
Runoff (mm) 14.04 29.27 41.29 16.26 24.56 18.35 22.22 13.79 9.89 24.82<br />
Salt load (kt) 7.24 44.55 27.48 5.95 8.72 3.45 7.14 0.82 0.47 58.05<br />
<strong>Salinity</strong> (mg/L) 2186 4133 4498 3396 3895 5127 3187 790 894 3537<br />
Groundwater discharge to stream zone 2.33 12.56 12.33 4.07 6.95 7.27 4.87 0.97 0.70 6.19<br />
Baseflow (mm) 4.28 2.07 2.06 7.87 0.29 3.79 0.14 2.15 0.00 2.48<br />
Average for 2060 b<br />
Annual rainfall (mm) 590 551 551 580 548 521 576 621 568 568<br />
Streamflow (GL) 3.18 10.15 5.94 1.76 2.04 0.55 2.11 0.95 0.47 15.63<br />
Runoff (mm) 13.49 27.56 40.17 16.30 22.34 15.06 20.88 12.66 8.97 23.65<br />
Salt load (kt) 6.28 40.22 25.68 5.34 7.35 2.60 6.78 0.65 0.29 52.91<br />
Average annual salinity (mg/L) 1972 3964 4321 3040 3607 4698 3218 679 611 3384<br />
Groundwater discharge to stream zone 1.98 12.02 11.79 3.60 5.53 6.34 4.74 0.77 0.40 5.69<br />
Baseflow (mm) 3.99 2.11 2.09 7.25 0.29 3.66 0.10 2.13 0.00 2.39<br />
Department of Water 73<br />
a annual mean for the period 2025 – 2035<br />
b annual mean for the period 2055 – 2065