Salinity situation statement Tweed River and Gnowergerup Brook
Salinity situation statement Tweed River and Gnowergerup Brook
Salinity situation statement Tweed River and Gnowergerup Brook

You also want an ePaper? Increase the reach of your titles
YUMPU automatically turns print PDFs into web optimized ePapers that Google loves.
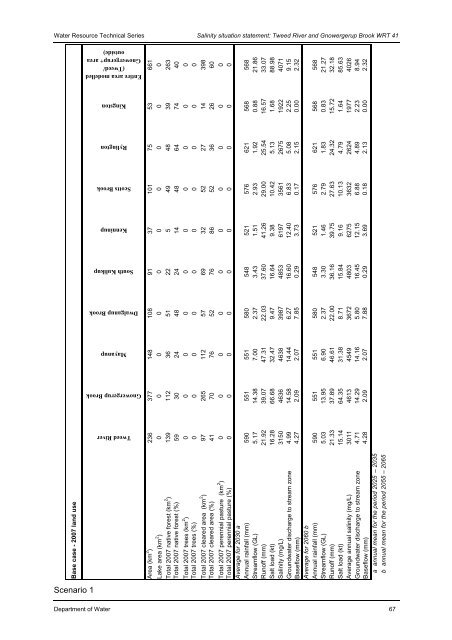
Water Resource Technical Series <strong>Salinity</strong> <strong>situation</strong> <strong>statement</strong>: <strong>Tweed</strong> <strong>River</strong> <strong>and</strong> <strong>Gnowergerup</strong> <strong>Brook</strong> WRT 41<br />
Base case - 2007 l<strong>and</strong> use<br />
Scenario 1<br />
Entire area modelled<br />
(<strong>Tweed</strong>/<br />
<strong>Gnowergerup</strong>+ area<br />
outside)<br />
Kingston<br />
Rylington<br />
Scotts <strong>Brook</strong><br />
Kenninup<br />
South Kulikup<br />
Dwalganup <strong>Brook</strong><br />
Mayanup<br />
<strong>Gnowergerup</strong> <strong>Brook</strong><br />
<strong>Tweed</strong> <strong>River</strong><br />
Area (km 2 ) 236 377 148 108 91 37 101 75 53 661<br />
Lake area (km 2 ) 0 0 0 0 0 0 0 0 0 0<br />
Total 2007 native forest (km 2 ) 139 112 36 51 22 5 49 48 39 263<br />
Total 2007 native forest (%) 59 30 24 48 24 14 48 64 74 40<br />
Total 2007 trees (km 2 ) 0 0 0 0 0 0 0 0 0 0<br />
Total 2007 trees (%) 0 0 0 0 0 0 0 0 0 0<br />
Total 2007 cleared area (km 2 ) 97 265 112 57 69 32 52 27 14 398<br />
Total 2007 cleared area (%) 41 70 76 52 76 86 52 36 26 60<br />
Total 2007 perennial pasture (km 2 ) 0 0 0 0 0 0 0 0 0 0<br />
Total 2007 perennial pasture (%) 0 0 0 0 0 0 0 0 0 0<br />
Average for 2030 a<br />
Annual rainfall (mm) 590 551 551 580 548 521 576 621 568 568<br />
Streamflow (GL) 5.17 14.38 7.00 2.37 3.43 1.51 2.93 1.92 0.88 21.86<br />
Runoff (mm) 21.92 39.07 47.31 22.03 37.60 41.26 29.00 25.54 16.57 33.07<br />
Salt load (kt) 16.28 66.68 32.47 9.47 16.64 9.38 10.42 5.13 1.68 88.98<br />
<strong>Salinity</strong> (mg/L) 3150 4636 4638 3987 4853 6197 3561 2675 1922 4071<br />
Groundwater discharge to stream zone 4.99 14.58 14.44 6.27 16.60 12.40 6.83 5.08 2.25 9.15<br />
Baseflow (mm) 4.27 2.09 2.07 7.85 0.29 3.73 0.17 2.15 0.00 2.32<br />
Average for 2060 b<br />
Annual rainfall (mm) 590 551 551 580 548 521 576 621 568 568<br />
Streamflow (GL) 5.03 13.95 6.90 2.37 3.30 1.46 2.79 1.83 0.83 21.27<br />
Runoff (mm) 21.33 37.89 46.61 22.00 36.16 39.75 27.63 24.32 15.72 32.18<br />
Salt load (kt) 15.14 64.35 31.38 8.71 15.84 9.16 10.13 4.79 1.64 85.63<br />
Average annual salinity (mg/L) 3011 4613 4549 3672 4803 6275 3632 2624 1977 4026<br />
Groundwater discharge to stream zone 4.71 14.29 14.16 5.80 16.45 12.15 6.88 4.89 2.23 8.94<br />
Baseflow (mm) 4.28 2.09 2.07 7.88 0.29 3.69 0.18 2.13 0.00 2.32<br />
Department of Water 67<br />
a annual mean for the period 2025 – 2035<br />
b annual mean for the period 2055 – 2065