Salinity situation statement Tweed River and Gnowergerup Brook
Salinity situation statement Tweed River and Gnowergerup Brook
Salinity situation statement Tweed River and Gnowergerup Brook

Create successful ePaper yourself
Turn your PDF publications into a flip-book with our unique Google optimized e-Paper software.
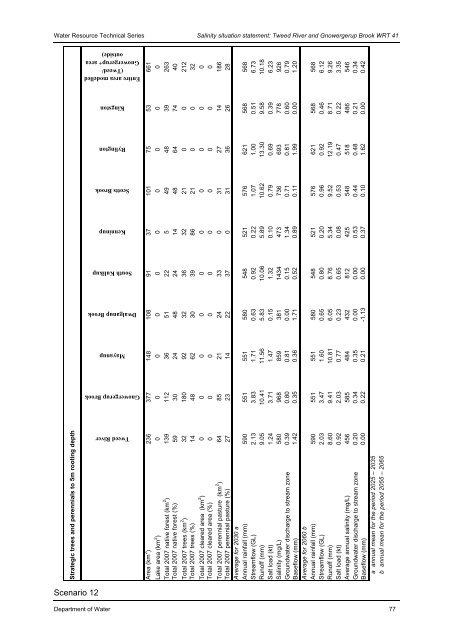
Water Resource Technical Series <strong>Salinity</strong> <strong>situation</strong> <strong>statement</strong>: <strong>Tweed</strong> <strong>River</strong> <strong>and</strong> <strong>Gnowergerup</strong> <strong>Brook</strong> WRT 41<br />
Strategic trees <strong>and</strong> perennials to 5m rooting depth<br />
Scenario 12<br />
Entire area modelled<br />
(<strong>Tweed</strong>/<br />
<strong>Gnowergerup</strong>+ area<br />
outside)<br />
Kingston<br />
Rylington<br />
Scotts <strong>Brook</strong><br />
Kenninup<br />
South Kulikup<br />
Dwalganup <strong>Brook</strong><br />
Mayanup<br />
<strong>Gnowergerup</strong> <strong>Brook</strong><br />
<strong>Tweed</strong> <strong>River</strong><br />
Area (km 2 ) 236 377 148 108 91 37 101 75 53 661<br />
Lake area (km 2 ) 0 0 0 0 0 0 0 0 0 0<br />
Total 2007 native forest (km 2 ) 139 112 36 51 22 5 49 48 39 263<br />
Total 2007 native forest (%) 59 30 24 48 24 14 48 64 74 40<br />
Total 2007 trees (km 2 ) 32 180 92 32 36 32 21 0 0 212<br />
Total 2007 trees (%) 14 48 62 30 39 86 21 0 0 32<br />
Total 2007 cleared area (km 2 ) 0 0 0 0 0 0 0 0 0 0<br />
Total 2007 cleared area (%) 0 0 0 0 0 0 0 0 0 0<br />
Total 2007 perennial pasture (km 2 ) 64 85 21 24 33 0 31 27 14 186<br />
Total 2007 perennial pasture (%) 27 23 14 22 37 0 31 36 26 28<br />
Average for 2030 a<br />
Annual rainfall (mm) 590 551 551 580 548 521 576 621 568 568<br />
Streamflow (GL) 2.13 3.83 1.71 0.63 0.92 0.22 1.07 1.00 0.51 6.73<br />
Runoff (mm) 9.05 10.41 11.56 5.83 10.06 5.89 10.62 13.30 9.58 10.18<br />
Salt load (kt) 1.24 3.71 1.47 0.15 1.32 0.10 0.79 0.69 0.39 6.23<br />
<strong>Salinity</strong> (mg/L) 580 968 859 381 1434 473 736 693 778 926<br />
Groundwater discharge to stream zone 0.39 0.80 0.81 0.00 0.15 1.34 0.71 0.81 0.60 0.79<br />
Baseflow (mm) 1.42 0.35 0.36 1.71 0.52 0.89 0.11 1.99 0.00 1.20<br />
Average for 2060 b<br />
Annual rainfall (mm) 590 551 551 580 548 521 576 621 568 568<br />
Streamflow (GL) 2.03 3.47 1.60 0.65 0.80 0.20 0.96 0.92 0.46 6.12<br />
Runoff (mm) 8.60 9.41 10.81 6.05 8.76 5.34 9.52 12.19 8.71 9.26<br />
Salt load (kt) 0.92 2.03 0.77 0.23 0.65 0.08 0.53 0.47 0.22 3.35<br />
Average annual salinity (mg/L) 456 585 484 432 812 425 548 518 486 546<br />
Groundwater discharge to stream zone 0.20 0.34 0.35 0.00 0.00 0.53 0.44 0.48 0.21 0.34<br />
Baseflow (mm) 0.00 0.22 0.21 -1.13 0.00 0.37 0.10 1.62 0.00 0.42<br />
Department of Water 77<br />
a annual mean for the period 2025 – 2035<br />
b annual mean for the period 2055 – 2065