Salinity situation statement Tweed River and Gnowergerup Brook
Salinity situation statement Tweed River and Gnowergerup Brook
Salinity situation statement Tweed River and Gnowergerup Brook

Create successful ePaper yourself
Turn your PDF publications into a flip-book with our unique Google optimized e-Paper software.
<strong>Salinity</strong> <strong>situation</strong> <strong>statement</strong>: <strong>Tweed</strong> <strong>River</strong> & <strong>Gnowergerup</strong> <strong>Brook</strong> WRT 41 Water Resource Technical Series<br />
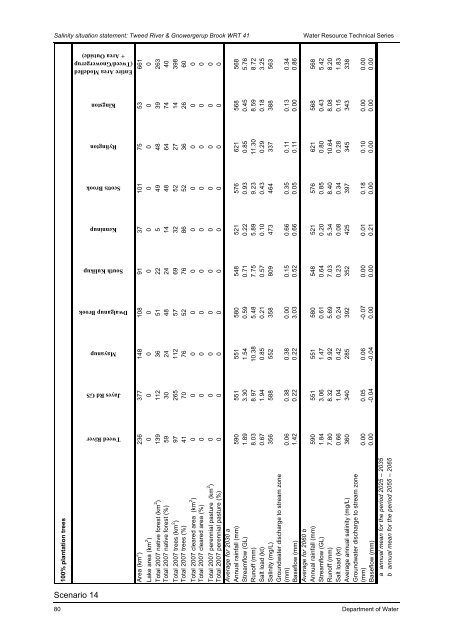
100% plantation trees<br />
Entire Area Modelled<br />
(<strong>Tweed</strong>/<strong>Gnowergerup</strong><br />
+ Area Outside)<br />
Scenario 14<br />
Kingston<br />
Rylington<br />
Scotts <strong>Brook</strong><br />
Kenninup<br />
South Kulikup<br />
Dwalganup <strong>Brook</strong><br />
Mayanup<br />
Jayes Rd GS<br />
<strong>Tweed</strong> <strong>River</strong><br />
Area (km 2 ) 236 377 148 108 91 37 101 75 53 661<br />
Lake area (km 2 ) 0 0 0 0 0 0 0 0 0 0<br />
Total 2007 native forest (km 2 ) 139 112 36 51 22 5 49 48 39 263<br />
Total 2007 native forest (%) 59 30 24 48 24 14 48 64 74 40<br />
Total 2007 trees (km 2 ) 97 265 112 57 69 32 52 27 14 398<br />
Total 2007 trees (%) 41 70 76 52 76 86 52 36 26 60<br />
Total 2007 cleared area (km 2 ) 0 0 0 0 0 0 0 0 0 0<br />
Total 2007 cleared area (%) 0 0 0 0 0 0 0 0 0 0<br />
Total 2007 perennial pasture (km 2 ) 0 0 0 0 0 0 0 0 0 0<br />
Total 2007 perennial pasture (%) 0 0 0 0 0 0 0 0 0 0<br />
Average for 2030 a<br />
Annual rainfall (mm) 590 551 551 580 548 521 576 621 568 568<br />
Streamflow (GL) 1.89 3.30 1.54 0.59 0.71 0.22 0.93 0.85 0.45 5.76<br />
Runoff (mm) 8.03 8.97 10.38 5.48 7.75 5.89 9.23 11.30 8.59 8.72<br />
Salt load (kt) 0.67 1.94 0.85 0.21 0.57 0.10 0.43 0.29 0.18 3.25<br />
<strong>Salinity</strong> (mg/L) 356 588 552 358 809 473 464 337 388 563<br />
Groundwater discharge to stream zone<br />
(mm) 0.06 0.38 0.38 0.00 0.15 0.66 0.35 0.11 0.13 0.34<br />
Baseflow (mm) 1.42 0.22 0.22 3.03 0.52 0.66 0.05 0.11 0.00 0.86<br />
Average for 2060 b<br />
Annual rainfall (mm) 590 551 551 580 548 521 576 621 568 568<br />
Streamflow (GL) 1.84 3.06 1.47 0.61 0.64 0.20 0.85 0.80 0.43 5.42<br />
Runoff (mm) 7.80 8.32 9.92 5.69 7.03 5.34 8.40 10.64 8.08 8.20<br />
Salt load (kt) 0.66 1.04 0.42 0.24 0.23 0.08 0.34 0.28 0.15 1.83<br />
Average annual salinity (mg/L) 360 340 285 392 352 425 397 345 343 338<br />
Groundwater discharge to stream zone<br />
(mm) 0.00 0.05 0.06 -0.07 0.00 0.01 0.18 0.10 0.00 0.00<br />
Baseflow (mm) 0.00 -0.04 -0.04 0.00 0.00 0.21 0.00 0.00 0.00 0.00<br />
80 Department of Water<br />
a annual mean for the period 2025 – 2035<br />
b annual mean for the period 2055 – 2065