
Create successful ePaper yourself
Turn your PDF publications into a flip-book with our unique Google optimized e-Paper software.
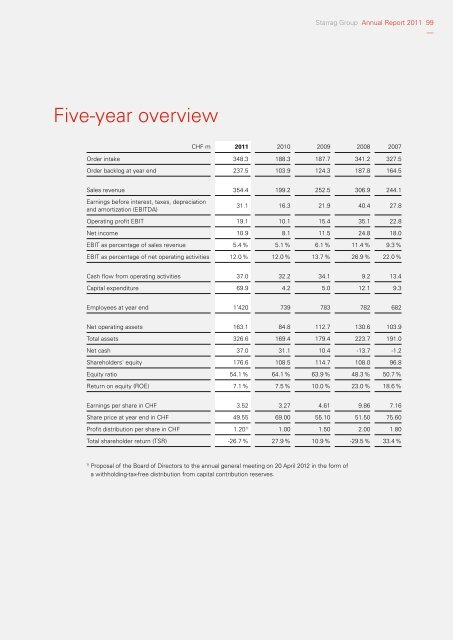
Five-year overview<br />
Starrag Group <strong>Annual</strong> <strong>Report</strong> <strong>2011</strong> 99<br />
––<br />
CHF m <strong>2011</strong> 2010 2009 2008 2007<br />
Order intake 348.3 188.3 187.7 341.2 327.5<br />
Order backlog at year end 237.5 103.9 124.3 187.8 164.5<br />
Sales revenue 354.4 199.2 252.5 306.9 244.1<br />
Earnings before interest, taxes, depreciation<br />
and amortization (EBITDA)<br />
31.1 16.3 21.9 40.4 27.8<br />
Operating profit EBIT 19.1 10.1 15.4 35.1 22.8<br />
Net income 10.9 8.1 11.5 24.8 18.0<br />
EBIT as percentage of sales revenue 5.4 % 5.1 % 6.1 % 11.4 % 9.3 %<br />
EBIT as percentage of net operating activities 12.0 % 12.0 % 13.7 % 26.9 % 22.0 %<br />
Cash flow from operating activities 37.0 32.2 34.1 9.2 13.4<br />
Capital expenditure 69.9 4.2 5.0 12.1 9.3<br />
Employees at year end 1’420 739 783 782 682<br />
Net operating assets 163.1 84.8 112.7 130.6 103.9<br />
Total assets 326.6 169.4 179.4 223.7 191.0<br />
Net cash 37.0 31.1 10.4 -13.7 -1.2<br />
Shareholders' equity 176.6 108.5 114.7 108.0 96.8<br />
Equity ratio 54.1 % 64.1 % 63.9 % 48.3 % 50.7 %<br />
Return on equity (ROE) 7.1 % 7.5 % 10.0 % 23.0 % 18.6 %<br />
Earnings per share in CHF 3.52 3.27 4.61 9.86 7.16<br />
Share price at year end in CHF 49.55 69.00 55.10 51.50 75.60<br />
Profit distribution per share in CHF 1.20 1) 1.00 1.50 2.00 1.80<br />
Total shareholder return (TSR) -26.7 % 27.9 % 10.9 % -29.5 % 33.4 %<br />
1) Proposal of the Board of Directors to the annual general meeting on 20 April 2012 in the form of<br />
a withholding-tax-free distribution from capital contribution reserves.