Analysis of a Woofer Motor David Meeker dmeeker@ieee.org 14 ...
Analysis of a Woofer Motor David Meeker dmeeker@ieee.org 14 ...
Analysis of a Woofer Motor David Meeker dmeeker@ieee.org 14 ...

Create successful ePaper yourself
Turn your PDF publications into a flip-book with our unique Google optimized e-Paper software.
<strong>Analysis</strong> <strong>of</strong> a Wo<strong>of</strong>er <strong>Motor</strong><br />
<strong>David</strong> <strong>Meeker</strong><br />
<strong>dmeeker@ieee</strong>.<strong>org</strong><br />
<strong>14</strong> May2009<br />
Introduction<br />
The purpose <strong>of</strong> this notebook is to automate the analysis <strong>of</strong> a wo<strong>of</strong>er motor. The notebook produces the static performance curves<br />
that designers <strong>of</strong>ten desire during the development <strong>of</strong> a new transducer: the actuator's "BL" (the amount <strong>of</strong> force produced on the<br />
voice coil per amp <strong>of</strong> coil current); the coil's self-inductance, and a plot <strong>of</strong> the magnetic field in which the coil is immersed.<br />
Because there are so many possible variations in speaker motor geometry, the notebook does not create the speaker geometry<br />
within the notebook. Rather, it reads an existing geometry info FEMM and analyses it at a number <strong>of</strong> different coil locations. It is<br />
assumed that the speaker motor has been drawn with all elements in the coil belonging to group number 1, so that the voice coil<br />
can be easily selected and moved by the notebook. It is also assumed that the .fem file describing the motor is located in the same<br />
directory as the notebook (although the user could manually change the path to the .fem file).<br />
Design - Specific Parameters<br />
Model Name<br />
In[1]:= ModelName "Wo<strong>of</strong>er.fem";<br />
Maximum excursion + /- from the centered position:<br />
In[2]:= Xlim 5;<br />
Movement increments used during the analysis<br />
In[3]:= dX 1;<br />
Define the range over which to plot the flux density :<br />
In[4]:= Xcenter 17.15; vertical location <strong>of</strong> the center <strong>of</strong> the airgap <br />
Xspan 10; field plotted between XcenterXspan and XcenterXspan <br />
<strong>Analysis</strong> Routines<br />
Load up the MathFEMM package and open an instance <strong>of</strong> FEMM<br />
In[5]:= c:\\progra~1\\femm42\\mathfemm\\mathfemm.m<br />
MathFEMM 1.20<br />
The Mathematica interface to FEMM 4.2<br />
<strong>David</strong> <strong>Meeker</strong><br />
dmeekerieee.<strong>org</strong><br />
In[6]:= OpenFEMM
2 GetBLCurve.nb<br />
Analyze BL and incremental inductance at 1 mm steps between - Xlim and + Xlim<br />
In[7]:= OpenDocumentNotebookDirectory ModelName;<br />
MISaveAsNotebookDirectory "temp.fem";<br />
MISelectGroup1;<br />
MIMoveTranslate0, Xlim;<br />
MIClearSelected;<br />
bl ;<br />
inductance ;<br />
Fork Xlim, kXlim, k dX,<br />
MIModifyCircProp"icoil", 1, 1;<br />
MIAnalyze1;<br />
MILoadSolution;<br />
MOGroupSelectBlock1;<br />
fz MOBlockIntegral12;<br />
bl Appendbl, k, fz;<br />
fl1 MOGetCircuitProperties"icoil"3;<br />
R MOGetCircuitProperties"icoil"2;<br />
MOClose;<br />
MIModifyCircProp"icoil", 1, 0;<br />
MIAnalyze1;<br />
MILoadSolution;<br />
fl0 MOGetCircuitProperties"icoil"3;<br />
L fl1 fl0 10^6;<br />
inductance Appendinductance, k, L;<br />
Printk, fz, L;<br />
MISelectGroup1;<br />
MIMoveTranslate0, 1;<br />
<br />
MIClose;<br />
5, 4.44127, 2030.98<br />
4, 5.1664, 1908.22<br />
3, 5.85<strong>14</strong>6, 1761.46<br />
2, 6.42366, 1604.46<br />
1, 6.69453, <strong>14</strong>32.57<br />
0, 6.75502, 1270.13<br />
1, 6.65584, 1124.27<br />
2, 6.366<strong>14</strong>, 995.426<br />
3, 5.76492, 881.901<br />
4, 5.03981, 779.68<br />
5, 4.29874, 692.62<br />
Evaluate flux density in the gap at the position <strong>of</strong> the coil
In[16]:= OpenDocumentNotebookDirectory ModelName;<br />
MISaveAsNotebookDirectory "temp.fem";<br />
MIModifyCircProp"icoil", 1, 0;<br />
MIAnalyze1;<br />
MILoadSolution;<br />
fluxdensity Tablex, MOGetB16, Xcenter x1, x, Xspan, Xspan, Xspan 100;<br />
In[22]:= CloseFEMM;<br />
DeleteFileNotebookDirectory "temp.fem";<br />
DeleteFileNotebookDirectory "temp.ans";<br />
Plot <strong>Analysis</strong> Results<br />
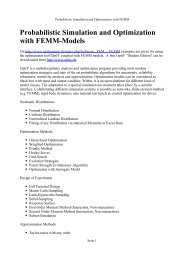
In[25]:= PlotInterpolationblx, x, Xlim, Xlim, BaseStyle FontSize <strong>14</strong>,<br />
Frame True, GridLines Automatic, FrameLabel "Displacement, mm", "BL, NA",<br />
ImageSize 500, PlotLabel "BL vs. Displacement"<br />
Out[25]=<br />
BL, NA<br />
6.5<br />
6.0<br />
5.5<br />
5.0<br />
4.5<br />
BLvs. Displacement<br />
4 2 0 2 4<br />
Displacement, mm<br />
GetBLCurve.nb 3
4 GetBLCurve.nb<br />
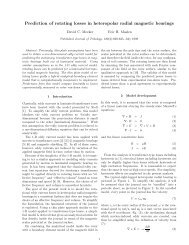
In[26]:= PlotInterpolationinductancex, x, Xlim, Xlim, BaseStyle FontSize <strong>14</strong>,<br />
Frame True, GridLines Automatic, FrameLabel "Displacement, mm", "Inductance, H",<br />
ImageSize 500, PlotLabel "Coil DC Self Inductance vs. Displacement"<br />
Out[26]=<br />
Inductance, H<br />
2000<br />
1800<br />
1600<br />
<strong>14</strong>00<br />
1200<br />
1000<br />
800<br />
CoilDCSelf Inductance vs. Displacement<br />
4 2 0 2 4<br />
Displacement, mm
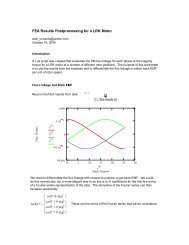
In[27]:= ListPlotfluxdensity.DiagonalMatrix1, 1, Joined True,<br />
BaseStyle FontSize <strong>14</strong>, Frame True, GridLines Automatic,<br />
FrameLabel "Vertical distance from center <strong>of</strong> gap, mm", "Flux Density, T",<br />
ImageSize 500, PlotLabel "Air Gap Radial Flux Density vs. Position"<br />
Out[27]=<br />
Flux Density, T<br />
0.8<br />
0.6<br />
0.4<br />
0.2<br />
0.0<br />
10 5 0 5 10<br />
DC Coil Resistance in Ohms:<br />
In[28]:= R<br />
Out[28]= 5.40812<br />
Air Gap RadialFlux Densityvs. Position<br />
Verticaldistance from center <strong>of</strong> gap, mm<br />
Compute the nominal range <strong>of</strong> operation <strong>of</strong> the speaker. It is assumed that the operating range is the range in which BL is within<br />
10 % <strong>of</strong> th e maximum value <strong>of</strong> BL<br />
In[29]:= BLMax FindMaximumInterpolationblx, x, 1, 11<br />
Out[29]= 6.75739<br />
In[30]:= XmaxHigh x . FindRootInterpolationblx 0.9 BLMax, x, 0, 5<br />
Out[30]= 2.518<strong>14</strong><br />
In[31]:= XmaxLow x . FindRootInterpolationblx 0.9 BLMax, x, 5, 0<br />
Out[31]= 2.63776<br />
GetBLCurve.nb 5