Слайд 0 - Gazprom
Слайд 0 - Gazprom
Слайд 0 - Gazprom

Create successful ePaper yourself
Turn your PDF publications into a flip-book with our unique Google optimized e-Paper software.
16<br />
Consumption (monthly), bcm<br />
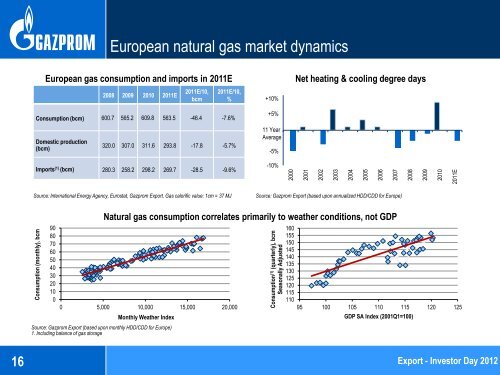
European natural gas market dynamics<br />
European gas consumption and imports in 2011E<br />
2008 2009 2010 2011E<br />
2011E/10,<br />
bcm<br />
2011E/10,<br />
%<br />
Consumption (bcm) 600.7 565.2 609.8 563.5 -46.4 -7.6%<br />
Domestic production<br />
(bcm)<br />
320.0 307.0 311.6 293.8 -17.8 -5.7%<br />
Imports (1) (bcm) 280.3 258.2 298.2 269.7 -28.5 -9.6%<br />
Source: International Energy Agency, Eurostat, <strong>Gazprom</strong> Export. Gas calorific value: 1cm = 37 MJ<br />
90<br />
80<br />
70<br />
60<br />
50<br />
40<br />
30<br />
20<br />
10<br />
0<br />
0 5,000 10,000 15,000 20,000<br />
Monthly Weather Index<br />
Source: <strong>Gazprom</strong> Export (based upon monthly HDD/CDD for Europe)<br />
1. Including balance of gas storage<br />
10.0%<br />
+10%<br />
6.0%<br />
+5%<br />
2.0%<br />
11 Year<br />
Average -2.0%<br />
-6.0% -5%<br />
-10.0% -10%<br />
2000<br />
Net heating & cooling degree days<br />
2001<br />
2002<br />
Source: <strong>Gazprom</strong> Export (based upon annualized HDD/CDD for Europe)<br />
Natural gas consumption correlates primarily to weather conditions, not GDP<br />
Consumption (1) (quarterly), bcm<br />
Seasonally Adjusted<br />
2003<br />
2004<br />
2005<br />
160<br />
155<br />
150<br />
145<br />
140<br />
135<br />
130<br />
125<br />
120<br />
115<br />
110<br />
95 100 105 110 115 120 125<br />
2006<br />
GDP SA Index (2001Q1=100)<br />
Департамент стратегического развития<br />
2007<br />
2008<br />
2009<br />
2010<br />
Export - Investor Day 2012<br />
2011E