Слайд 0 - Gazprom
Слайд 0 - Gazprom
Слайд 0 - Gazprom

You also want an ePaper? Increase the reach of your titles
YUMPU automatically turns print PDFs into web optimized ePapers that Google loves.
28<br />
1,000<br />
800<br />
600<br />
400<br />
200<br />
0<br />
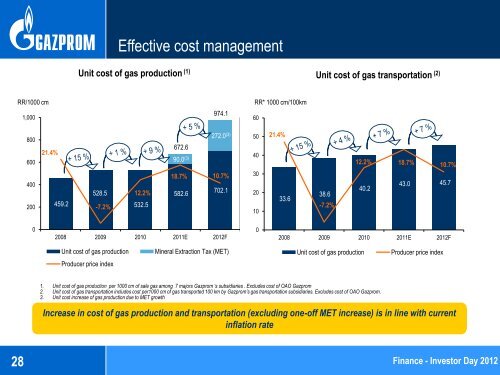
21.4%<br />
459.2<br />
528.5<br />
-7.2%<br />
12.2%<br />
532.5<br />
672.6<br />
90.0 (3)<br />
582.6<br />
974.1<br />
272.0 (3)<br />
18.7% 10.7%<br />
702.1<br />
2008 2009 2010 2011E 2012F<br />
Unit cost of gas production Mineral Extraction Tax (MET)<br />
Producer price index<br />
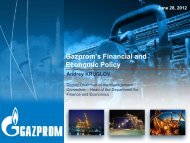
Effective cost management<br />
Unit cost of gas production (1)<br />
RR/1000 cm RR* 1000 cm/100km<br />
60<br />
50<br />
40<br />
30<br />
20<br />
10<br />
0<br />
21.4%<br />
33.6<br />
Unit cost of gas transportation (2)<br />
38.6<br />
-7.2%<br />
12.2% 18.7% 10.7%<br />
40.2<br />
43.0 45.7<br />
2008 2009 2010 2011E 2012F<br />
Unit cost of gas production Producer price index<br />
1. Unit cost of gas production per 1000 cm of sale gas among 7 majors <strong>Gazprom</strong> ‘s subsidiaries . Excludes cost of OAO <strong>Gazprom</strong><br />
2. Unit cost of gas transportation includes cost per1000 cm of gas transported 100 km by <strong>Gazprom</strong>’s gas transportation subsidiaries. Excludes cost of OAO <strong>Gazprom</strong>.<br />
3. Unit cost increase of gas production due to MET growth<br />
Increase in cost of gas production and transportation (excluding one-off MET increase) is in line with current<br />
inflation rate<br />
Finance - Investor Day 2012