Слайд 0 - Gazprom
Слайд 0 - Gazprom
Слайд 0 - Gazprom

You also want an ePaper? Increase the reach of your titles
YUMPU automatically turns print PDFs into web optimized ePapers that Google loves.
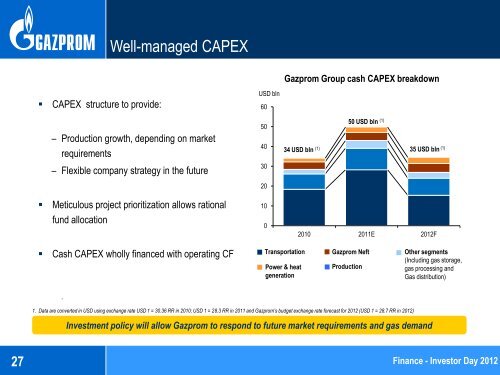
CAPEX structure to provide:<br />
.<br />
Well-managed CAPEX<br />
– Production growth, depending on market<br />
requirements<br />
– Flexible company strategy in the future<br />
Meticulous project prioritization allows rational<br />
fund allocation<br />
Cash CAPEX wholly financed with operating CF<br />
1. Data are converted in USD using exchange rate USD 1 = 30.36 RR in 2010; USD 1 = 28.3 RR in 2011 and <strong>Gazprom</strong>’s budget exchange rate forecast for 2012 (USD 1 = 28.7 RR in 2012)<br />
27 Finance - Investor Day 2012<br />
USD bln<br />
60<br />
50<br />
40<br />
30<br />
20<br />
10<br />
0<br />
50 USD bln (1)<br />
34 USD bln (1) 35 USD bln (1)<br />
Transportation<br />
Power & heat<br />
generation<br />
<strong>Gazprom</strong> Group cash CAPEX breakdown<br />
2010 2011E 2012F<br />
<strong>Gazprom</strong> Neft<br />
Production<br />
Other segments<br />
(Including gas storage,<br />
gas processing and<br />
Gas distribution)<br />
Investment policy will allow <strong>Gazprom</strong> to respond to future market requirements and gas demand