Слайд 0 - Gazprom
Слайд 0 - Gazprom
Слайд 0 - Gazprom

You also want an ePaper? Increase the reach of your titles
YUMPU automatically turns print PDFs into web optimized ePapers that Google loves.
19<br />
TWh<br />
2000<br />
1500<br />
1000<br />
500<br />
0<br />
800<br />
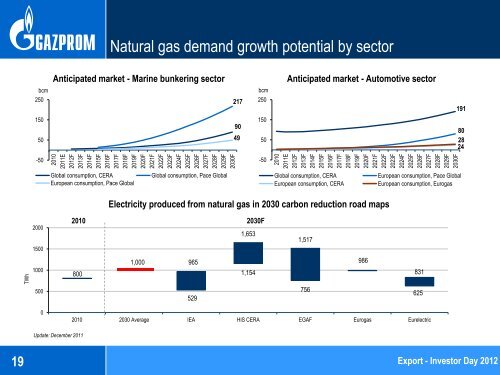
Natural gas demand growth potential by sector<br />
Anticipated market - Marine bunkering sector Anticipated market - Automotive sector<br />
bcm bcm<br />
250<br />
150<br />
50<br />
-50<br />
2010<br />
2011E<br />
2012F<br />
2013F<br />
2014F<br />
2015F<br />
2016F<br />
2017F<br />
2018F<br />
2019F<br />
2020F<br />
2021F<br />
2022F<br />
2023F<br />
2024F<br />
2025F<br />
2026F<br />
2027F<br />
2028F<br />
2029F<br />
2030F<br />
Global consumption, CERA Global consumption, Pace Global<br />
European consumption, Pace Global<br />
Update: December 2011<br />
Electricity produced from natural gas in 2030 carbon reduction road maps<br />
2010 2030F<br />
1,000<br />
965<br />
529<br />
217<br />
90<br />
49<br />
1,653<br />
1,154<br />
2010 2030 Average IEA HIS CERA EGAF Eurogas Eurelectric<br />
250<br />
150<br />
50<br />
-50<br />
2010<br />
2011E<br />
2012F<br />
2013F<br />
2014F<br />
2015F<br />
2016F<br />
2017F<br />
2018F<br />
2019F<br />
2020F<br />
2021F<br />
2022F<br />
2023F<br />
2024F<br />
2025F<br />
2026F<br />
2027F<br />
2028F<br />
2029F<br />
2030F<br />
Global consumption, CERA European consumption, Pace Global<br />
European consumption, CERA European consumption, Eurogas<br />
1,517<br />
756<br />
986<br />
Департамент стратегического развития<br />
831<br />
625<br />
191<br />
80<br />
28<br />
24<br />
Export - Investor Day 2012