2011 Matosinhos Data Book - Galp Energia
2011 Matosinhos Data Book - Galp Energia
2011 Matosinhos Data Book - Galp Energia

Create successful ePaper yourself
Turn your PDF publications into a flip-book with our unique Google optimized e-Paper software.
01<br />
02<br />
03<br />
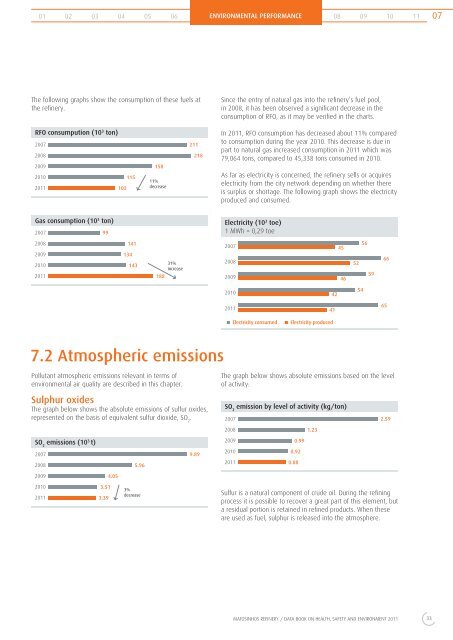
The following graphs show the consumption of these fuels at<br />
the refi nery.<br />
RFO consumpution (10 3 ton)<br />
2007<br />
2008<br />
Pollutant atmospheric emissions relevant in terms of<br />
environmental air quality are described in this chapter.<br />
04<br />
Sulphur oxides<br />
The graph below shows the absolute emissions of sulfur oxides,<br />
represented on the basis of equivalent sulfur dioxide, SO 2 .<br />
05<br />
2009 158<br />
2010 115<br />
<strong>2011</strong> 102<br />
Gas consumption (10 3 ton)<br />
2007<br />
2008<br />
7.2 Atmospheric emissions<br />
SO 2 emissions (10 3 t)<br />
2007<br />
2008<br />
99<br />
2009 4.05<br />
2010 3.51<br />
<strong>2011</strong> 3.39<br />
141<br />
11%<br />
decrease<br />
2009 134<br />
2010 143<br />
31%<br />
increase<br />
<strong>2011</strong> 188<br />
5.96<br />
3%<br />
decrease<br />
06<br />
211<br />
218<br />
9.89<br />
ENVIRONMENTAL PERFORMANCE 08 09 10 11<br />
Since the entry of natural gas into the refi nery’s fuel pool,<br />
in 2008, it has been observed a signifi cant decrease in the<br />
consumption of RFO, as it may be verifi ed in the charts.<br />
In <strong>2011</strong>, RFO consumption has decreased about 11% compared<br />
to consumption during the year 2010. This decrease is due in<br />
part to natural gas increased consumption in <strong>2011</strong> which was<br />
79,064 tons, compared to 45,338 tons consumed in 2010.<br />
As far as electricity is concerned, the refi nery sells or acquires<br />
electricity from the city network depending on whether there<br />
is surplus or shortage. The following graph shows the electricity<br />
produced and consumed.<br />
Electricity (10 3 toe)<br />
1 MWh = 0,29 toe<br />
2007<br />
2008<br />
2009<br />
2010<br />
<strong>2011</strong><br />
The graph below shows absolute emissions based on the level<br />
of activity:<br />
SO 2 emission by level of activity (kg/ton)<br />
2007<br />
2008<br />
2009<br />
2010<br />
<strong>2011</strong><br />
Electricity consumed Electricity produced<br />
0.99<br />
0.92<br />
0.88<br />
1.23<br />
2.59<br />
Sulfur is a natural component of crude oil. During the refi ning<br />
process it is possible to recover a great part of this element, but<br />
a residual portion is retained in refi ned products. When these<br />
are used as fuel, sulphur is released into the atmosphere.<br />
MATOSINHOS REFINERY / DATA BOOK ON HEALTH, SAFETY AND ENVIRONMENT <strong>2011</strong><br />
42<br />
41<br />
45<br />
46<br />
52<br />
54<br />
56<br />
59<br />
66<br />
65<br />
33<br />
07