2011 Matosinhos Data Book - Galp Energia
2011 Matosinhos Data Book - Galp Energia
2011 Matosinhos Data Book - Galp Energia

Create successful ePaper yourself
Turn your PDF publications into a flip-book with our unique Google optimized e-Paper software.
01<br />
02<br />
03<br />
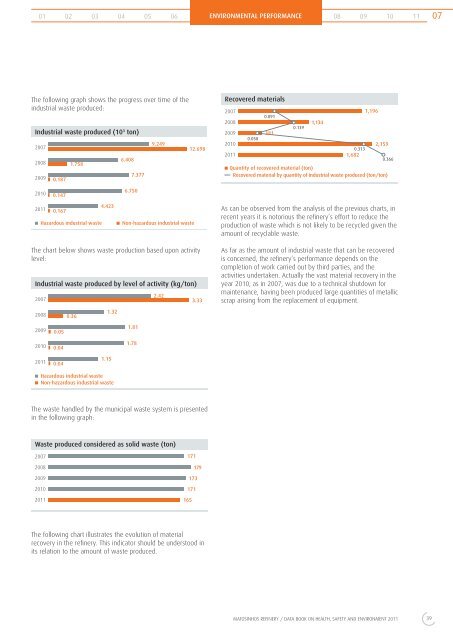
The following graph shows the progress over time of the<br />
industrial waste produced:<br />
The chart below shows waste production based upon activity<br />
level:<br />
04<br />
Industrial waste produced (103 ton)<br />
2007<br />
9.249<br />
12.698<br />
2008 1.758<br />
6.408<br />
2009 0.187<br />
7.377<br />
2010 0.147<br />
6.750<br />
<strong>2011</strong> 0.167<br />
4.423<br />
Hazardous industrial waste Non-hazardous industrial waste<br />
Industrial waste produced by level of activity (kg/ton)<br />
2007<br />
2008<br />
2009<br />
2010<br />
<strong>2011</strong><br />
0.05<br />
0.04<br />
0.04<br />
0.36<br />
1.15<br />
1.32<br />
Hazardous industrial waste<br />
Non-hazardous industrial waste<br />
1.81<br />
1.78<br />
The waste handled by the municipal waste system is presented<br />
in the following graph:<br />
The following chart illustrates the evolution of material<br />
recovery in the refi nery. This indicator should be understood in<br />
its relation to the amount of waste produced.<br />
05<br />
2.42<br />
06<br />
3.33<br />
Waste produced considered as solid waste (ton)<br />
2007<br />
171<br />
2008<br />
179<br />
2009 173<br />
2010 171<br />
<strong>2011</strong> 165<br />
ENVIRONMENTAL PERFORMANCE 08 09 10 11<br />
Recovered materials<br />
2007<br />
1,196<br />
0.091<br />
2008<br />
1,134<br />
0.139<br />
2009<br />
381<br />
0.050<br />
2010 2,159<br />
0.313<br />
<strong>2011</strong> 1,682<br />
0.366<br />
Quantity of recovered material (ton)<br />
Recovered material by quantity of industrial waste produced (ton/ton)<br />
As can be observed from the analysis of the previous charts, in<br />
recent years it is notorious the refi nery’s effort to reduce the<br />
production of waste which is not likely to be recycled given the<br />
amount of recyclable waste.<br />
As far as the amount of industrial waste that can be recovered<br />
is concerned, the refi nery’s performance depends on the<br />
completion of work carried out by third parties, and the<br />
activities undertaken. Actually the vast material recovery in the<br />
year 2010, as in 2007, was due to a technical shutdown for<br />
maintenance, having been produced large quantities of metallic<br />
scrap arising from the replacement of equipment.<br />
MATOSINHOS REFINERY / DATA BOOK ON HEALTH, SAFETY AND ENVIRONMENT <strong>2011</strong><br />
39<br />
07