2011 Matosinhos Data Book - Galp Energia
2011 Matosinhos Data Book - Galp Energia
2011 Matosinhos Data Book - Galp Energia

You also want an ePaper? Increase the reach of your titles
YUMPU automatically turns print PDFs into web optimized ePapers that Google loves.
01<br />
02<br />
03<br />
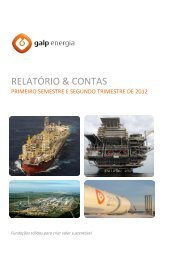
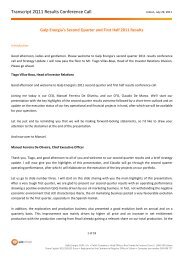
The following graph allows the evaluation of the specifi c<br />
emissions of particulate matter at <strong>Matosinhos</strong> refi nery:<br />
04<br />
Particulate matter emissions by level of activity (kg/ton)<br />
2007<br />
2008<br />
2009<br />
2010<br />
<strong>2011</strong><br />
Regarding particulate emissions, in <strong>2011</strong> there is a 30%<br />
increase in particulate emissions, compared to the previous<br />
year. This increase is justifi ed by the increased level of activity<br />
observed in the refi nery during the year <strong>2011</strong> compared to<br />
2010, when there was a technical shutdown of the refi nery in<br />
October and November.<br />
Despite this increase, emissions remain at lower levels when<br />
compared to those observed prior to the introduction of<br />
technical measures to reduce this pollutant. As can be seen,<br />
the quality of fuels burned, like gas, and the installation of<br />
an electrostatic precipitator were decisive factors in reducing<br />
emissions from the end of 2008.<br />
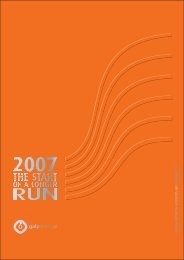
Carbon dioxide<br />
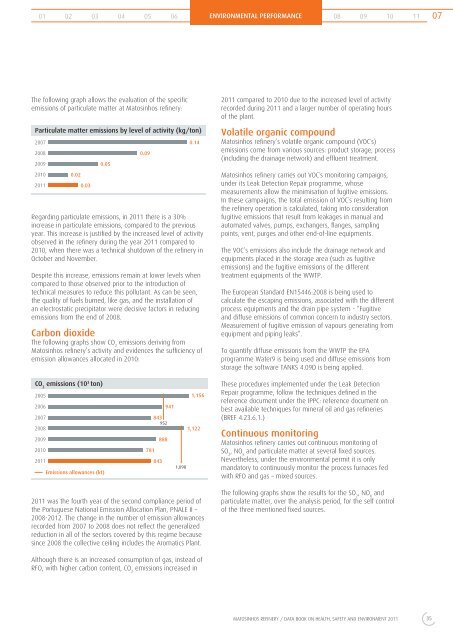
The following graphs show CO 2 emissions deriving from<br />
<strong>Matosinhos</strong> refi nery’s activity and evidences the suffi ciency of<br />
emission allowances allocated in 2010:<br />
CO 2 emissions (10 3 ton)<br />
2005<br />
2006<br />
2007<br />
2008<br />
2009<br />
2010<br />
<strong>2011</strong><br />
0.02<br />
0.03<br />
Emissions allowances (kt)<br />
0.05<br />
<strong>2011</strong> was the fourth year of the second compliance period of<br />
the Portuguese National Emission Allocation Plan, PNALE II –<br />
2008-2012. The change in the number of emission allowances<br />
recorded from 2007 to 2008 does not refl ect the generalized<br />
reduction in all of the sectors covered by this regime because<br />
since 2008 the collective ceiling includes the Aromatics Plant.<br />
Although there is an increased consumption of gas, instead of<br />
RFO, with higher carbon content, CO 2 emissions increased in<br />
05<br />
0.09<br />
781<br />
843<br />
952<br />
843<br />
888<br />
941<br />
06<br />
1,098<br />
0.14<br />
1,156<br />
1,122<br />
ENVIRONMENTAL PERFORMANCE 08 09 10 11<br />
<strong>2011</strong> compared to 2010 due to the increased level of activity<br />
recorded during <strong>2011</strong> and a larger number of operating hours<br />
of the plant.<br />
Volatile organic compound<br />
<strong>Matosinhos</strong> refi nery’s volatile organic compound (VOC´s)<br />
emissions come from various sources: product storage, process<br />
(including the drainage network) and effl uent treatment.<br />
<strong>Matosinhos</strong> refi nery carries out VOC´s monitoring campaigns,<br />
under its Leak Detection Repair programme, whose<br />
measurements allow the minimisation of fugitive emissions.<br />
In these campaigns, the total emission of VOC´s resulting from<br />
the refi nery operation is calculated, taking into consideration<br />
fugitive emissions that result from leakages in manual and<br />
automated valves, pumps, exchangers, fl anges, sampling<br />
points, vent, purges and other end-of-line equipments.<br />
The VOC’s emissions also include the drainage network and<br />
equipments placed in the storage area (such as fugitive<br />
emissions) and the fugitive emissions of the different<br />
treatment equipments of the WWTP.<br />
The European Standard EN15446:2008 is being used to<br />
calculate the escaping emissions, associated with the different<br />
process equipments and the drain pipe system - “Fugitive<br />
and diffuse emissions of common concern to industry sectors.<br />
Measurement of fugitive emission of vapours generating from<br />
equipment and piping leaks”.<br />
To quantify diffuse emissions from the WWTP the EPA<br />
programme Water9 is being used and diffuse emissions from<br />
storage the software TANKS 4.09D is being applied.<br />
These procedures implemented under the Leak Detection<br />
Repair programme, follow the techniques defi ned in the<br />
reference document under the IPPC: reference document on<br />
best available techniques for mineral oil and gas refi neries<br />
(BREF 4.23.6.1.)<br />
Continuous monitoring<br />
<strong>Matosinhos</strong> refi nery carries out continuous monitoring of<br />
SO 2 , NO x and particulate matter at several fi xed sources.<br />
Nevertheless, under the environmental permit it is only<br />
mandatory to continuously monitor the process furnaces fed<br />
with RFO and gas – mixed sources.<br />
The following graphs show the results for the SO 2 , NO X and<br />
particulate matter, over the analysis period, for the self control<br />
of the three mentioned fi xed sources.<br />
MATOSINHOS REFINERY / DATA BOOK ON HEALTH, SAFETY AND ENVIRONMENT <strong>2011</strong><br />
35<br />
07