2011 Matosinhos Data Book - Galp Energia
2011 Matosinhos Data Book - Galp Energia
2011 Matosinhos Data Book - Galp Energia

Create successful ePaper yourself
Turn your PDF publications into a flip-book with our unique Google optimized e-Paper software.
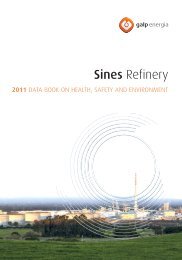
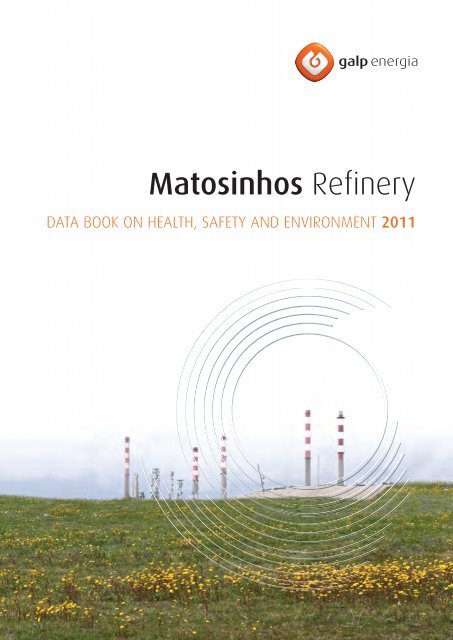
<strong>Matosinhos</strong> Refinery<br />
DATA BOOK ON HEALTH, SAFETY AND ENVIRONMENT <strong>2011</strong>
<strong>Matosinhos</strong> Refi nery<br />
DATA BOOK ON HEALTH, SAFETY AND ENVIRONMENT <strong>2011</strong><br />
www.galpenergia.com<br />
This translation of the Portuguese document was made only for the convenience of non-Portuguese<br />
speaking interested parties. For all intents and purposes, the Portuguese version shall prevail.
MATOSINHOS REFINERY<br />
DATA BOOK ON HEALTH, SAFETY AND ENVIRONMENT <strong>2011</strong><br />
01 •<br />
02 •<br />
03 •<br />
3.1<br />
3.2<br />
3.3<br />
04 •<br />
4.1<br />
4.2<br />
4.3<br />
05 •<br />
06 •<br />
6.1<br />
6.2<br />
6.3<br />
07 •<br />
7.1<br />
7.2<br />
7.3<br />
7.4<br />
08 •<br />
8.1<br />
8.2<br />
8.3<br />
8.4<br />
09 •<br />
10 •<br />
11 •<br />
MESSAGE FROM THE REFINERY MANAGEMENT<br />
INTRODUCTION<br />
FRAMEWORK<br />
GALP ENERGIA’S HEALTH, SAFETY AND ENVIRONMENTAL POLICY<br />
INTRODUCING THE REFINERY<br />
DESCRIPTION OF ACTIVITY<br />
ACTIVITIES, ACTIONS AND PROJECTS<br />
COGENERATION CONSTRUCTION<br />
COSTS AND INVESTMENTS<br />
HEALTH, SAFETY AND ENVIRONMENT TRAINING<br />
IN FOCUS<br />
ACTIVITY INDICATORS<br />
LEVEL OF ACTIVITY<br />
PRODUCTION<br />
BOA NOVA DEPOT<br />
ENVIRONMENTAL PERFORMANCE<br />
RESOURCE CONSUMPTION<br />
ATMOSPHERIC EMISSIONS<br />
WASTEWATER<br />
WASTE<br />
HEALTH AND SAFETY PERFORMANCE<br />
ACCIDENT RATE<br />
OCCUPATIONAL MEDICINE<br />
SAFETY MANAGEMENT SYSTEM FOR SERIOUS ACCIDENT PREVENT<br />
PREVENTIVE SAFETY AND ENVIRONMENTAL OBSERVATIONS<br />
COMMUNITY RELATIONS<br />
GLOSSARY<br />
CONFORMITY STATEMENT<br />
6<br />
8<br />
10<br />
11<br />
11<br />
15<br />
17<br />
18<br />
21<br />
22<br />
24<br />
28<br />
29<br />
29<br />
29<br />
31<br />
32<br />
33<br />
36<br />
38<br />
40<br />
41<br />
43<br />
43<br />
44<br />
45<br />
47<br />
52
The <strong>Matosinhos</strong> refi nery <strong>Data</strong> <strong>Book</strong> outlines<br />
the refi nery performance in Health, Safety and<br />
Environment in a factual and direct manner,<br />
discussing and analysing various typical activity<br />
indicators as well as matters of interest to the<br />
public, stakeholders and public entities.<br />
1969<br />
start year<br />
of operation<br />
<strong>Matosinhos</strong> refi nery in a glance<br />
5.5Mton<br />
capacity<br />
crude/year<br />
470<br />
number<br />
of employees<br />
290ha<br />
area
01 MESSAGE MENSAGEM FROM DA THE DIREÇÃO REFINERY DA MANAGEMENT<br />
REFINARIA<br />
01<br />
02<br />
03<br />
04<br />
05<br />
06<br />
07<br />
08<br />
09 10 11<br />
6<br />
01 . MESSAGE FROM THE REFINERY<br />
MANAGEMENT<br />
MATOSINHOS REFINERY / DATA BOOK ON HEALTH, SAFETY AND ENVIRONMENT <strong>2011</strong>
MESSAGE FROM THE REFINERY MANAGEMENT 02 03 04 05 06 07 08 09 10 11<br />
Message from the refi nery management<br />
The <strong>Data</strong> <strong>Book</strong> of Health, Safety and the Environment of<br />
<strong>Matosinhos</strong> refi nery, which is annually published, is an<br />
opportunity for evaluation. Thus, as in previous years, here<br />
we disclose in our <strong>2011</strong> <strong>Data</strong> <strong>Book</strong>, the results of the key<br />
performance indicators for Health, Safety and the Environment<br />
of our refi nery. In this document we focus on the assessment<br />
of the goals achieved and the new challenges, and above all,<br />
on what, with humility, we recognize the power and duty to<br />
make even better.<br />
If 2010 was the year of construction, <strong>2011</strong> will remain for<br />
the refi nery records as the starting year of the new vacuum<br />
distillation and visbreaking units offi cially inaugurated on<br />
September 28th by His Excellency the President of the<br />
Republic, Dr. Aníbal Cavaco Silva. The commissioning and<br />
start up of the new units, a complex and time-consuming<br />
activity, was performed in a professional and competent<br />
way by an enthusiastic team. We are proud to announce<br />
the non-occurrence of any accidents related to this activity.<br />
Nevertheless, we cannot fail to register an internal outbreak<br />
in a reservoir and hence take its lessons, in spite of all the<br />
prevention mechanism and response to occurrence having<br />
worked properly.<br />
Also the environmental plan was featured in <strong>2011</strong>. An<br />
ambitious program of monitoring the ambient air quality<br />
was carried out in a surrounding area of approximately<br />
35 km 2 around the refi nery, measuring the main volatile<br />
organic compounds, including benzene. It was possible to fi nd<br />
that in all inhabited areas, whether in the north, the south or<br />
at the east of the refi nery, the concentrations of pollutants are<br />
lower in all monitored points than the required rigorous legal<br />
limits.<br />
In addition to the concern over air, the refi nery discharges<br />
to the marine environment water used in its activities after<br />
having been fully treated and purifi ed. In <strong>2011</strong> we have reused<br />
43% of such water. Also in <strong>2011</strong> and for the fi rst time, all the<br />
beaches from the seafront of Leça da Palmeira and Perafi ta<br />
were awarded the blue fl ag. This evidences the healthy<br />
coexistence between the refi nery and other industrial units and<br />
the Environment.<br />
We wanted to share our enthusiasm with the Environmental<br />
improvement and have proceeded with the architectural<br />
redevelopment of the access area through Rua Belchior Robles<br />
and have planted trees along Rua Coronel Helder Ribeiro, in the<br />
west front of the refi nery.<br />
Key indicators of Safety, particularly the Accident Frequency<br />
Rate with lost workday injuries, that are kept below the<br />
average of the european refi ning sector operators, and far<br />
below the national indicators, give us the strength to continue<br />
on the path of continuous improvement, always investing in<br />
the training of our workers and the qualifi cation of our suppliers<br />
and partners, putting the refi nery at the forefront of safe<br />
workplaces.<br />
Director of the refi nery of <strong>Matosinhos</strong><br />
We are a modern refi nery that wants to be asserted by a<br />
positive relationship with the community in which it operates,<br />
with respect for fundamental values of protecting the health<br />
and safety of the human person and the establishment of a<br />
sustainable relationship with the environment.<br />
Our values are increasingly present and we keep repeating<br />
them:<br />
• all our activities and decisions are supported by a strong<br />
safety culture;<br />
• our commitment towards the environment goes beyond legal<br />
issues. We aim a sustained integration in the surroundings.<br />
It is in defense of these values that in 2012 we intend to obtain<br />
integrated certifi cation in Energy, Safety, Environment and<br />
Quality. We trust that energy effi ciency cannot be dissociated<br />
from the environment protection including by reducing<br />
greenhouse gases emission.<br />
To be in the fi rst quartile of the best European refi ning<br />
operators in 2015 in terms of energy intensity, it is a<br />
challenging goal and we are getting closer, as the plan for<br />
energy effi ciency improvements will be achieved either<br />
with investments for energy recovery, or by the use of more<br />
environment friendly fuels. We will thus build a legacy, based<br />
upon a strong culture of Health, Safety and the Environment,<br />
that we can all be proud of in generations to come.<br />
<strong>Matosinhos</strong> refi nery management<br />
MATOSINHOS REFINERY / DATA BOOK ON HEALTH, SAFETY AND ENVIRONMENT <strong>2011</strong><br />
7<br />
01
02 01 APRESENTAÇÃO INTRODUCTION<br />
02<br />
03 04 05 06 07 08 09 10 11<br />
8<br />
02 . INTRODUCTION<br />
MATOSINHOS REFINERY / DATA BOOK ON HEALTH, SAFETY AND ENVIRONMENT <strong>2011</strong>
01<br />
Introduction<br />
INTRODUCTION 03 04 05 06 07 08 09 10 11<br />
This is the fi fth edition of the <strong>Data</strong> <strong>Book</strong> on Health, Safety and<br />
Environment of <strong>Matosinhos</strong> refi nery.<br />
We have been presenting the performance of <strong>Matosinhos</strong><br />
refi nery in its most relevant indicators for Health, Safety and<br />
the Environment with full transparency and rigor. The results<br />
presented herein are, once again, the translation of the<br />
effort of all those who earnestly and devotedly collaborate<br />
in this industrial unit to ensure a sustained performance of<br />
excellence by which we are already recognized.<br />
This way, we have been attentive to the suggestions of our<br />
readers, and thus we seek to refl ect them in the editorial,<br />
graphics and content development that the <strong>Data</strong> <strong>Book</strong> has<br />
been experiencing. This year, as opposed to the 2010 <strong>Data</strong><br />
<strong>Book</strong>, where a strong focus was made on investments when<br />
describing the refi nery expansion, we have embarked on a<br />
more synthetic, more direct and lighter approach. Obviously,<br />
we have kept the core of the <strong>Data</strong> <strong>Book</strong>, focusing on the<br />
presentation of performance indicators for Health, Safety<br />
and Environment without major changes once an evolution<br />
of continuity is warranted. The sections aimed at publicizing<br />
the operational aspects of our refi nery were synthesized<br />
without failing to focus on projects and facilities which<br />
were structuring for the construction of a safer and more<br />
environmentally responsible refi nery and which deserve a<br />
prominent place in these pages.<br />
The numerical information presented in the <strong>Data</strong> <strong>Book</strong> has<br />
been showing the evolution since its origin from the year<br />
2005. In 2010 it was still possible to include the fi rst year of<br />
reporting, but from now on and in the name of a lively, more<br />
appealing graphic design, we will only present the data for<br />
the last fi ve years. So this year, the series presented cover<br />
the period from 2007 to <strong>2011</strong>. Readers, whom we failed to<br />
deliver the <strong>Data</strong> <strong>Book</strong>s from previous years and who might<br />
be interested in information for the years 2005 and 2006,<br />
we have the greatest pleasure to make them receive the<br />
previous issues.<br />
We have already mentioned the attention we give to<br />
suggestions from our readers. This <strong>Data</strong> <strong>Book</strong> is for them<br />
and it only makes sense if it meets their expectations as a<br />
source of information, whether for their work, whether for the<br />
interests it holds in relation to the refi nery or even as a mere<br />
pleasure to become aware of something different. Everyone<br />
is asked, earnestly, whether it is understood that we can do<br />
differently, whether we can do better, to please complete<br />
the questionnaire attached to the <strong>Data</strong> <strong>Book</strong> and refer it to<br />
the address refi nariadematosinhos@galpenergia.com and<br />
AmbAQSCorp@galpenergia.com.<br />
Given the responsiveness that the english edition of the<br />
<strong>Data</strong> <strong>Book</strong> has been evidencing, this year we will continue<br />
to ensure it, as in the previous two years. We will, therefore,<br />
be opening our doors to a wider range of readers, at a time<br />
when our company is open to the world, with an investment<br />
of unprecedented internationalization.<br />
The <strong>Data</strong> <strong>Book</strong> is intended as a practical and easy document<br />
conveying information that is reliable, trustworthy and<br />
accurately presented. It is addressed to our customers and<br />
suppliers, our employees, our shareholders and investors<br />
in general, public authorities, the academic world and the<br />
media. It is for all stakeholders in respect of the <strong>Matosinhos</strong><br />
refi nery and the urban environment in which it operates. The<br />
data appropriately framed and defi ned in the Glossary section,<br />
are reproducible and trustworthy. Actually they were subject<br />
to verifi cation by an external auditor in order to demonstrate<br />
the veracity and accuracy of the information herein made<br />
available. Everybody is invited to use these data as a means<br />
to satisfy your interest, your curiosity or even as a help in<br />
your work. We will be happy to assist in these tasks. We wish<br />
you a good reading.<br />
MATOSINHOS REFINERY / DATA BOOK ON HEALTH, SAFETY AND ENVIRONMENT <strong>2011</strong><br />
9<br />
02
03 01 02<br />
ENQUADRAMENTO FRAMEWORK<br />
03<br />
04 05 06 07 08 09 10 11<br />
10<br />
03 . FRAMEWORK<br />
3.1<br />
3.2<br />
3.3<br />
GALP ENERGIA’S HEALTH, SAFETY AND ENVIRONMENTAL POLICY<br />
INTRODUCING THE REFINERY<br />
DESCRIPTION OF ACTIVITY<br />
MATOSINHOS REFINERY / DATA BOOK ON HEALTH, SAFETY AND ENVIRONMENT <strong>2011</strong>
01<br />
02<br />
FRAMEWORK 04 05 06 07 08 09 10 11<br />
3.1 <strong>Galp</strong> <strong>Energia</strong>’s Health, Safety<br />
and Environmental Policy risks to ensure Health, Safety and Environmental protection;<br />
<strong>Galp</strong> <strong>Energia</strong> acknowledges that the protection of the Health,<br />
Safety and Environment of its employees, customers and<br />
community in general, are essential values for the Organization<br />
sustainability and is, therefore, aware of its responsibility in<br />
managing the impact of its activities, products and services<br />
within the society of which it takes part.<br />
Thus, establishes a commitment to integrate Health, Safety<br />
and the Environment (HSE) into the Company’s strategy and<br />
activities, as well as into the continuous improvement of<br />
its performance, making these it’s management pillars and<br />
thereby contributing to achieving a sustainable development<br />
and corporate excellence.<br />
<strong>Galp</strong> <strong>Energia</strong> is committed to:<br />
• establish Health, Safety and Environmental protection as<br />
fundamental values of the Company;<br />
• acknowledge that managing Health, Safety and the<br />
Environment is a direct leadership responsibility and risk<br />
prevention is a shared responsibility within the Organization;<br />
• promote training for all employees in these subjects, involving<br />
partners and other interested parties, committing them to<br />
Health, Safety and the Environmental matters in order to act<br />
proactively both within and outside the working environment;<br />
• apply the best management practices and technical solutions<br />
available, in addition to legal compliance, in continuous<br />
prevention strategies by identifying, controlling and monitoring<br />
3.2 Introducing the refi nery<br />
Operator Details<br />
The <strong>Matosinhos</strong> refi nery is an asset of Petrogal, S.A., a company<br />
in the <strong>Galp</strong> <strong>Energia</strong> Group. The following table shows some<br />
relevant details:<br />
<strong>Matosinhos</strong> refi nery<br />
Leça da Palmeira, Apartado 3015 <strong>Matosinhos</strong><br />
4451-852 - Leça da Palmeira<br />
Telephone: + 351 229 982 100<br />
Fax: + 351 229 982 196<br />
CAE: 19201 - Manufacture of Refi ned Petroleum Products<br />
Date of incorporation: March 26 th 1976<br />
Headquarters: Rua Tomás da Fonseca - Torre C - 1600-209 Lisboa<br />
Telephone: + 351 217 242 500 - Fax: + 351 217 240 573<br />
Equity: € 516,750,000<br />
Tax registration number: 500 697 370<br />
Registration number at the Lisbon CRC: 523<br />
• create conditions that allow the Organization as a whole to be<br />
permanently prepared to respond to emergencies;<br />
• ensure the sustainability of projects, ventures and products<br />
throughout their life cycle, through the use of technology,<br />
facilities, resources and best practices to prevent or minimize<br />
adverse consequences;<br />
• establish challenging targets and goals, measuring and<br />
evaluating the results obtained and taking the necessary<br />
action to pursue them;<br />
• ensure effi cient use of energy and resources and the<br />
incorporation of safe and innovative technologies when<br />
managing its activities, minimizing the impact, so as to<br />
guarantee the Company’s sustainability and environmental<br />
protection;<br />
• make this policy known and available, in a responsible and<br />
transparent way, to all interested parties, communicating<br />
regularly the Company’s Health, Safety and Environmental<br />
performance.<br />
<strong>Galp</strong> <strong>Energia</strong>, therefore, assumes its role as a socially<br />
and environmentally responsible Company, operated by<br />
a motivated, competent and innovative team of people,<br />
committed to protect the Health, Safety and Environment of its<br />
employees, customers, partners and the community, actively<br />
contributing to the wellbeing of the society.<br />
New industrial units<br />
MATOSINHOS REFINERY / DATA BOOK ON HEALTH, SAFETY AND ENVIRONMENT <strong>2011</strong><br />
11<br />
03
03 01 02<br />
FRAMEWORK 04 05 06 07 08 09 10 11<br />
12<br />
Organizational Model<br />
As mentioned before, there are 470 employees working in the<br />
<strong>Matosinhos</strong> refi nery, spread across different areas, whether<br />
Organizational structure<br />
Acompanhamento Monitoring de<br />
Construção of construction e Comissioning and<br />
commissioning<br />
HSEQ AQS<br />
Environment Ambiente<br />
Qualidade Quality<br />
Segurança Safety<br />
Operações Operations<br />
Fabrica de<br />
combustíveis<br />
Fuels Plant<br />
Fabrica de<br />
óleos Base base oil<br />
Fabrica de<br />
Aromatics aromáticos plant<br />
Fábrica de<br />
Utilidades Utilities<br />
Movimentação<br />
Storage and oil<br />
movements produtos<br />
Integridade e<br />
conservação Integrity and de<br />
conservation activosassets<br />
Shutdowns Paragens and e<br />
empreitadas<br />
contract work<br />
Preservation Conservaçãoof<br />
de assets activos<br />
Fiabilidade Reliability<br />
Gestão Project de<br />
projectos management e Eng.ª<br />
and engineering<br />
It is also important to present the Integrated Organization<br />
Structure of HSE of the refi nery.<br />
Through the Integrated Organization of HSE, <strong>Matosinhos</strong><br />
refi nery reiterates its commitment in the pursuit for excellence<br />
in its HSE performance, based on the fundamental principle of<br />
line accountability.<br />
Structure of the HSE organisation<br />
Group of excellence for the<br />
investigation of accidents<br />
HSE SubC<br />
Aromatics Plant<br />
HSE SubC<br />
Fuels Plant<br />
MATOSINHOS REFINERY / DATA BOOK ON HEALTH, SAFETY AND ENVIRONMENT <strong>2011</strong><br />
<strong>Matosinhos</strong> refinery<br />
HSEC Committee<br />
HSE SubC<br />
Oils Plant<br />
procedural, technical support services or management. The<br />
following diagram shows the organizational structure of the<br />
refi nery:<br />
Techinal Técnica<br />
Procedure Controlo<br />
processual control<br />
Tecnologia Technology<br />
Laboratório Laboratory<br />
Inspecção Inspection<br />
Performance e<br />
Performance planeamento and<br />
planning de produção production<br />
Programação<br />
Programming<br />
Performance Análise de<br />
performance analysis<br />
Transversal Projectos<br />
Transversais projects<br />
Planeamento de<br />
Planning controlo control e serviços and<br />
management de gestão services<br />
Management Controlo<br />
de control gestão<br />
Movimento<br />
Commercial<br />
movement comercial<br />
Serviços<br />
General<br />
gerais<br />
services<br />
The management of HSE is participative with the involvement<br />
of all hierarchical levels, and the hierarchical responsibility in<br />
HSE is defi ned and applied at all levels and functions, where<br />
functions of technical advisory in the Organization are assumed.<br />
In the following diagram the structure of the HSE organization<br />
is represented.<br />
HSE SubC<br />
Utilities Plant<br />
Group of excellence for<br />
standards and procedures<br />
Working groups<br />
HSE SubC<br />
Products Plant
01<br />
02<br />
The HSE Committee (HSEC) of <strong>Matosinhos</strong> refi nery is<br />
constituted by the board members, heads of the Health, Safety,<br />
Environment and Quality (HSEQ) areas and by the occupational<br />
physician. the HSEC is also constituted by the responsible<br />
members for the Lubricants Plant and the Boa Nova Depot,<br />
to ensure a proper coordination of actions and information<br />
exchange with these units.<br />
Directly under the HSEC of the refi nery there are the HSE<br />
Sub-Committees (SubHSEC) for each Factory and for Storage<br />
and oil movements, which ensure the disclosure and alignment<br />
with the HSEC. These SubHSEC are usually composed by the<br />
responsible for the area, the deputy chief, shift supervisor, two<br />
operators (at least one from outdoors), the representative of<br />
the zone maintenance, the representative of zone inspection,<br />
the hse element for zone support, and other elements that<br />
may participate temporarily or permanently.<br />
In <strong>2011</strong> the Groups for Excellence (GE) of the refi nery were<br />
active and were dedicated to the report and investigation of<br />
events and incidents and the policies and procedures group.<br />
In addition to the structure here above represented, <strong>Matosinhos</strong><br />
refi nery also participates in corporate GE, particularly in the GE<br />
Process Safety, for which it is the leader, and the GE Service<br />
Providers.<br />
Location and surroundings<br />
<strong>Matosinhos</strong> refi nery is located on the Douro Coast between<br />
Boa-Nova and Cabo do Mundo, in the parishes of Leça da<br />
Palmeira and Perafi ta, in the municipality of <strong>Matosinhos</strong>. It<br />
covers an area of approximately 400 ha, to the northeast of the<br />
city of Porto, about 2 km north of the Terminal de Leixões.<br />
The refi nery has good access roads and a link to the Oil<br />
Terminal and monobuoy, by which raw materials are received<br />
and fi nished products dispatched.<br />
The following facilities in the refi nery surroundings deserve<br />
special mention:<br />
• Perafi ta Gas Depot (Parque de Gas Perafi ta), with facilities<br />
for Liquid Petroleum Gas (LPG) storage and fi lling of tanker<br />
vehicles and cylinders, situated to the northeast of the<br />
refi nery;<br />
• Boa Nova Private Hospital;<br />
• canning factory, vehicle repair workshops and garages, about<br />
150 m from the refi nery fence;<br />
• urban spaces and population centres, namely Leça da<br />
Palmeira and <strong>Matosinhos</strong> to the south, Aldeia Nova, Poupas<br />
and Telheira to the north, and Almeiriga, Amorosa, Goncalves<br />
and Avessada to the east;<br />
• forest, agricultural land and bush land;<br />
• dunes with typical vegetation.<br />
FRAMEWORK 04 05 06 07 08 09 10 11<br />
There are no Nature conservation areas close to the refi nery.<br />
The following is a list of the land-planning schemes in force for<br />
the region bordering the refi nery:<br />
• Leça River Catchment Scheme (Plano de Bacia Hidrográfi ca do<br />
Rio Leça);<br />
• Caminha – Espinho Coastal Strip Land-use Plan (Plano de<br />
Ordenamento da Orla Costeira Caminha – Espinho);<br />
• the Forest Land-use Plan for the Porto Metropolitan Area and<br />
between Douro and Vouga (Plano Regional de Ordenamento<br />
Florestal da Area Metropolitana do Porto e Entre Douro e Vouga);<br />
• northern Region Land-use Plan (Plano Regional de<br />
Ordenamento do Territorio para a Regiao Norte);<br />
• management scheme for the Municipality of <strong>Matosinhos</strong><br />
(Plano Director Municipal de <strong>Matosinhos</strong>);<br />
• urbanisation scheme between Rua de Belchior Robles and<br />
Avenida dos Combatentes da Grande Guerra in Leça da<br />
Palmeira (Plano de Urbanizacao entre a Rua de Belchior<br />
Robles e a Avenida dos Combatentes da Grande Guerra em<br />
Leça da Palmeira).<br />
Although multiple operators contribute to the air and water<br />
quality in the region under the infl uence of the <strong>Matosinhos</strong><br />
industrial complex, and given that the refi nery monitors<br />
liquid and gas emissions to control the impact of its activity,<br />
it is relevant to provide information on the quality of these<br />
descriptors in the surroundings.<br />
The municipality of <strong>Matosinhos</strong> is part of a monitoring network<br />
of the air quality in the Northern Region and is included in<br />
the agglomeration of the Porto Coast. Of the 15 stations that<br />
compose the agglomeration of Porto Coast and that are spread<br />
between Espinho, Gondomar, Maia, <strong>Matosinhos</strong>, Porto, Vila do<br />
Conde and Valongo, fi ve are located in <strong>Matosinhos</strong>.<br />
The following graphs show the history of the Air Quality Index<br />
for the Porto Coast region. It can be seen that the quality of air<br />
has improved consistently.<br />
Air quality index - Porto Litoral (no. days)<br />
2007<br />
19 158 98 89 1<br />
2008<br />
28 236 67 34 1<br />
2009<br />
46 208 75 36<br />
2010<br />
56 178 80 51<br />
Very good Good Average Weak Bad<br />
Source: Link to the site of the Portuguese Environmental Agency: http://www.qualar.org/<br />
INDEX.PHP?page=1.<br />
Note: In the index shown above, the following pollutants are considered Nitrogene Dioxide<br />
(NO ), Sulphur Dioxide (SO ), Carbone Monoxide (CO) and Particulate Matter (PM10 – less than<br />
2 2<br />
10 μm diameter). The information above considers the available statistics.<br />
MATOSINHOS REFINERY / DATA BOOK ON HEALTH, SAFETY AND ENVIRONMENT <strong>2011</strong><br />
13<br />
03
03 01 02<br />
FRAMEWORK 04 05 06 07 08 09 10 11<br />
14<br />
In terms of surface water, the region is the watershed between<br />
the Leça River and Onda River catchments. Watercourses are<br />
temporary, with natural drainage occurring only after signifi cant<br />
rainfall.<br />
Groundwater resources have low vulnerability to pollution.<br />
The beaches in front of the <strong>Matosinhos</strong> refi nery constitute a<br />
large part of its surroundings, and all of them were rewarded in<br />
<strong>2011</strong> with the blue fl ag.<br />
Source: Link to the site Blue Flag European Association:<br />
http://www.abae.pt/programa/BA/zonas_balneares/galardoadas.php<br />
http://www.abae.pt/programa/BA/galardao/2010/praias_marinas.php?t=praias<br />
Historical Overview<br />
MATOSINHOS REFINERY / DATA BOOK ON HEALTH, SAFETY AND ENVIRONMENT <strong>2011</strong><br />
The blue fl ag symbolizes environmental quality and<br />
consequently respect for the criteria of environmental<br />
information and education, for the quality of water, for<br />
environmental management and also for the safety and<br />
services provided.<br />
The blue fl ag award is therefore an indicator of environmental<br />
quality for which the excellent performance of the refi nery has<br />
contributed strongly, not only in the fi eld of water but also on<br />
the part of air quality.<br />
<strong>Matosinhos</strong> refi nery integrates this context and proves that its<br />
“commitment to the environment goes beyond legal issues,<br />
always looking for a sustainable integration in the environment”.<br />
Year Event<br />
1966 The start of the construction project for the <strong>Matosinhos</strong> refi nery, with a crude oil processing capacity of 2Mtonnes/year.<br />
1967 Construction works began on September 1967.<br />
1969 Progressive start-up of processing facilities on September.<br />
1970 <strong>Matosinhos</strong> refi nery offi cially opens, 5th June.<br />
1973<br />
Between September and December – First Revamping to give a capacity of 4.5 tonnes/year, consisting of transforming the visbreaking and<br />
thermal cracking facility into a new visbreaking facility, with the equipment made available for a new atmospheric distiller.<br />
1975 Second Revamping with the construction of a new crude oil treatment line.<br />
1978 a 1982<br />
Shutdown of various facilities of one of the lines as a consequence of the oil shock of 1973/74 and subsequent startup of the Sines refi nery, with a<br />
drastic reduction in the treatment of crude oil at the <strong>Matosinhos</strong> refi nery.<br />
1981<br />
Start of development of the Aromatics Plant, with a capacity of 350 thousand tonnes/year for benzene, toluene, paraxylene, orthoxylene and<br />
aromatic and aliphatic solvents.<br />
1982 The refi nery crude oil processing capacity rises to 4.5 Mtonnes/year.<br />
1983<br />
Transformation of a semi-regenerative platforming facility into a CCR – Continuous Catalyst Regeneration Platforming facility, so that the quality and<br />
quantity of production of the catalytic regeneration plants is maintained.<br />
Modifi cation of the Base Oil Plant so as to increase its production capacity from 100 thousand to 150 thousand tonees/year of base oils. The<br />
1984<br />
production of paraffi n and bitumen increases from 5 thousand and 30 thousand tonees/year to 10 thousand and 130 thousand tonnes/year<br />
respectively.<br />
1988<br />
Reactivation of the Unifi ning and Platforming plants due to contracting by third parties for treating crude oil. Renovation of the WWTP, so that<br />
treatment capacity increases from 150 to 450 m3 /h.<br />
1989 Changes to allow the Vacuum Distillation plant to be fed with external Atmospheric Residue.<br />
1991<br />
Modifi cations of the Unifi ning and Platforming plants to increase their capacity and decrease their energy consumption. Shutdown of Unifi ning line<br />
3000.<br />
1992<br />
Modifi cations to the Parex, due to the requirements of the international market regarding purity and growth in consumption, leading the total<br />
production of the Aromatic Factory to increase to 440 thousand tonnes/year.<br />
1994 Modernisation of the Vacuum Distillation Unit of the Base Oil Plant.<br />
1996/7<br />
Construction of the Road Tanker Filling Station with a Vapour Recovery Unit (VRU), construction of a new Diesel Desulphurization Plant and<br />
associated plants: sulphur production plant and acid water stripper, and revamping of an amine plant.<br />
1997/8 Installation of a monobuoy off the Port of Leixões in order to increase the refi nery’s operational readiness and profi tability.<br />
2000 Construction of a hydrogenation plant for oil paraffi n and waxes.<br />
2001 New Hydrogen Purifi cation plant enters operation.<br />
2004 Modernisation of the Waste Park.<br />
2005 Issue of licence No.197.02 for emitting Greenhouse Gases.<br />
2006<br />
New pipelines connecting the refi nery to the Leixões Oil Terminal start operation.<br />
The monobuoy enters operation.<br />
2007<br />
Issue of the Environmental Permit for the <strong>Matosinhos</strong> refi nery. New storm drains for the Wastewater Treatment Plant (WWTP) enter operation.<br />
General shutdown.<br />
Start of works to reconfi gure the <strong>Matosinhos</strong> refi nery.<br />
2008<br />
Upgrade of the old storm drains.<br />
Inspection and Renovation of the entire oil drainage network completed.
01<br />
02<br />
Historical Overview (cont.)<br />
Year Event<br />
2009<br />
2010<br />
<strong>2011</strong><br />
FRAMEWORK 04 05 06 07 08 09 10 11<br />
Electrostatic Precipitators for reducing particulate emissions from the Utilities Plant enter into operation on boilers G and H.<br />
The system for removing chlorides from the LPG fl ow from the two reforming units, U1300 and U3300, enters operation.<br />
The system for removing hydrochloric acid from the hydrogen-rich fl ows from the two reforming units, U1300 and U3300, enters operation.<br />
Installation of Low-NO burners in boiler H.<br />
X<br />
Installation of a new nitrogen production plant.<br />
Replacement of the gas analyzers in the fi xed emission sources.<br />
Installation of new production unit of nitrogen in the Aromatics Plant.<br />
Deep remodeling of the furnace H-3001.<br />
Remodeling of the train swap topping Un. 3000.<br />
Revamping unit Desulfurization of HDS Diesel II (increased capacity of the Unit).<br />
New storage tanks for diesel, TK-6117 TK-6117 A and B.<br />
Increase the capacity of recovering the water treated by WWTP<br />
New fi lter U-1500.<br />
Start-up of the new vacuum distillation unit with a treatment capacity of 6000 tons/day of atmospheric residue.<br />
Start-up of new visbreaker unit with a capacity of 2400 tons/day of treatment of vacuum residue.<br />
Substitution of the reactors of catalytic reforming unit continuously regenerating.<br />
Refurbishment of the HDS I of diesel oil desulfurization to allow a deeper removal of sulfur from these chains.<br />
Installation of high pressure natural gas pipeline to supply the new refi nery and the cogeneration plant.<br />
3.3 Description of activity<br />
Capacity<br />
<strong>Matosinhos</strong> refi nery has an installed refi ning capacity of 5.5<br />
million tonnes of crude oil per year, producing a wide range of<br />
refi ned commercial products, namely:<br />
• Liquid petroleum gas<br />
• Petrol<br />
• Naphtha<br />
• Jet/Kerosene<br />
• Diesels<br />
• Fuels<br />
• Base oils<br />
• Lubricating oils<br />
• Paraffi ns<br />
• Aliphatic and aromatic, solvents, benzene,<br />
toluene and xylenes<br />
• Bitumen<br />
The storage capacity of the refi nery is currently 767,132 m 3<br />
crude oil, amounting to a total of 1,865,096 m 3 of storage<br />
capacity.<br />
The management and production plans of the refi nery, with<br />
an impact in the storage management, consider the need to<br />
ensure the safety of supply of the petroleum products market.<br />
Description of the principal raw materials<br />
<strong>Matosinhos</strong> refi nery refi nes two types of crude: SOUR and<br />
SWEET, the names deriving from their sulphur content. The<br />
crude oil in <strong>2011</strong> came mostly from Saudi Arabia, Brazil, Algeria,<br />
Nigeria, Angola, Cameroon and North Sea.<br />
In July <strong>2011</strong>, the refi nery adjusted its crude oils mix as the new<br />
Vacuum and Visbreaker units started to operate, being able to<br />
load heavier and more acid crudes and diversifying the sources.<br />
From January to May, the crude oils came mostly from Algeria,<br />
Nigeria and North Sea, with an API of 40.5º and average acidity<br />
of 0.1% (m/m).<br />
From June to December, with the startup of the new units, the<br />
mix has been adjusted to heavier crude oils, with an average<br />
API of 30.7º and higher acidity, about 0.4 % (m/m), mainly<br />
coming from Brazil and Angola.<br />
Type of line Indicator 2007 2008 2009 2010 <strong>2011</strong><br />
Proportion of use (%) 71.10 69.80 62.00 56.61 65.38<br />
SWEET<br />
Load density (º API) 41.02 40.67 40.69 40.35 33.90<br />
Sulphur (% m/m) 0.13 0.11 0.12 0.13 0.32<br />
Proportion of use (%) 28.90 30.20 38.00 43.39 34.62<br />
SOUR<br />
Load density (º API) 32.94 33.23 33.18 35.52 32.83<br />
Sulphur (% m/m) 1.96 1.86 1.70 1.58 1.90<br />
MATOSINHOS REFINERY / DATA BOOK ON HEALTH, SAFETY AND ENVIRONMENT <strong>2011</strong><br />
15<br />
03
03 01 02<br />
FRAMEWORK 04 05 06 07 08 09 10 11<br />
16<br />
The supply of crude oil is subject to requirements and<br />
commercial factors, technical and environmental features,<br />
such as: quality, availability in the market, international prices,<br />
production plans of the refi nery and storage capacity.<br />
Description of process<br />
<strong>Matosinhos</strong> refi nery carries out the following activities under<br />
the Integrated Pollution Protection and Control (IPPC) Regime: The fi gure below shows the arrangement of the refi nery and<br />
various units that support its operation:<br />
<strong>Matosinhos</strong> refinery configuration<br />
The following schematic shows the simplifi ed production process:<br />
Process diagram<br />
Arabian<br />
Light<br />
SB, EA, CPC,<br />
Forties,...<br />
Aromatics<br />
Plant Flare<br />
Aromatics<br />
Plant<br />
FOB<br />
d.a.<br />
Crude oil<br />
atmospheric<br />
distillation<br />
Atmospheric<br />
residue<br />
vacuum<br />
distillation<br />
Fuels<br />
Plant<br />
MATOSINHOS REFINERY / DATA BOOK ON HEALTH, SAFETY AND ENVIRONMENT <strong>2011</strong><br />
LPG<br />
Naphta<br />
Diesel<br />
Fuel<br />
Transport<br />
Products<br />
Processing<br />
IPPC Identifi er Description<br />
1.1 Combustion facilities with combustion heat output<br />
over 50MW<br />
1.2 Oil and gas refi neries<br />
4.1. a) Chemical plants intended to manufacture products<br />
based on organic chemicals<br />
Despatch<br />
New units<br />
Vacuum/Visbreaker<br />
Thermoelectric<br />
Power Station<br />
Processing<br />
Cogeneration<br />
Lubricants<br />
Plant<br />
Base Oils<br />
Plant<br />
FAR<br />
Bitumens<br />
Paraffins<br />
Base Oils<br />
LPG<br />
Petrols<br />
Aromatics<br />
Diesels<br />
and Jet<br />
Fuel
01 02 03 ACTIVITIES, ATIVIDADES, ACTIONS AÇÕES AND E PROJETOS PROJECTS<br />
04<br />
05 06 07 08 09 10 11<br />
04 . ACTIVITIES, ACTIONS<br />
AND PROJECTS<br />
4.1<br />
4.2<br />
4.3<br />
COGENERATION CONSTRUCTION<br />
COSTS AND INVESTMENTS<br />
HEALTH, SAFETY AND ENVIRONMENT TRAINING<br />
MATOSINHOS REFINERY / DATA BOOK ON HEALTH, SAFETY AND ENVIRONMENT <strong>2011</strong><br />
17<br />
04
04 01 02 03 ACTIVITIES, ACTIONS AND PROJECTS 05 06 07 08 09 10 11<br />
18<br />
4.1 Cogeneration construction<br />
The new Cogeneration Plant – <strong>Matosinhos</strong><br />
refi nery PORTCOGERAÇÃO<br />
Within a short time, <strong>Matosinhos</strong> refi nery will enjoy, together<br />
with Sines refi nery, the largest and most modern Cogeneration<br />
power center existing in the country. It will be the aftermath<br />
of a project long desired by the refi nery and that will make<br />
a decisive contribution in the energy optimization of <strong>Galp</strong><br />
<strong>Energia</strong>’s Industrial Complex as well as on reducing its<br />
environmental impact.<br />
Since the beginning this project has overlapped the conclusion<br />
of the Cogeneration Center of Sines (SINECOGERAÇÃO), which<br />
has the same kind of design, so it was possible to transpose<br />
into this second the experience of the fi rst.<br />
Indeed, and taking advantage of the sequence relationship<br />
in constructing both plants, <strong>Galp</strong> Power used the same team<br />
of engineers for the management and supervision of both<br />
projects with all the benefi ts it carries along.<br />
On the other hand, both <strong>Galp</strong> <strong>Energia</strong> Refi neries will use the<br />
same kind of technology in the simultaneous generation<br />
of electricity and steam which will create unquestionable<br />
operational synergies between both utilities factories.<br />
Thus <strong>Galp</strong> <strong>Energia</strong> will take a more a decisive step in the<br />
modernization of its refi ning apparatus making it more energy<br />
effi cient, better integrated with its environmental surroundings<br />
and more competitive to embrace in a more sustainable<br />
manner a new lifecycle starting in 2012.<br />
As happened in the previous cogeneration design for Sines<br />
refi nery, this new cogeneration center managed to obtain,<br />
from the European Investment Bank (EIB), a signifi cant increase<br />
of funding that is a mark of credibility to the project and a<br />
prize by the rigor with which <strong>Galp</strong> <strong>Energia</strong> promotes, manages<br />
and implements this kind of investments in its industrial core<br />
business.<br />
In addition to all benefi ts to the refi ning facilities, these new<br />
cogeneration power plants will create both value in Gas &<br />
Power, by adding new volumes of natural gas and by the use<br />
of gas in the effi cient generation of electricity which will be<br />
delivered to the public electricity network, that in the case of<br />
<strong>Matosinhos</strong> refi nery, is operated by EDP Distribution.<br />
The signifi cant steam consumption in the process of refi ning<br />
along its continuous operation regime, makes <strong>Matosinhos</strong><br />
refi nery an excellence site for implementing the cogeneration<br />
technology and thus driven by the Utilities Factory team, this<br />
project gathers all the conditions to confi rm the good results<br />
already achieved in the Sines Cogeneration and also contribute<br />
to the success of this <strong>Galp</strong> <strong>Energia</strong> strategic industrial complex.<br />
MATOSINHOS REFINERY / DATA BOOK ON HEALTH, SAFETY AND ENVIRONMENT <strong>2011</strong><br />
The design of the new Cogeneration Plant<br />
The new Cogeneration Plant consists of two gas turbines,<br />
industrial type of General Electric, model Frame 6B equipped<br />
with combustion chambers Dry Low NOx (DLN ENTERPRISES)<br />
with a nominal electrical power of unit 41 MWe. This model of<br />
gas turbine engines, industrial design (Heavy Duty), has more<br />
than 1000 references worldwide of which, several hundreds,<br />
are installed in the industry of Oil &Gas.<br />
Gás Turbine GE Frame 6B (DLN)<br />
Gas turbine technical data:<br />
• 17 stages bolted axial compressor;<br />
• equipped with Inlet Guide Vanes (IGV);<br />
• combustion chamber consisting of 10 annular elements;<br />
• NO x emissions: 15 ppm (15% O2) for natural gas;<br />
• turbine 3 stages of screwed connection.<br />
The two gas turbines are attached to two recovery boilers<br />
(Heat Recovery Steam Generators) that use the thermal energy<br />
contained in exhaust gases to produce steam for the refi nery.<br />
These boilers have natural gas post-combustion burners that<br />
using the exhaust gases as oxidizing, allow to modulate the<br />
steam unit production (@ 66 barg and 450ºC) since 85 ton/h<br />
(minimum) up to 130 ton/h (Maximum Continuous Rating),<br />
keeping unchanged the electricity production of the gas turbine<br />
that is attached to each boiler.<br />
Additionally the boilers are individually equipped with fresh-air<br />
systems which allow to maintain its operation in case of<br />
breaking down the Gas turbine. The boilers are manufactured<br />
by NEM that supplied in Portugal the combined-cycle recovery<br />
boilers of Tapada do Outeiro and Carregado.
01<br />
02<br />
03<br />
3D model of the new cogeneration center<br />
Cogeneration center technical data:<br />
• 2 x GE Fr6B DLN + 2 x NEM HRSG (eq. c/ PC & FA);<br />
• nominal heat output: 82 MWe (2X41 MW e );<br />
• steam generation capacity: 260 ton\h (@ 450 C, 66 barg);<br />
• electricity production: 670 GWh\year (forecast);<br />
• steam production: 1.6 megaton Tsar/year (forecast);<br />
• natural gas consumption: 232 Mm 3 (n)/year (forecast);<br />
• equivalent electrical effi ciency (REE): 75%.<br />
Under normal operation, the new Cogeneration Plant will<br />
produce the equivalent of about 70% of the electricity<br />
consumed in the municipality of <strong>Matosinhos</strong> with an equivalent<br />
(REE) electrical effi ciency of 75% (this value compares with<br />
the electrical effi ciency of a combined cycle power plant,<br />
which is currently 60%) which shows a primary energy savings<br />
exceeding 15%, and a reduction of CO 2 emissions at national<br />
level of 400,000 ton/year.<br />
Based upon these effi ciency values, the new power of the<br />
refi nery of <strong>Matosinhos</strong> is classifi ed, according to the Community<br />
Directive 2004/8/EC, as “high effi ciency” cogeneration.<br />
Interconnection of new combined heat<br />
and power plant with the external energy<br />
infrastructure<br />
The construction of New Combined Heat and Power meant<br />
new interconnections of the Industrial Plant to high pressure<br />
natural gas network and high voltage electricity distribution.<br />
ACTIVITIES, ACTIONS AND PROJECTS 05 06 07 08 09 10 11<br />
The construction of the new pipeline and the GRMS (Gas<br />
Regulation and Metering Station) was of the responsibility<br />
of REN Gasodutos, having the electrical interconnection<br />
pipeline between the New Switch Station (built under the<br />
new combined Heat and Power Supply) and the Electrical<br />
Substation of Santa Cruz do Bispo powered by EDP distribution,<br />
been of the responsibility of PORTCOGERAÇÃO and the second<br />
section between this Substation and Substation of Custóias<br />
operated by REN, stayed been supported by EDP Distribution<br />
through previously established compensation agreements with<br />
PORTCOGERAÇÃO.<br />
Electrical interconnection between the Industrial Complex and REN<br />
Technical data of the Electrical Interconnection<br />
• fi rst section: two subway lines, the cutting, at 60kV from the<br />
Switch Station of <strong>Matosinhos</strong> refi nery to Santa Cruz do Bispo<br />
substation, extension: 3,751 m.<br />
• second section: two mixed lines, at 60kV, consisting fi rstly<br />
of underground line from Santa Cruz do Bispo substation to<br />
support no. 1, with an extension of 2,926 m, and an aerial<br />
part from support no 1. to support no. 4, with an extension of<br />
648 m, and by a fi nal underground part, from support no. 4 to<br />
Custóias substation in a length of 112 m.<br />
MATOSINHOS REFINERY / DATA BOOK ON HEALTH, SAFETY AND ENVIRONMENT <strong>2011</strong><br />
19<br />
04
04 01 02 03 ACTIVITIES, ACTIONS AND PROJECTS 05 06 07 08 09 10 11<br />
20<br />
Photographs of the construction period<br />
Construction site<br />
End of assembly<br />
Substation<br />
MATOSINHOS REFINERY / DATA BOOK ON HEALTH, SAFETY AND ENVIRONMENT <strong>2011</strong>
01<br />
02<br />
03<br />
The following chart shows the major costs and investments<br />
in environment. Note that the indicator of environmental<br />
protection and management includes the costs and<br />
The amounts annually reported as investments for the<br />
environment show the projects cycle. Thus their development<br />
must be seen in an integrated way forming successive steps<br />
for the consolidation of investment plans. In the period under<br />
review (2007-<strong>2011</strong>) the accumulated costs and investments in<br />
the environment is 111 million Euros.<br />
In the year <strong>2011</strong> investments in the safety chapter amounted<br />
to a total of 11 million Euros.<br />
Of the amounts shown above, the following chart distinguishes<br />
investment costs, evidencing the concern of the refi nery in the<br />
renewal and pollution prevention.<br />
ACTIVITIES, ACTIONS AND PROJECTS 05 06 07 08 09 10 11<br />
4.2 Costs and investments<br />
Cost and investments concerning the protection of the environment (€M)<br />
investments not only in measures to protect against noise<br />
and vibrations, but also measures to protect biodiversity and<br />
landscape.<br />
2007<br />
8.20 2.33 5.19 7.18 0.10<br />
2008<br />
11.39 0.82 3.16 5.19 0.77<br />
2009<br />
1.47 1.19 6.08 2.11 3.90<br />
2010<br />
1.80 0.73 5.35 18.63 0.37<br />
<strong>2011</strong><br />
2.19 0.87 5.58 14.08 0.54<br />
Water protection Waste management Soil and groundwater protection<br />
Air and climate protection Environment protection and management (noise, biodiversity and landscape)<br />
Relationship between costs and environmental<br />
investments (M€)<br />
2007<br />
22.45 4.81<br />
2008<br />
18.72 2.60<br />
2009<br />
12.00 2.75<br />
2010<br />
24.70 2.18<br />
<strong>2011</strong><br />
18.55 4.63<br />
Investments Costs<br />
Observing the nature of investments in environmental<br />
protection and management, it may be concluded that there<br />
is a substantial stake in the refi nery in measures aimed at<br />
reducing the impact of pollution produced. It is emphasized<br />
that the adoption of inline technology often means technical<br />
and structural constraints that prevent the implementation of<br />
integrated technologies of pollution prevention as desired.<br />
Overview of environment investments in <strong>2011</strong><br />
87%<br />
End-of-line<br />
equipment<br />
13%<br />
Integrated<br />
equipment and<br />
technology<br />
MATOSINHOS REFINERY / DATA BOOK ON HEALTH, SAFETY AND ENVIRONMENT <strong>2011</strong><br />
21<br />
04
04 01 02 03 ACTIVITIES, ACTIONS AND PROJECTS 05 06 07 08 09 10 11<br />
22<br />
4.3 Training in Health, Safety and the Environment<br />
The training policy of <strong>Galp</strong> <strong>Energia</strong> seeks to ensure employees<br />
personal and professional development, aiming to contribute<br />
to the consolidation of the group’s culture, promote the<br />
development of strategic perspective on value creation,<br />
supporting the individual development plans.<br />
The themes of Safety, Health and Environment, especially in<br />
an industrial activity as the refi ning, are absolutely strategic,<br />
and over the past few years the cultural development of the<br />
Organization has made clear its commitment to training and<br />
qualifi cation as essential tools in ensuring sustainability of the<br />
activity in its various strands. Training plays a key role and<br />
therefore is taken with great seriousness at the refi nery and<br />
between employees and service providers.<br />
The realization of this vision unfolds in two parts. The fi rst<br />
focuses on the training and qualifi cation of employees of the<br />
refi nery and takes several available formats: on-job, classroom<br />
or e-learning, packing various learning processes.<br />
Number of hours of HSE training programmes<br />
2008<br />
2009<br />
2010<br />
<strong>2011</strong><br />
4,254<br />
4,123<br />
6,356<br />
Number of trainnes in HSE training programmes<br />
2008<br />
2009<br />
2010<br />
<strong>2011</strong><br />
467<br />
Number of HSE training programmes<br />
2008<br />
2009<br />
2010<br />
<strong>2011</strong><br />
21<br />
68<br />
97<br />
648<br />
843<br />
869<br />
MATOSINHOS REFINERY / DATA BOOK ON HEALTH, SAFETY AND ENVIRONMENT <strong>2011</strong><br />
7,854<br />
313<br />
<strong>Matosinhos</strong> refi nery as a way to keep ensuring that the<br />
procedures and rules are understood and to assure everyone’s<br />
commitment, provides since a long time through internal<br />
resources, communication and training sessions of various<br />
kinds, which are mainly distributed by fi ve groups: hosting,<br />
training, awareness, warning and Emergency Brigade either to<br />
internal employees or to service providers employees.<br />
In <strong>2011</strong>, 516 training courses were provided distributed by the<br />
different types of training as it can be seen in the graph below.<br />
Number of HSE training programmes provided<br />
2008<br />
2009<br />
2010<br />
<strong>2011</strong><br />
473<br />
594<br />
72 66 15 281 187<br />
66 36 15 178 221<br />
Total Training Awarness<br />
Warning Induction Emergency brigade<br />
Except for the Emergency Brigade training, the set of trainings<br />
now under consideration are not programmable, and are given<br />
according to the circumstances and events occurring each year,<br />
such as for instance the technical shutdowns for maintenance,<br />
which somehow explain the change seen over time, recorded<br />
in previous graphs.<br />
The training, warning and awareness courses are distinguished<br />
mainly by their purpose.<br />
The fact that the refi nery intends to raise and adjust the<br />
performance indicators with the best available references<br />
requires that, whenever deviations to indicators are identifi ed,<br />
awareness campaigns are promoted to warn and start<br />
improvement actions.<br />
In turn, the continuous improvement of procedures, practices<br />
and routines requires training as a way to bind throughout the<br />
organization the general knowledge of the processes of change.<br />
The failure of procedures, adoption of unfair practices or<br />
performance of unsafe acts, requires the completion of<br />
warning actions as a way to ensure non-recurrence of these<br />
attitudes in future behaviors.
01<br />
02<br />
03<br />
Hosting courses represent 34% of the total provided for <strong>2011</strong><br />
and include training given to all who access the facilities for the<br />
fi rst time.<br />
The percentage differences between the years 2010 and <strong>2011</strong>,<br />
respectively 45% and 34% are due to the fact that the year<br />
2010 endured a technical shutdown, which meant access to a<br />
large volume of employees in the facilities in that year.<br />
Number of hours of HSE training provided<br />
2008<br />
2009<br />
2010<br />
<strong>2011</strong><br />
ACTIVITIES, ACTIONS AND PROJECTS 05 06 07 08 09 10 11<br />
563<br />
70 46 9 215 343<br />
762<br />
69 52 8 442 265<br />
Total Training Awarness Warning Induction Emergency brigade<br />
Number of trainnes in HSE training programmes provided<br />
There are intervention teams, to act in actual emergency<br />
situations, and the fact that the refi nery is characterized as a<br />
facility with high-level hazard, pursuant to Decree-Law No<br />
254/2007, requires training activities, with a theoretical and<br />
practical component designated by Emergency Brigade training.<br />
The following graphs illustrate the number of training hours<br />
and number of participants in each above mentioned training.<br />
2008<br />
2,986<br />
2009<br />
4,305<br />
2010<br />
306 500 66 5,683 849<br />
<strong>2011</strong><br />
244 245 77 1,889 990<br />
Total Training Awarness Warning Induction Emergency brigade<br />
MATOSINHOS REFINERY / DATA BOOK ON HEALTH, SAFETY AND ENVIRONMENT <strong>2011</strong><br />
23<br />
04
05 01 02<br />
03<br />
04<br />
IN EM FOCUS FOCO<br />
05<br />
06<br />
07<br />
08<br />
09 10 11<br />
24<br />
05 . IN FOCUS<br />
MATOSINHOS REFINERY / DATA BOOK ON HEALTH, SAFETY AND ENVIRONMENT <strong>2011</strong>
01<br />
02<br />
03<br />
Monitoring air quality<br />
<strong>Matosinhos</strong> refi nery focuses heavily on minimizing the<br />
environmental impact of its business, and these efforts are<br />
shown in the development of its key indicators and the high<br />
level of investment to improve the industrial plant.<br />
In this guideline, between March 2010 and December <strong>2011</strong> a<br />
comprehensive study to assess the air quality surrounding the<br />
refi nery was carried out. This study emerges from the concern<br />
that was expressed by the Commission for Coordination<br />
04<br />
Toluene is an aromatic hydrocarbon insoluble in water with a<br />
typical odor of paint solvent. Chemically, it is a mono-substituted<br />
benzene derivative i.e. that presents one of the hydrogen<br />
atoms of the benzene ring replaced by CH 3 group. Toluene<br />
occurs naturally as a component of various petroleum products,<br />
being widely used as industrial raw material and as a solvent<br />
for paints, coatings, glues, oil and resins.<br />
The term xylene refers to a set of three isomers closely related<br />
with benzene (Ortho-, meta-, and para-xylene). Xylene is a<br />
colorless aromatic hydrocarbon, with sweet odor and highly<br />
fl ammable. The Ortho-xylene (o-xylene) is the only form of<br />
naturally occurring xylene; the other two are forms of human<br />
manufacture. The XYLENES are used in gasoline and as a<br />
solvent in printing industries, rubber and leather. P-xylene is<br />
Sources of benzene emissions<br />
82%<br />
Automobile<br />
exhaust<br />
In “Scientific American Magazine, February 1998”<br />
14%<br />
Industry<br />
3%<br />
Individual<br />
activities<br />
0.1%<br />
Cigarettes<br />
Another study, “Position Paper” drawn up in September 1998<br />
by the “Council Directive on Ambient Air Quality Assessment<br />
and Management Working Group Benzene”, calculates,<br />
quoting “Air Quality Report of the Auto Oil Programme”, that<br />
the anthropogenic origin of benzene is due to the following<br />
sources.<br />
IN FOCUS 06 07 08 09 10 11<br />
of Development of the North (CCDR-N) to the extent that<br />
indicative studies carried out by that entity, indicated<br />
concentrations of benzene allegedly above the legal limits.<br />
The parameters considered in this program for monitoring<br />
air quality were the compounds SO 2 (sulfur dioxide), NO x<br />
(nitrogen oxides) and BTX. Under the designation BTX is the<br />
group of benzene, toluene and xylene compounds, being<br />
natural chemicals that are found in petroleum products such as<br />
gasoline.<br />
a raw material used in the manufacture of polyethylene (PET),<br />
polyesters and polymers.<br />
Benzene is a colorless and highly fl ammable aromatic<br />
hydrocarbon, slightly soluble in water, with a sweet smell and<br />
a relatively high melting point. Being a known carcinogenic,<br />
its use as a component of gasoline is currently limited to 1%,<br />
although an important industrial solvent and precursor in the<br />
production of synthetic rubber, nylon, plastics, insecticides,<br />
paints, dyes, glues, gum, detergents and cosmetics.<br />
The existence of benzene in the atmosphere, with<br />
anthropogenic origin, has its main source, about 80%, in road<br />
traffi c as shown in this graph:<br />
Sources of benzene exposure<br />
45%<br />
Cigarettes<br />
In “Scientific American Magazine, February 1998”<br />
18%<br />
Automobile<br />
3%<br />
Industry<br />
34%<br />
Individual<br />
activities<br />
Source (%)<br />
Road traffi c 80 - 85<br />
Oil refi neries 0.3 - 1.5<br />
Fuel distribution 2.6 - 6<br />
Chemical industry 1.3 - 13<br />
Domestic heating (fi replaces) 3 - 7<br />
Solvent use 1 - 4<br />
MATOSINHOS REFINERY / DATA BOOK ON HEALTH, SAFETY AND ENVIRONMENT <strong>2011</strong><br />
25<br />
05
05 01 02 03 04<br />
IN FOCUS 06 07 08 09 10 11<br />
26<br />
The study of air quality assessment was conducted by the<br />
Institute for Environment and Development, an organization<br />
widely recognized for its technical and scientifi c excellence in<br />
environmental matters and was monitored by several offi cials,<br />
including the CCDR-N that led, the Directorate General for<br />
Energy and Geology, the Portuguese Environment Agency, the<br />
General Inspectorate of Environment and Territory Planning and<br />
the City of <strong>Matosinhos</strong>.<br />
The legal framework for air quality is established by Decree-Law<br />
No. 102/2010 of September 23 rd , which sets out goals for<br />
ambient air quality taking into account the standards, guidelines<br />
and programs of the World Health Organization, designed to<br />
avoid, prevent or reduce emissions of air pollutants. It establishes,<br />
in particular for benzene, the limit values and thresholds, as this<br />
is the only hydrocarbon covered by national law.<br />
Threshold and limit values for benzene in Decree Law<br />
No. 102/2010<br />
Parameter Value (μg.m-3 )<br />
Annual limit value for protection of human health 5<br />
Lower threshold assessment (LIA) 2<br />
Upper threshold assessment (LSA) 3.5<br />
For the purposes of direct comparison with the annual limit<br />
value for human health protection, Annex II of Decree. No.<br />
102/2010 defi nes minimum time coverage for indicative<br />
measurements of benzene a value of 14%, corresponding to<br />
eight weeks distributed throughout the year. In order to comply<br />
with the minimum sampling, it was decided to hold a series of<br />
13 campaigns, 5 of which in 2010 and 8 in <strong>2011</strong>.<br />
We established a sampling grid covering a total of 59<br />
measurement points, covering an approximate area of 35 km 2<br />
in the nearby surroundings of the refi nery.<br />
The location of sampling points can be viewed in the following map.<br />
Sampling points location<br />
MATOSINHOS REFINERY / DATA BOOK ON HEALTH, SAFETY AND ENVIRONMENT <strong>2011</strong><br />
The sampling methodology adopted, resulting from the use<br />
of passive diffusers, allows to know the spatial distribution<br />
of pollutants monitored, enabling the identifi cation of any<br />
contaminated areas, or the recognition of unknown emission<br />
sources.<br />
The air quality monitoring campaign using the technique of<br />
passive gaseous compounds was performed using Radiello ®<br />
diffusion tubes.<br />
They were placed on power or lamp posts at a height of about<br />
2.5 m, avoiding wherever possible locations near intersections,<br />
bus stops and other “hot spots”.<br />
Sampling of benzene, toluene and xylenes was performed by<br />
using passive diffusivity samplers of activated carbon, allowing<br />
adsorption of the compounds at a constant speed during<br />
the period of exposure to ambient air, which corresponded<br />
to a volume of air samples. Following their collection the<br />
samples were sealed and sent to laboratory for analysis by gas<br />
chromatography.<br />
In turn, NO 2 and SO 2 sampling was performed by using passive<br />
diffusivity samplers of triethanolamine which are laboratory<br />
analyzed by ionic chromatography technique in the form of<br />
nitrite ion and sulfate ion, respectively.<br />
In terms of data processing, and as a means of determining the<br />
annual concentration average over a calendar year, as required<br />
by law, the average of the <strong>2011</strong> eight campaigns was made,<br />
of the results of each point, which were compared with the<br />
legal limit of 5 μg/m 3 .<br />
The statistical treatment of results reveals the following:<br />
Average: 3.0 μg/m 3<br />
Median: 2.0 μg/m 3<br />
Histogram of concentrations<br />
> 5 μg /m 3<br />
4 - 5 μg /m 3<br />
3 - 4 μg /m 3 7<br />
1<br />
2<br />
2 - 3 μg /m 3 22<br />
1 - 2 μg /m 3<br />
< 1 μg /m 3<br />
1<br />
The results were collated in the form of bar chart, which is<br />
presented in the above fi gure, and show that the vast majority<br />
of the results fall between 1 and 3 μgrams with only three<br />
points above 10 micrograms. Just one point, located at Rua<br />
Coronel Helder Ribeiro near the WWTP, shows over 5 μg/m3.<br />
All points installed in sensitive inhabited areas located north,<br />
south and east of the refi nery have average concentrations<br />
below 5 μgrams/m 3 .<br />
26
01<br />
02<br />
<strong>Matosinhos</strong> refi nery laboratory<br />
03<br />
04<br />
The assessment study of ambient air quality in the <strong>Matosinhos</strong><br />
refi nery surroundings, now presented, shows that there<br />
are no concerns with the concentrations of benzene in the<br />
monitored metropolitan area where the refi nery is located. It<br />
also corroborates the measurements that the public station for<br />
monitoring air quality, located in Perafi ta (see www.qualar.org),<br />
about 1.5 km north of the refi nery, has been presenting.<br />
Nevertheless, the refi nery, aware of its commitments to<br />
protect the environment and the relentless pursuit to improve<br />
its performance, will continue to monitor the air within the<br />
limits of the facility, either with passive samplers, or with<br />
its own stations for continuous monitoring that have been<br />
acquired in the meantime.<br />
IN FOCUS 06 07 08 09 10 11<br />
MATOSINHOS REFINERY / DATA BOOK ON HEALTH, SAFETY AND ENVIRONMENT <strong>2011</strong><br />
27<br />
05
06 01 02 03 04 05<br />
INDICADORES ACTIVITY INDICATORS DE ATIVIDADE<br />
06<br />
07 08 09 10 11<br />
28<br />
06 . ACTIVITY INDICATORS<br />
6.1<br />
6.2<br />
6.3<br />
LEVEL OF ACTIVITY<br />
PRODUCTION<br />
BOA NOVA DEPOT<br />
MATOSINHOS REFINERY / DATA BOOK ON HEALTH, SAFETY AND ENVIRONMENT <strong>2011</strong>
01<br />
02<br />
03<br />
6.1 Level of activity<br />
The following graph shows the load processed and the crude<br />
oil processed in the refi nery. The load processed includes not<br />
only crude oil, but also the raw materials and components<br />
processed, weighted by a conversion factor that considers the<br />
amount of crude oil equivalent to the processing level for the<br />
respective load.<br />
04<br />
During <strong>2011</strong> there was an increase in activity compared to<br />
the year 2010, when a technical shutdown for maintenance<br />
took place as wells as strategic shutdowns of process units,<br />
infl uenced by fl uctuations between supply and demand, arising<br />
from the global economic environment.<br />
6.2 Production<br />
The following graph shows <strong>Matosinhos</strong> refi nery’s production<br />
over the last few years. Sulphur and paraffi n are excluded<br />
Production volume (10 3 ton)<br />
It should be noted an increase in production in <strong>2011</strong> compared<br />
to 2010, year of the technical shutdown for maintenance.<br />
6.3 Boa Nova depot<br />
05<br />
ACTIVITY INDICATORS 07 08 09 10 11<br />
Level of activity (10 6 ton)<br />
2007<br />
2008<br />
2009<br />
2010<br />
<strong>2011</strong><br />
Load processed Crude oil processed<br />
3.82<br />
3.36<br />
4.18<br />
4.86<br />
3.30<br />
4.08<br />
3.03<br />
3.80<br />
3.84<br />
3.52<br />
as these are considerably less signifi cant than the remaining<br />
products.<br />
2007<br />
123 686 1,472 124 425 145 830 98<br />
2008<br />
193 736 1,780 155 380 151 829 127<br />
2009<br />
183 577 1,504 137 325 133 869 105<br />
2010<br />
164 615 1,182 126 276 164 638 99<br />
<strong>2011</strong><br />
159 1,077 1,278 137 360 158 663 76<br />
Bitumens Fuels Diesel Base oils Aromatics Oils Jet/Ker Gasolines Gases<br />
The Boa Nova shipping area has a set of 46 tanks, which store<br />
and dispatch the products to the whole country, supplying<br />
about one third of the national market needs, and also from<br />
where it exports to europe part of the petroleum products<br />
produced in the <strong>Matosinhos</strong> refi nery complex.<br />
This activity covers the receiving, subdivision and shipment by<br />
road tankers of several product families, such as:<br />
• aromatic and solvents, for national and international chemical<br />
and petrochemical industries;<br />
• petrol and Diesel, to supply fuel for the entire north area of<br />
the country. In these facilities, they are coloured and additives<br />
are added according to performance requirements and legal<br />
marking;<br />
• fuels, for the energy supply of part of the portuguese industry;<br />
• paraffi ns, which are used in several industries , e.g. candles,<br />
cosmetics, moulds, food, etc.;<br />
• bitumen of various grades, as a component for industrial<br />
adhesives, binders and insulation wire but essentially for road<br />
paving;<br />
• JET A1 (in cases of contingency, it is possible to supply<br />
aviation fuel to domestic airports from this facility).<br />
MATOSINHOS REFINERY / DATA BOOK ON HEALTH, SAFETY AND ENVIRONMENT <strong>2011</strong><br />
29<br />
06
06 01 02 03 04 05<br />
ACTIVITY INDICATORS 07 08 09 10 11<br />
30<br />
The following graph shows the quantity of products delivered<br />
by road tanker:<br />
Quantity of products delivered by road tanker (10 3 ton)<br />
The following graph shows the number of deliveries by road<br />
tanker for each type of product:<br />
MATOSINHOS REFINERY / DATA BOOK ON HEALTH, SAFETY AND ENVIRONMENT <strong>2011</strong><br />
Note: in the years before <strong>2011</strong> the item chemicals also includes<br />
paraffi ns. In <strong>2011</strong> the contribution of paraffi ns is already segregated.<br />
2007<br />
1,405 492 160 126<br />
2008<br />
1,255 404 156 179<br />
2009<br />
1,303 375 90 169<br />
2010<br />
1,274 334 121 162<br />
<strong>2011</strong><br />
1,100 280 83 162 15<br />
Whites Blacks Chemicals Bitumens Parafins<br />
Deliveries by road tanker<br />
2007<br />
60,020 23,593 7,297 4,866<br />
2008<br />
53,479 19,815 6,239 7,894<br />
2009<br />
55,417 18,807 4,124 7,027<br />
2010<br />
53,173 17,794 5,138 6,997<br />
<strong>2011</strong><br />
46,497 12,689 3,744 6,928 726<br />
Whites Blacks Chemicals Bitumens Parafins
01<br />
02<br />
03<br />
04<br />
05<br />
07 . ENVIRONMENTAL<br />
PERFORMANCE<br />
7.1<br />
7.2<br />
7.3<br />
7.4<br />
06<br />
RESOURCE CONSUMPTION<br />
ATMOSPHERIC EMISSIONS<br />
WASTEWATER<br />
WASTE<br />
ENVIRONMENTAL DESEMPENHO EM PERFORMANCE AMBIENTE<br />
07<br />
08 09 10 11<br />
MATOSINHOS REFINERY / DATA BOOK ON HEALTH, SAFETY AND ENVIRONMENT <strong>2011</strong><br />
31<br />
07
07 01 02 03 04 05 06 ENVIRONMENTAL PERFORMANCE 08 09 10 11<br />
32<br />
Under the Decree-Law No. 194/2000 - Integrated Pollution<br />
Prevention and Control (IPPC Directive) - <strong>Matosinhos</strong> refi nery<br />
holds an Environmental Permit (No. 190/2008) which<br />
systematizes and meets all legal environmental requirements.<br />
In addition to this license <strong>Matosinhos</strong> refi nery holds a<br />
greenhouse gas emission permit, TEGEE n. 197.05.II in the<br />
amount of 1,098,095 CO 2 emission permits in <strong>2011</strong>.<br />
On November <strong>2011</strong> Environmental Permit no. 190/2008 has<br />
been replaced by Environmental Permit no. 190/0.2/<strong>2011</strong>.<br />
All data concerning <strong>2011</strong> are thus presented according to<br />
limits set in Environmental Permit no. 190/2008 as well as<br />
the limits and/or considerations of Environmental Permit no.<br />
190/0.2/<strong>2011</strong> whenever pertinent.<br />
7.1 Resource consumption<br />
Given the signifi cance of its use as well as its environmental<br />
signifi cance, this chapter presents information and indicators<br />
relating to water consumption and energy.<br />
Resource consumption<br />
The water that <strong>Matosinhos</strong> refi nery uses for industrial purposes<br />
comes from Água do Noroeste and INDAQUA (used for human<br />
consumption and exceptionally in industrial activities) and may<br />
also come from surface water catchment of the River Ave (ETA<br />
Vilarinho), to be used in the industrial activity, including cooling<br />
and steam generation processes. The fi rst two sources are<br />
considered to be potable water.<br />
The following graph shows the water total consumption, as well<br />
as the amount of recycled water from the Industrial Wastewater<br />
Treatment Station (WWTP) and then reused.<br />
Water consumption and recycled (10 3 m 3 )<br />
2007<br />
2008<br />
2009<br />
2010<br />
<strong>2011</strong><br />
469<br />
458<br />
478<br />
896<br />
891<br />
Water consumption Recycled water<br />
2,508<br />
2,447<br />
2,689<br />
2,890<br />
2,893<br />
The year <strong>2011</strong> followed the trend of recent years in terms<br />
of gradual reduction of fresh water consumption, noting a<br />
decrease of 2% over the year 2010. Simultaneously, there<br />
was the reuse of 891,206 m 3 of treated water, in line with the<br />
previous year, taking advantage of the storage infrastructure<br />
created in 2009. Actually in 2009 an investment to build a new<br />
fi re water tank was made - TK4504. This new water tank allows<br />
the storage of more recycled water from the WWTP.<br />
MATOSINHOS REFINERY / DATA BOOK ON HEALTH, SAFETY AND ENVIRONMENT <strong>2011</strong><br />
This chapter presents information and indicators concerning<br />
<strong>Matosinhos</strong> refi nery’s environmental performance, including<br />
compliance with IPPC Directive and further best practices.<br />
These indicators are presented both in absolute and normalized<br />
terms, ie, disregarding scale effects arising from different<br />
levels of activity intensity. Indeed, the level of activity in the<br />
installation inevitably infers absolute assessment indicators,<br />
sometimes without the absolute evolution providing a good<br />
picture of the progress and performance of the facility.<br />
Moreover, standardized indicators ensure also a comparison of<br />
the refi nery’s performance with its european peers within the<br />
same reference sector.<br />
The reuse of treated water from the WWTP enables to decrease<br />
markedly the use of make-up fresh water and reduce the volume<br />
of treated water sent to the receiving environment, the sea.<br />
The chart below shows the evolution of water consumption by<br />
level of activity.<br />
Water consumption by level of activity (m 3/ton)<br />
2007<br />
2008<br />
0.60<br />
2009 0.66<br />
2010 0.66<br />
<strong>2011</strong> 0.64<br />
In <strong>2011</strong>, despite the refi nery having operated at a higher level<br />
of activity than in 2010 and given the increase of complexity<br />
of processing raw materials, there was a decrease in water<br />
consumption, a fact that refl ects a better effi ciency in the<br />
management of water resources and which resulted in a<br />
decrease of 2% in the indicator of water consumption by level<br />
of activity in the previous year.<br />
Energy consumption<br />
Indicators of energy consumption consider fuel and electricity<br />
consumption.<br />
Fuels consumed in the refi nery are the Residual fuel oil<br />
(known as RFO) and gas, a mixture of fuel gas enriched with<br />
natural gas. This allows an increased amount of gas available<br />
for consumption, making it possible to reduce consumption<br />
of a less clean fuel, as the RFO. <strong>Matosinhos</strong> refi nery has<br />
progressively privileged consumption of clean fuels.<br />
0.76
01<br />
02<br />
03<br />
The following graphs show the consumption of these fuels at<br />
the refi nery.<br />
RFO consumpution (10 3 ton)<br />
2007<br />
2008<br />
Pollutant atmospheric emissions relevant in terms of<br />
environmental air quality are described in this chapter.<br />
04<br />
Sulphur oxides<br />
The graph below shows the absolute emissions of sulfur oxides,<br />
represented on the basis of equivalent sulfur dioxide, SO 2 .<br />
05<br />
2009 158<br />
2010 115<br />
<strong>2011</strong> 102<br />
Gas consumption (10 3 ton)<br />
2007<br />
2008<br />
7.2 Atmospheric emissions<br />
SO 2 emissions (10 3 t)<br />
2007<br />
2008<br />
99<br />
2009 4.05<br />
2010 3.51<br />
<strong>2011</strong> 3.39<br />
141<br />
11%<br />
decrease<br />
2009 134<br />
2010 143<br />
31%<br />
increase<br />
<strong>2011</strong> 188<br />
5.96<br />
3%<br />
decrease<br />
06<br />
211<br />
218<br />
9.89<br />
ENVIRONMENTAL PERFORMANCE 08 09 10 11<br />
Since the entry of natural gas into the refi nery’s fuel pool,<br />
in 2008, it has been observed a signifi cant decrease in the<br />
consumption of RFO, as it may be verifi ed in the charts.<br />
In <strong>2011</strong>, RFO consumption has decreased about 11% compared<br />
to consumption during the year 2010. This decrease is due in<br />
part to natural gas increased consumption in <strong>2011</strong> which was<br />
79,064 tons, compared to 45,338 tons consumed in 2010.<br />
As far as electricity is concerned, the refi nery sells or acquires<br />
electricity from the city network depending on whether there<br />
is surplus or shortage. The following graph shows the electricity<br />
produced and consumed.<br />
Electricity (10 3 toe)<br />
1 MWh = 0,29 toe<br />
2007<br />
2008<br />
2009<br />
2010<br />
<strong>2011</strong><br />
The graph below shows absolute emissions based on the level<br />
of activity:<br />
SO 2 emission by level of activity (kg/ton)<br />
2007<br />
2008<br />
2009<br />
2010<br />
<strong>2011</strong><br />
Electricity consumed Electricity produced<br />
0.99<br />
0.92<br />
0.88<br />
1.23<br />
2.59<br />
Sulfur is a natural component of crude oil. During the refi ning<br />
process it is possible to recover a great part of this element, but<br />
a residual portion is retained in refi ned products. When these<br />
are used as fuel, sulphur is released into the atmosphere.<br />
MATOSINHOS REFINERY / DATA BOOK ON HEALTH, SAFETY AND ENVIRONMENT <strong>2011</strong><br />
42<br />
41<br />
45<br />
46<br />
52<br />
54<br />
56<br />
59<br />
66<br />
65<br />
33<br />
07
07 01 02 03 04 05 06 ENVIRONMENTAL PERFORMANCE 08 09 10 11<br />
34<br />
In order to reduce SO 2 emissions, the refi nery has been making<br />
an effort whose notorious impact can be evidenced in the two<br />
previous graphs. On one hand, natural gas was added to the<br />
portfolio of fuels used and increased the consumption of fuel<br />
gas, undoubtedly contributing to the reduction in emissions. On<br />
the other hand, it is also clear the use of RFO with a sulphur<br />
content quite inferior to the limit stipulated in our permit (3%),<br />
with a favourable impact in our <strong>2011</strong> SO 2 emissions.<br />
Percentage of sulphur in the RFO (%)<br />
2007<br />
2008<br />
2009 1.29%<br />
2010 1.48%<br />
<strong>2011</strong> 1.53%<br />
Permit limit<br />
Finally, it can be seen below the evolution of the SO 2 “bubble”.<br />
This indicator shows the concentration of sulfur oxides in a<br />
virtual chimney, weighting the smoke fl ow and the pollutant<br />
concentration in several sources.<br />
<strong>Matosinhos</strong> refi nery has made a great effort in the continuous<br />
improvement of its performance in this area, as illustrated in<br />
the chart. Also, through this indicator, it’s visible the result from<br />
the use of cleaner fuels, including the privilege given to the<br />
consumption of gas and RFO with low sulphur content<br />
SO 2 bubble (mg/Nm 3 )<br />
2007<br />
2008<br />
2009<br />
2010<br />
<strong>2011</strong><br />
Bubble objective<br />
519<br />
650<br />
610<br />
1.23%<br />
885<br />
15%<br />
decrease<br />
2.28%<br />
1,453<br />
MATOSINHOS REFINERY / DATA BOOK ON HEALTH, SAFETY AND ENVIRONMENT <strong>2011</strong><br />
3%<br />
1,700<br />
Nitrogen oxides<br />
The chart below shows absolute nitrogen oxides emissions (NO x ):<br />
NOX emissions (ton)<br />
2007<br />
2008<br />
2009 1,823<br />
2010 1,365<br />
<strong>2011</strong> 1,377<br />
2,323<br />
The following graph shows NO x emissions per level of activity:<br />
NO X emissions by level of activity (kg/ton)<br />
2007<br />
2008<br />
2009<br />
2010<br />
<strong>2011</strong><br />
As far as NO x emissions are concerned, it is noticeable<br />
the success of <strong>Matosinhos</strong> refi nery towards a continuous<br />
improvement of its environmental performance, due to the<br />
increased consumption of gas against RFO and by installing low<br />
NO X burners in the main fi ring facilities.<br />
Total particulate matter<br />
The following graph shows the values of total particulate<br />
matter emissions for the period under consideration:<br />
Particulate matter emissions (ton)<br />
2007<br />
2008<br />
2009 215<br />
2010 76<br />
<strong>2011</strong> 102<br />
0.36<br />
0.36<br />
0.45<br />
426<br />
0.54<br />
2,639<br />
0.61<br />
544
01<br />
02<br />
03<br />
The following graph allows the evaluation of the specifi c<br />
emissions of particulate matter at <strong>Matosinhos</strong> refi nery:<br />
04<br />
Particulate matter emissions by level of activity (kg/ton)<br />
2007<br />
2008<br />
2009<br />
2010<br />
<strong>2011</strong><br />
Regarding particulate emissions, in <strong>2011</strong> there is a 30%<br />
increase in particulate emissions, compared to the previous<br />
year. This increase is justifi ed by the increased level of activity<br />
observed in the refi nery during the year <strong>2011</strong> compared to<br />
2010, when there was a technical shutdown of the refi nery in<br />
October and November.<br />
Despite this increase, emissions remain at lower levels when<br />
compared to those observed prior to the introduction of<br />
technical measures to reduce this pollutant. As can be seen,<br />
the quality of fuels burned, like gas, and the installation of<br />
an electrostatic precipitator were decisive factors in reducing<br />
emissions from the end of 2008.<br />
Carbon dioxide<br />
The following graphs show CO 2 emissions deriving from<br />
<strong>Matosinhos</strong> refi nery’s activity and evidences the suffi ciency of<br />
emission allowances allocated in 2010:<br />
CO 2 emissions (10 3 ton)<br />
2005<br />
2006<br />
2007<br />
2008<br />
2009<br />
2010<br />
<strong>2011</strong><br />
0.02<br />
0.03<br />
Emissions allowances (kt)<br />
0.05<br />
<strong>2011</strong> was the fourth year of the second compliance period of<br />
the Portuguese National Emission Allocation Plan, PNALE II –<br />
2008-2012. The change in the number of emission allowances<br />
recorded from 2007 to 2008 does not refl ect the generalized<br />
reduction in all of the sectors covered by this regime because<br />
since 2008 the collective ceiling includes the Aromatics Plant.<br />
Although there is an increased consumption of gas, instead of<br />
RFO, with higher carbon content, CO 2 emissions increased in<br />
05<br />
0.09<br />
781<br />
843<br />
952<br />
843<br />
888<br />
941<br />
06<br />
1,098<br />
0.14<br />
1,156<br />
1,122<br />
ENVIRONMENTAL PERFORMANCE 08 09 10 11<br />
<strong>2011</strong> compared to 2010 due to the increased level of activity<br />
recorded during <strong>2011</strong> and a larger number of operating hours<br />
of the plant.<br />
Volatile organic compound<br />
<strong>Matosinhos</strong> refi nery’s volatile organic compound (VOC´s)<br />
emissions come from various sources: product storage, process<br />
(including the drainage network) and effl uent treatment.<br />
<strong>Matosinhos</strong> refi nery carries out VOC´s monitoring campaigns,<br />
under its Leak Detection Repair programme, whose<br />
measurements allow the minimisation of fugitive emissions.<br />
In these campaigns, the total emission of VOC´s resulting from<br />
the refi nery operation is calculated, taking into consideration<br />
fugitive emissions that result from leakages in manual and<br />
automated valves, pumps, exchangers, fl anges, sampling<br />
points, vent, purges and other end-of-line equipments.<br />
The VOC’s emissions also include the drainage network and<br />
equipments placed in the storage area (such as fugitive<br />
emissions) and the fugitive emissions of the different<br />
treatment equipments of the WWTP.<br />
The European Standard EN15446:2008 is being used to<br />
calculate the escaping emissions, associated with the different<br />
process equipments and the drain pipe system - “Fugitive<br />
and diffuse emissions of common concern to industry sectors.<br />
Measurement of fugitive emission of vapours generating from<br />
equipment and piping leaks”.<br />
To quantify diffuse emissions from the WWTP the EPA<br />
programme Water9 is being used and diffuse emissions from<br />
storage the software TANKS 4.09D is being applied.<br />
These procedures implemented under the Leak Detection<br />
Repair programme, follow the techniques defi ned in the<br />
reference document under the IPPC: reference document on<br />
best available techniques for mineral oil and gas refi neries<br />
(BREF 4.23.6.1.)<br />
Continuous monitoring<br />
<strong>Matosinhos</strong> refi nery carries out continuous monitoring of<br />
SO 2 , NO x and particulate matter at several fi xed sources.<br />
Nevertheless, under the environmental permit it is only<br />
mandatory to continuously monitor the process furnaces fed<br />
with RFO and gas – mixed sources.<br />
The following graphs show the results for the SO 2 , NO X and<br />
particulate matter, over the analysis period, for the self control<br />
of the three mentioned fi xed sources.<br />
MATOSINHOS REFINERY / DATA BOOK ON HEALTH, SAFETY AND ENVIRONMENT <strong>2011</strong><br />
35<br />
07
07 01 02 03 04 05 06 ENVIRONMENTAL PERFORMANCE 08 09 10 11<br />
36<br />
Continuous monitoring - Particulate matter (mg/Nm 3 @ 8% O 2 )<br />
250<br />
200<br />
150<br />
100<br />
50<br />
0<br />
jan. feb. mar. apr. mai. jun. jul. aug. sep. oct.<br />
ST0601 ST2001<br />
ST3001<br />
Continuous monitoring - NO x mg/Nm 3 @ 8% O 2 )<br />
450<br />
400<br />
350<br />
300<br />
250<br />
200<br />
150<br />
100<br />
50<br />
0<br />
1.800<br />
1.600<br />
1.400<br />
1.200<br />
1.000<br />
800<br />
600<br />
400<br />
200<br />
0<br />
ST0601 ST2001<br />
ST3001<br />
MATOSINHOS REFINERY / DATA BOOK ON HEALTH, SAFETY AND ENVIRONMENT <strong>2011</strong><br />
250<br />
95<br />
nov. dec.<br />
ELV New ELV<br />
ELV New ELV<br />
450<br />
390<br />
jan. feb. mar. apr. mai. jun. jul. aug. sep. oct. nov. dec.<br />
Continuous monitoring - SO 2 mg/Nm 3 @ 8% O 2 )<br />
ST0601 ST2001<br />
ST3001<br />
ELV<br />
1.700<br />
jan. feb. mar. apr. mai. jun. jul. aug. sep. oct. nov. dec.<br />
7.3 Wastewater<br />
Wastewater production<br />
As mentioned in previous editions of the <strong>Data</strong> <strong>Book</strong>, the<br />
wastewater production is inherent to operations, but is strongly<br />
infl uenced by the meteorological conditions, as rainwater in the<br />
processing and storage zones is collected and conducted to the<br />
refi nery’s WWTP.<br />
The commitment of the refi nery to reduce the impact of its<br />
operations, developing continuous efforts to ensure sustainable<br />
integration in its surroundings and operating its assets at levels<br />
comfortably below the Emission Limit Values (ELVs) set, is clear<br />
from analyzing the above graphs. The values of the ST0601<br />
source referred to August are due to the Aromatics Plant<br />
shutdown that happened in that period for economic reasons.<br />
It should be pointed out that since 2008, Large Combustion<br />
Plants (LCP’s) have been subject to a mass ceiling, as defi ned<br />
in the National Emission Reduction Plan (PNRE). The changes<br />
in recent years in pollutants mass emissions are visible in the<br />
following graph:<br />
LCP emissions SO 2 (ton)<br />
2008 2,794<br />
2009 2,139<br />
2010 1,836<br />
<strong>2011</strong> 1,894<br />
LCP emissions NO X (ton)<br />
Plafond SO 2 =<br />
3,385 ton/year<br />
2008 1,124<br />
2009 880<br />
2010 748<br />
Plafond NO = x<br />
896 ton/year<br />
<strong>2011</strong> 837<br />
LCP emissions Particules (ton)<br />
2008 219<br />
2009 84<br />
2010 31<br />
<strong>2011</strong> 43<br />
Plafond Particules=<br />
100 ton/year<br />
The following graph relates wastewater production with average<br />
rainfall for the region of the <strong>Matosinhos</strong> refi nery in <strong>2011</strong> (data<br />
from the Portuguese Institute of Meteorology). As in previous<br />
years, also in <strong>2011</strong> it is remarkable the infl uence of rainfall with<br />
the amount of wastewater produced in <strong>Matosinhos</strong> refi nery.
01<br />
02<br />
03<br />
Evolution over recent years in the production of wastewater is<br />
shown by the following graph:<br />
04<br />
The following graph normalises wastewater production by level<br />
of activity:<br />
05<br />
Relationship between effluents produced and average percipitation in the area of the refinery<br />
Liquid effluents (m 3 )<br />
180,000<br />
160,000<br />
140,000<br />
120,000<br />
100,000<br />
80,000<br />
60,000<br />
40,000<br />
20,000<br />
0<br />
126,672<br />
80,560<br />
119,845<br />
06<br />
ENVIRONMENTAL PERFORMANCE 08 09 10 11<br />
jan. feb. mar. apr. may. jun. jul. aug. sep. oct. nov. dec.<br />
Effluent produced Average rainfall<br />
Liquid effluents produced (10 6 m 3 )<br />
2007<br />
2008<br />
2009<br />
2010<br />
<strong>2011</strong><br />
1.16<br />
1.42<br />
79,181 80,001<br />
1.73<br />
18%<br />
decrease<br />
2.30<br />
Liquid effluents produced by level of activity (m 3 ton)<br />
2007<br />
2008<br />
2009<br />
2010<br />
<strong>2011</strong><br />
0.30<br />
0.37<br />
0.42<br />
Waste hydrocarbons in the wastewater<br />
2007<br />
2008<br />
0.82<br />
2009<br />
0.81<br />
2010<br />
0.84<br />
<strong>2011</strong><br />
0.64<br />
Waste hydrocarbons (mg/l)<br />
2.46<br />
1.74<br />
2.10<br />
2.43<br />
2.27<br />
0.47<br />
19%<br />
decrease<br />
2.45<br />
38,855<br />
0.64<br />
3.84<br />
66,300<br />
101,864<br />
76,251<br />
122,607<br />
149,847<br />
117,689<br />
Monitoring wastewater quality<br />
<strong>Matosinhos</strong> Environmental Permit also defi nes the limit values<br />
for treated wastewater discharges in the WWTP. The graphs<br />
below show the concentration of pollutants discharged into<br />
the aquatic environment, stating the compliance with the<br />
requirements set out in the Environmental Permit.<br />
Firstly, the graph of the pH of discharged wastewater.<br />
Wastewater pH<br />
2007<br />
2008<br />
2009<br />
2010<br />
<strong>2011</strong><br />
Range permited by the permit<br />
The following graph shows the performance of the refi nery in<br />
relation to hydrocarbons:<br />
Concentration limit defined by the permit (mg/l) Waste hydrocarbons by level of activity (g/ton)<br />
MATOSINHOS REFINERY / DATA BOOK ON HEALTH, SAFETY AND ENVIRONMENT <strong>2011</strong><br />
300<br />
250<br />
200<br />
150<br />
100<br />
50<br />
0<br />
10<br />
Average rainfall (mm)<br />
7.37<br />
7.33<br />
7.32<br />
7.50<br />
7.40<br />
6 9<br />
37<br />
07
07 01 02 03 04 05 06 ENVIRONMENTAL PERFORMANCE 08 09 10 11<br />
38<br />
The graph below shows the concentration of the wastewater<br />
discharged in terms of Oils and Grease (O&G), Total<br />
Suspended Solids (TSS) and Biochemical Oxygen Demand<br />
Concentration of O&G, SST e CBO (mg/l)<br />
5<br />
3.1<br />
2008<br />
11.5<br />
2009<br />
3.0<br />
6.4<br />
10.6<br />
2010<br />
3.9<br />
9.5<br />
11.1<br />
<strong>2011</strong><br />
4.1<br />
O&G TSS BOD 5<br />
The refi nery has also stayed within the limits defi ned in the<br />
Permit for phenols and cyanides:<br />
Concentration of phenol and cyranides in the wastewater (mg/l)<br />
2007<br />
0.037<br />
0.04<br />
2008<br />
0.035<br />
0.030<br />
2009 0.010<br />
0.051<br />
2010 0.010<br />
0.048<br />
<strong>2011</strong> 0.010<br />
0.039<br />
0.5<br />
Phenols Cyanides<br />
7.4 Waste<br />
Limit defined by the permit<br />
14.5<br />
ELV BOD 5 =15mg/l<br />
10.9<br />
14.8<br />
<strong>Matosinhos</strong> refi nery, aware of its responsibility for managing<br />
the impact of its activities on the environment, with the<br />
intention of implementing the 3 R’s policy - Reduce, Reuse and<br />
Recycling - seeks to minimize waste production mainly from<br />
the appropriate waste and materials segregation.<br />
This chapter describes the evolution of waste generation over<br />
time by type.<br />
MATOSINHOS REFINERY / DATA BOOK ON HEALTH, SAFETY AND ENVIRONMENT <strong>2011</strong><br />
at 5 days (BOD 5 ), indicators associated to the presence of<br />
organic matter in the wastewater.<br />
ELV BOD 5 =25mg/l<br />
ELV BOD 5 =50mg/l<br />
Finally, the concentration of Total Iron in the wastewater is<br />
revealed in the following graph:<br />
Concentration of total iron in the wastewater (mg/l)<br />
2007<br />
0.78<br />
2008<br />
0.66<br />
2009 0.31<br />
2010 0.45<br />
<strong>2011</strong> 0.63<br />
These performance indicators denote an improvement of<br />
the WWTP, arising from the consolidated measures at the<br />
operational level to minimize the impact of some pollutants in<br />
the WWTP treatment processes.<br />
2
01<br />
02<br />
03<br />
The following graph shows the progress over time of the<br />
industrial waste produced:<br />
The chart below shows waste production based upon activity<br />
level:<br />
04<br />
Industrial waste produced (103 ton)<br />
2007<br />
9.249<br />
12.698<br />
2008 1.758<br />
6.408<br />
2009 0.187<br />
7.377<br />
2010 0.147<br />
6.750<br />
<strong>2011</strong> 0.167<br />
4.423<br />
Hazardous industrial waste Non-hazardous industrial waste<br />
Industrial waste produced by level of activity (kg/ton)<br />
2007<br />
2008<br />
2009<br />
2010<br />
<strong>2011</strong><br />
0.05<br />
0.04<br />
0.04<br />
0.36<br />
1.15<br />
1.32<br />
Hazardous industrial waste<br />
Non-hazardous industrial waste<br />
1.81<br />
1.78<br />
The waste handled by the municipal waste system is presented<br />
in the following graph:<br />
The following chart illustrates the evolution of material<br />
recovery in the refi nery. This indicator should be understood in<br />
its relation to the amount of waste produced.<br />
05<br />
2.42<br />
06<br />
3.33<br />
Waste produced considered as solid waste (ton)<br />
2007<br />
171<br />
2008<br />
179<br />
2009 173<br />
2010 171<br />
<strong>2011</strong> 165<br />
ENVIRONMENTAL PERFORMANCE 08 09 10 11<br />
Recovered materials<br />
2007<br />
1,196<br />
0.091<br />
2008<br />
1,134<br />
0.139<br />
2009<br />
381<br />
0.050<br />
2010 2,159<br />
0.313<br />
<strong>2011</strong> 1,682<br />
0.366<br />
Quantity of recovered material (ton)<br />
Recovered material by quantity of industrial waste produced (ton/ton)<br />
As can be observed from the analysis of the previous charts, in<br />
recent years it is notorious the refi nery’s effort to reduce the<br />
production of waste which is not likely to be recycled given the<br />
amount of recyclable waste.<br />
As far as the amount of industrial waste that can be recovered<br />
is concerned, the refi nery’s performance depends on the<br />
completion of work carried out by third parties, and the<br />
activities undertaken. Actually the vast material recovery in the<br />
year 2010, as in 2007, was due to a technical shutdown for<br />
maintenance, having been produced large quantities of metallic<br />
scrap arising from the replacement of equipment.<br />
MATOSINHOS REFINERY / DATA BOOK ON HEALTH, SAFETY AND ENVIRONMENT <strong>2011</strong><br />
39<br />
07
08 01<br />
02<br />
03<br />
04<br />
05 06 07 HEALTH INDICADORES AND SAFETY DE PERFORMANCE ATIVIDADE<br />
08<br />
09 10 11<br />
40<br />
08 . HEALTH AND SAFETY<br />
PERFORMANCE<br />
8.1<br />
8.2<br />
8.3<br />
8.4<br />
ACCIDENT RATE<br />
OCCUPATIONAL MEDICINE<br />
SAFETY MANAGEMENT SYSTEM FOR SERIOUS ACCIDENT PREVENT<br />
PREVENTIVE SAFETY AND ENVIRONMENTAL OBSERVATIONS<br />
MATOSINHOS REFINERY / DATA BOOK ON HEALTH, SAFETY AND ENVIRONMENT <strong>2011</strong>
01<br />
02<br />
03<br />
Work accidents are a cause for concern, so it’s a prime task of<br />
<strong>Matosinhos</strong> refi nery Management to ensure the existence of<br />
the conditions, procedures and practices designed to prevent<br />
occurrences and implement all preventive and corrective<br />
measures to prevent recurrences.<br />
04<br />
Within the implementation of the Health, Safety and<br />
Environment Systems of <strong>Galp</strong> <strong>Energia</strong> Group - the G+ System,<br />
all accidents occurring to own or to third party workers during<br />
the execution of services assigned to them, are investigated in<br />
order to identify corrective and appropriate preventative actions<br />
to prevent them.<br />
In <strong>2011</strong>, there were 27 accidents in the refi nery, involving<br />
direct workers, as illustrated in the following graph.<br />
Of the 27 accidents, 25 were cases of fi rst aid and 2 were<br />
cases of medical treatment, with no accident with lost workday<br />
injuries.<br />
It should be noted that, although in the year <strong>2011</strong> the number<br />
of occurrences is higher compared to the year 2010, the fact<br />
that we have registered a value of 93% of fi rst aid accidents<br />
shows a very signifi cant declining trend in relation to the<br />
severity of injuries.<br />
05<br />
8.1 Accident rate<br />
Total personal accidents of <strong>Matosinhos</strong> refinery employees (No.)<br />
2007<br />
2008<br />
5<br />
2009 14<br />
2010 20<br />
<strong>2011</strong> 27<br />
Personal accidents - own staff (No.)<br />
2007<br />
2008<br />
2009<br />
2010<br />
<strong>2011</strong><br />
4 1<br />
18 3 6<br />
10 3 1<br />
15 5<br />
First aid Medical treatment cases Lost workday injuries<br />
06<br />
25 2<br />
27<br />
07<br />
HEALTH AND SAFETY PERFORMANCE 09 10 11<br />
This fact is also verifi ed by the absence of lost workday injuries<br />
in <strong>2011</strong>, something which had already occurred in the year<br />
2010.<br />
The graph below shows the evolution of the frequency rate<br />
(number of accidents per million hours worked) for personal<br />
accidents leading to working day losses by our own staff,<br />
which refl ects the effort to come in line with international best<br />
practices in terms of communicating performance indicators.<br />
Lost workday injuries and injury rate - own staff<br />
2009<br />
2010<br />
1 1.17<br />
2009<br />
1 1.35<br />
2010<br />
0 0.00<br />
<strong>2011</strong><br />
0 0.00<br />
Lost workday injuries<br />
6 6.41<br />
Injury rate<br />
The fact that there were no accidents resulting in lost workday<br />
injuries on own staff implies that no work days were lost, and<br />
this fact translates on the severity level (total number of days<br />
lost/number of lost workday injuries) that is shown in the<br />
following graph.<br />
Lost workday injuries and lost workday severity - own staff<br />
2009<br />
2010<br />
1 68<br />
185<br />
2009<br />
1 63<br />
2010<br />
0 0<br />
<strong>2011</strong><br />
0 0<br />
Lost workday injuries<br />
6<br />
Lost workday severity<br />
Considering the refi nery’s own staff and the contractors’<br />
workers, a total of 40 accidents are registered.<br />
MATOSINHOS REFINERY / DATA BOOK ON HEALTH, SAFETY AND ENVIRONMENT <strong>2011</strong><br />
41<br />
08
08 01 02 03 04 05 06 07 HEALTH AND SAFETY PERFORMANCE 09 10 11<br />
42<br />
Total accidents - Own staff and contractors (No.)<br />
2009<br />
2010<br />
<strong>2011</strong><br />
Lost workday injuries of contractors have revealed two<br />
incidents that resulted in 3 workers with lost workdays.<br />
MATOSINHOS REFINERY / DATA BOOK ON HEALTH, SAFETY AND ENVIRONMENT <strong>2011</strong><br />
30<br />
Considering also these 3 accidents that originated lost workdays<br />
as well hours worked, there is a change in the overall<br />
frequency rate for accidents leading to working day losses (our<br />
own staff and contractors), of 0.9, in <strong>2011</strong>.<br />
Lost workday injuries and lost workday frequency<br />
(Own staff + contractors)<br />
2009<br />
1.3 3<br />
2010<br />
0.2 1<br />
2009<br />
<strong>2011</strong><br />
0.9<br />
3<br />
2010<br />
Lost workday injuries Lost workday injuries frequency<br />
<strong>2011</strong><br />
Statistical analysis and reporting of the frequency rate of<br />
accidents involving lost workday injuries by most petrochemical<br />
companies at European level, allows the reference benchmark<br />
for this sector. For the year <strong>2011</strong>, the value taken as a<br />
reference to a calculation that includes accidents of its own<br />
staff and contractors was 2.2 for this branch of industrial<br />
activity according to the 2010 Concawe’s report.<br />
This reference makes it possible to assess the degree of<br />
performance of <strong>Matosinhos</strong> refi nery that comparing its<br />
frequency rate of 0.9 is positioned securely at the level of the<br />
best companies in this activity sector as far as accident rate is<br />
concerned.<br />
Inseparably from the frequency rate, the severity index must<br />
be considered, once this one expresses the number of lost<br />
workdays resulting from the type of injury for each accident<br />
with lost workdays.<br />
The 3 accidents that resulted in lost workdays in all contractors’<br />
workers were refl ected in the severity index, as shown in the<br />
graph below. In <strong>2011</strong> and including all universes (refi nery and<br />
contractors) the severity level was 15.<br />
40<br />
60<br />
Lost workday injuries and lost workday severity<br />
(Own staff + contractors)<br />
1 18<br />
15<br />
3 54<br />
Lost workday injuries Lost workday injuries severity<br />
In addition to investigating accidents at work the refi nery also<br />
investigates all incidents including material, environmental,<br />
road accidents and near misses. Particularly the analysis of<br />
the latter reveals a huge potential for the improvement of the<br />
plant’s safety.<br />
3<br />
<strong>2011</strong> was characterized by the absence of environmental<br />
accidents. However as far as material accidents are concerned<br />
on August 11, during the startup of the new units, there was an<br />
internal outbreak in an acidic water storage tank, which caused<br />
the ceiling burst, without consequences for people, facilities or<br />
the environment.
01<br />
02<br />
03<br />
04<br />
8.2 Occupational medicine<br />
Occupational medicine in <strong>Matosinhos</strong> refi nery operates with<br />
a view to the promotion of the health of workers and the<br />
prevention of occupational diseases. For this purpose a periodic<br />
plan of examinations is performed throughout the year, as<br />
well as for the admission of new workers and occasional<br />
examinations either on the initiative of the occupational<br />
physician or the initiative of the employee.<br />
The following chart illustrates the number of medical<br />
examinations performed in <strong>Matosinhos</strong> refi nery during the<br />
period 2007 to <strong>2011</strong>. For 2007 only aggregated information<br />
is available – total accident, while for other years it is already<br />
possible to segregate the number of examinations depending<br />
on its type.<br />
A total of 916 medical examinations were held in <strong>2011</strong><br />
including admission, periodical and occasional examinations.<br />
There is an increasing number of scheduled examinations in a<br />
clear demonstration of good planning for this activity.<br />
Annual observation<br />
<strong>Matosinhos</strong> refi nery, a top level dangerous industry considering<br />
the quantities and characteristics of the products stored,<br />
according to the provisions of Decree-Law No. 254/2007, of<br />
July 12, implemented a safety management system for the<br />
prevention of industrial accidents (SGSPAG) that allows the<br />
confi rmation that the existing measures for the prevention and<br />
mitigation of major accidents involving dangerous substances<br />
are suffi cient and appropriate.<br />
Accordingly, since 2008, audits are carried out annually by<br />
qualifi ed auditors of the Portuguese Environment Agency (APA).<br />
These audits through the issuance of Statements of Compliance<br />
have confi rmed that the refi nery of <strong>Matosinhos</strong> complies with<br />
the legal safety requirements and operates based on sustained<br />
principles of environment valuation and safety of installations.<br />
In <strong>2011</strong>, the result of the audit identifi ed two “Non-compliances”<br />
(NC) and two “Opportunities for improvement” (OI).<br />
The number of non-compliances that have been identifi ed<br />
in the period between 2008 and <strong>2011</strong> is presented below.<br />
Non compliances are defi ned as improvement opportunities<br />
for what and for each one of them an action plan is defi ned<br />
containing measures to eliminate the root causes.<br />
05<br />
06<br />
07<br />
HEALTH AND SAFETY PERFORMANCE 09 10 11<br />
Medical examination undertaken (No.)<br />
2007<br />
1,455<br />
2008<br />
865<br />
263 34<br />
2009<br />
696 255 21<br />
2010<br />
525 323 19<br />
<strong>2011</strong><br />
575 327 14<br />
Total examinations Ocasional examinations Periodic examinations<br />
Admission examinations<br />
A tight monitoring of the health of workers has been ensuring<br />
the absence of occupational diseases once again confi rmed in<br />
the year <strong>2011</strong>.<br />
8.3 Safety Management System for Serious<br />
Accident Prevent<br />
Audit identified<br />
2008<br />
2009<br />
2010<br />
<strong>2011</strong><br />
2<br />
2<br />
3<br />
3<br />
Non compliance Improvement opportunities<br />
Simulation exercises and training<br />
exercises<br />
<strong>Matosinhos</strong> refi nery’s emergency scenarios are fully<br />
characterized in terms of the Internal Emergency Plan.<br />
4<br />
4<br />
The completion of regular training exercises and simulacrums,<br />
in addition to legal compliance, has as main objective to<br />
evaluate the effectiveness of the Internal Emergency Plan (PEI),<br />
to train those involved in the emergency response, and assess<br />
the training needs based on proven team performance.<br />
In <strong>2011</strong>, the refi nery planned and carried out 9 training<br />
exercises and a simulation exercise, testing the responses to<br />
various scenarios defi ned in the Internal Emergency Plan.<br />
MATOSINHOS REFINERY / DATA BOOK ON HEALTH, SAFETY AND ENVIRONMENT <strong>2011</strong><br />
10<br />
43<br />
08
08 01 02 03 04 05 06 07 HEALTH AND SAFETY PERFORMANCE 09 10 11<br />
44<br />
The following graph shows the number of exercises carried out<br />
between 2007 and <strong>2011</strong>.<br />
Simulation exercices (No.)<br />
2007<br />
2008<br />
2009 10<br />
2010 9<br />
<strong>2011</strong> 10<br />
Implementing a Management System for Safety, Health and<br />
the Environment requires, among other guidelines, the means<br />
to measure its outcome. The performance of Preventive Safety<br />
and Environmental Observations (OPAS), assumed as the act of<br />
to observe, talk and register as a means to correct actions or<br />
dangerous situations, is one of the indicators used to assess the<br />
effi ciency and ascertain system guidelines<br />
<strong>Matosinhos</strong> refi nery established the annual goal of 840 hours<br />
of OPAS, however, that goal has been being exceeded over the<br />
years, as shown in the following chart. In <strong>2011</strong>, 992 hours of<br />
OPAS were completed.<br />
MATOSINHOS REFINERY / DATA BOOK ON HEALTH, SAFETY AND ENVIRONMENT <strong>2011</strong><br />
7<br />
8<br />
8.4 Preventive Safety and Environmental<br />
Observations<br />
No. of OPAS hours undertaken<br />
2009<br />
2010<br />
<strong>2011</strong><br />
1,017<br />
992<br />
1,143
01<br />
02<br />
03<br />
04<br />
05<br />
06<br />
07<br />
08 DESEMPENHO COMMUNITY EM RELATIONS AMBIENTE<br />
09<br />
10 11<br />
09 . COMMUNITY RELATIONS<br />
MATOSINHOS REFINERY / DATA BOOK ON HEALTH, SAFETY AND ENVIRONMENT <strong>2011</strong><br />
45<br />
09
09 01 02 03 04 05 06 07 08 COMMUNITY RELATIONS<br />
10 11<br />
46<br />
The refi nery is fi rmly committed in the approach with the<br />
surrounding local residents in order to meet their needs and<br />
concerns. For this purpose, an email address was created,<br />
refi nariamatosinhos@galpenergia.com, which allows dealing<br />
with situations like complaints, suggestions, among others, in a<br />
more expeditious and methodical way. In <strong>2011</strong> there were no<br />
records at this address.<br />
This initiative aims to appropriately give a response to the<br />
progressive enrichment of the population of <strong>Matosinhos</strong><br />
with particular emphasis to the surroundings of the refi nery,<br />
ensuring that this installation does not introduce factors that<br />
jeopardize the quality of life of the city and its inhabitants.<br />
This way the Refi nary seeks to develop initiatives that<br />
contribute for the above purposes. For <strong>2011</strong> we point out the<br />
following:<br />
Open refi nery<br />
Between the 28 th and the 30 th September the refi nery opened<br />
its doors to the outside citizens. We were rewarded with the<br />
visit of hundreds of people interested in knowing the “inside”<br />
of a refi nery. A reception tent was installed in the Leça da<br />
Palmeira marginal, near the well known Tidal Pool by architect<br />
Siza Vieira and buses were made available to visitors to travel<br />
through the main streets of the refi nery<br />
School visits<br />
Integrated in school projects, or just as an opportunity to<br />
extend knowledge and experience of an industrial site in full<br />
operation, we are visited annually by hundreds of students<br />
of various levels of education. To these students and their<br />
teachers, a brief presentation of the refi nery and its products is<br />
made, complemented later with a bus tour to the main spots<br />
of the refi nery. In <strong>2011</strong> we were visited by about 800 students.<br />
Protocols with schools<br />
The refi nery has concluded agreements with several schools in<br />
the municipality of <strong>Matosinhos</strong>, including the EB Perafi ta School,<br />
the EB Leça da Palmeira School and the Secondary School of<br />
Boa Nova. Under these protocols the refi nery contributes with<br />
funds to equip laboratories, to carry out minor improvement<br />
works of education facilities, and to develop projects such as<br />
school-radio.<br />
The refi nery allocates annually the <strong>Galp</strong> Award for the best<br />
student in the 9th grade of EB schools and the best students<br />
in Physics and Chemistry for High School. The refi nery is also<br />
committed to receive interns from courses in professional<br />
areas of which we highlight occupational health and safety<br />
technicians and the environmental technicians.<br />
Also as part of a technical training, the refi nery has protocols<br />
with professional schools in order to guide the training needs<br />
of industry, while ensuring job opportunities for students when<br />
recruiting employees.<br />
MATOSINHOS REFINERY / DATA BOOK ON HEALTH, SAFETY AND ENVIRONMENT <strong>2011</strong><br />
Finally, within the chapter on safety awareness, several<br />
technicians from the refi nery, experts in Health, Safety and<br />
the Environment have collaborated with several high schools<br />
in the municipality of <strong>Matosinhos</strong> disclosing to young students<br />
messages inducing safe behaviors.<br />
Social Responsibility<br />
The refi nery as a member of the community cannot be kept<br />
apart from the diffi culties that the most disadvantaged sectors<br />
experience in this period of economic contraction. Accordingly,<br />
we made donations to various charities and associations for<br />
the elderly, participating in the purchase and distribution of<br />
equipment useful for the welfare and quality of life of patients<br />
and the elderly.<br />
Striving to attend situations of need in the social tissue of<br />
<strong>Matosinhos</strong>, in collaboration with the parish councils and the<br />
church, the refi nery has been at christmas with the most<br />
disadvantaged families, and associations that support them,<br />
helping to make this a time of great solidarity.<br />
The refi nery also promotes recreational and sports events to<br />
support sports at local clubs.
01<br />
02<br />
03<br />
04<br />
05<br />
06<br />
07<br />
10 . GLOSSARY<br />
08 09 DESEMPENHO GLOSSARY EM AMBIENTE<br />
10<br />
11<br />
MATOSINHOS REFINERY / DATA BOOK ON HEALTH, SAFETY AND ENVIRONMENT <strong>2011</strong><br />
47<br />
10
10 01 02 03 04 05 06 07 08 09 GLOSSARY<br />
11<br />
48<br />
Term Defi nition Unity<br />
Accident frequency (total<br />
and lost workday injuries)<br />
Corresponds to the ratio between the number of accidents (total and with working day losses, respectively)<br />
and millions of hours worked. The hours worked correspond to the sum of the annual hours worked by each<br />
member of the staff.<br />
Accidents in itinerae Represent accidents occurring on the route normally taken by the worker, whichever direction he or she is<br />
heading in, between the workplace or training location linked to said worker’s professional activity and his or<br />
her main or secondary residence, the place he or she normally has meals or the premises where he or she<br />
normally receives wages, resulting in death or bodily harm. Considers only the own staff.<br />
AP Represents the Aromatics Plant, a plant within the <strong>Matosinhos</strong> refi nery used for the production of solvents and<br />
aromatic compounds (toluene, xylene and benzene).<br />
API Density Unit of density according to the indicator of the American Institute of Petroleum<br />
(°API = (141.5/ specifi c weight at 60° F) - 131.5).<br />
Biochemical Oxygen<br />
Demand 5 (BOD 5 )<br />
Corresponds to the oxygen consumed in the degradation of organic material at a mean temperature of<br />
20ºC over 5 days in the wastewater, in accordance with the laboratory analyses conducted in the refi nery<br />
Laboratory.<br />
Claus Unit This is the unit used for recovering Sulphur.<br />
CO 2 Emissions under<br />
EU-ETS<br />
Represents the total carbon dioxide emissions accounted for in accordance with the provisions of refi nery’s<br />
Greenhouse Gas Emission Permit.<br />
Costs Total operating expenditure for operations related to each of the environmental categories (protection of water<br />
resources; waste management; soil and groundwater protection; air and climate protection). Classifi cation is<br />
made in accordance with the defi nitions of the National Statistical Institute .<br />
Cyanides Corresponds to the concentration of Cyanides in wastewater in accordance with the laboratory analyses<br />
conducted in the refi nery Laboratory.<br />
MATOSINHOS REFINERY / DATA BOOK ON HEALTH, SAFETY AND ENVIRONMENT <strong>2011</strong><br />
Number of accidents<br />
by millions of hours<br />
worked<br />
Number of accidents<br />
Electricity production Represents electricity production measured on the boiler counters. Number of Tonnes<br />
of Oil<br />
Equivalent (toe)<br />
End-of-line equipment Facilities, equipment and identifi able machinery parts, as well as construction, that operate at the end of the<br />
production process, aimed at treating, preventing or measuring pollution.<br />
Fuel Gas Consumption Fuel gas consumption, for burning in Large Combustion Plants and process furnaces. Consumption by Flares<br />
(only regarding the pilots, excluding losses) is also associated with the Process.<br />
Gas Consumption Consumption of Fuel Gas enriched with Natural Gas, burned in the LCPs and process furnaces.<br />
Hazardous industrial<br />
waste produced<br />
Hydrocarbons in<br />
wastewater per level of<br />
activity<br />
Hydrocarbons in<br />
wastewater<br />
Represents the quantity of industrial waste that does represent a hazard to<br />
health and the environment, according to the applicable legislation and the<br />
European Waste List. The Lubricants Plant is not included.<br />
Corresponds to the concentration of hydrocarbons in wastewater in accordance with the laboratory analyses<br />
conducted in the refi nery Laboratory.<br />
Corresponds to the concentration of hydrocarbons in wastewater in accordance with the laboratory analyses<br />
conducted in the refi nery Laboratory.<br />
Industrial waste (hazardous Means the ratio between the quantity of industrial waste (hazardous or non-hazardous) and the load<br />
and nonhazardous) produced processed.<br />
per level of activity<br />
Integrated technologies Equipment and/or facilities or parts of equipment and/or facilities, that have been modifi ed to reduce<br />
pollution, integrated into the production process. Includes studies involving integrated analysis of solutions to<br />
improve environmental performance.<br />
Investments Total of the amounts of investment in the various environmental categories<br />
(Protection of water resource; Waste Management; Soil and groundwater protection; Air and climate protection)<br />
and Safety, Health and Hygiene at Work.<br />
The classifi cation is made according to the provisions supplied by the National<br />
Statistical Institute.<br />
º API<br />
mg/l<br />
ton<br />
€<br />
mg/l<br />
Number of accidents<br />
ton<br />
g/ton<br />
mg/l<br />
kg/ton<br />
€
01<br />
02<br />
03<br />
04<br />
05<br />
06<br />
07<br />
GLOSSARY<br />
08 09 11<br />
Term Defi nition Unity<br />
LCP’s Large Combustion Facilities used in energy production, with thermal power<br />
greater than 50 MWt.<br />
Load processed<br />
(Level of activity)<br />
The load processed is a measure of the refi nery’s production intensity and Level<br />
of Activity, and is provided by the quantity, in mass, of raw materials that are processed, weighted by a<br />
conversion factor for crude oil equivalent.<br />
The conversion factor depends on the level of treatment that the raw materials and components are subjected.<br />
This weighting was introduced in 2008 to understand better the load processed.<br />
Lost Workday injuries Refers to the total number of work accidents (does not include accidents in itinerae), in which there were days<br />
or shifts in which the worker did not perform his or her duties, due to any inability to carry out his or her work.<br />
Medical examinations Refers to the number of admission examinations (obligatory medical examinations when a worker is hired, in<br />
order to evaluate the employee’s physical and psychological ability to carry out the function for which they are<br />
contracted);<br />
The number of periodic examinations (conducted at intervals prescribed by law, according to the worker’s<br />
age group); the number of occasional examinations (conducted for specifi c reasons, or on a doctor’s request/<br />
initiative, or at the request of the worker).<br />
Only Petrogral workers are considered.<br />
Medical Treatment<br />
Cases<br />
Refers to the total number of work accidents (excluding accidents on the way to or from work), requiring the<br />
worker to be attended by a doctor.<br />
Natural Gas Consumption Consumption of Natural Gas burned in the LCP´s and process furnaces. ton<br />
Non-hazardous<br />
industrial waste<br />
produced<br />
Represents the quantity of industrial waste that does not represent a hazard to health and the environment,<br />
according to the applicable legislation and the European Waste List. It does not include recovered materials.<br />
The Lubricants Plant is not included.<br />
NO emissions Represents nitrogen oxide emissions (nitrogen monoxide and nitrogen dioxide), deriving from combustion of<br />
x<br />
RFO, Fuel gas and Natural gas, in boilers, Cogeneration and process furnaces.<br />
NO = NO + NO + NO x x RFO x FG x NG<br />
NO (t) = Consumption (t) x F x PCI (TJ/t) x 10 x RFO RFO RFO emission RFO -3<br />
NO x Emissions<br />
per level of activity<br />
NO x FG (t) = Consumption FG (t) x F FG emission x PCI FG (TJ/t) x 10 -3<br />
NO x GN according to the “Air Pollutant Emission estimation methods for EPER and PRTR reporting by refi neries,<br />
Concawe, report number 3/07R:<br />
NO x GN = NO x thermal + NO x fuel<br />
NO x thermal (kg) = 10 -3 x Consumption GN (t) x 1,11 x PCI (MJ/t) x F Base x F H2 x F Control x F Preheat x F H2O x F Load x F Burn<br />
NO x combustível = O Given that the percentage of combustible nitrogen in the Natural gas is zero.<br />
The formulas for RFO and Fuel Gas are applied to the combustion emissions, in accordance with the emission<br />
factors relating to combustion equipment having a thermal power greater or less than 50 MWt.<br />
Combustion units Type of fuel Emission factor<br />
With thermal power < 50MWt<br />
RFO 180<br />
Fuel gas 140<br />
With thermal power > 50MWt<br />
RFO 190<br />
Fuel gas 140<br />
From 1 April for fi xed sources with continuous monitoring, the calculation of emissions switched to being<br />
conducted by the Centralised Environmental Information System (SIAC - Sistema Informacao Ambiental<br />
Centralizada).<br />
Means the ratio between NO X emissions, counted according to the contents of<br />
“NO X Emissions” and the load processed.<br />
MATOSINHOS REFINERY / DATA BOOK ON HEALTH, SAFETY AND ENVIRONMENT <strong>2011</strong><br />
ton<br />
Number of accidents<br />
Number of<br />
examinations<br />
Number of accidents<br />
ton<br />
NO x emissions<br />
kg/ton<br />
49<br />
10
10 01 02 03 04 05 06 07 08 09 GLOSSARY<br />
11<br />
50<br />
Term Defi nition Unity<br />
Number of trainees in<br />
training programmes<br />
in Health, Safety and<br />
Environment<br />
Number of trainees in<br />
training programmes<br />
provided in Health,<br />
Safety and<br />
Environment<br />
Number of training<br />
programmes provided<br />
in Health and Safety<br />
Number of training<br />
programmes in<br />
Health, Safety and the<br />
Environment<br />
Represents the total number of <strong>Galp</strong> <strong>Energia</strong> trainees that attended the internal and external training activities<br />
regarding matters of Health, Safety and the Environment.<br />
Represents the total number of trainees (<strong>Galp</strong> <strong>Energia</strong> employees and service providers), who attended training<br />
activities regarding matters of Health, Safety and the Environment provided by the Safety and Environment<br />
departments.<br />
Represents the total number of training sessions regarding matters of Health and Safety provided by the Safety<br />
Department to employees and service providers.<br />
Represents the total number of different internal and external training activities<br />
regarding matters of Health, Safety and the Environment attended by employees, such as courses, seminars<br />
and other activities.<br />
Occupational diseases Refers to as illnesses caused by the activity performed by the worker or included on the list of occupational<br />
illnesses (Dec-Reg 12/80 and Decree-Law No. 248/99).<br />
Oils and Grease Corresponds to the concentration of Oils and Grease in wastewater, in accordance with the laboratory analyses<br />
conducted in the refi nery Laboratory.<br />
Particulate Matter<br />
emissions<br />
Particulate Matter<br />
emissions per Level of<br />
Activity<br />
Represents the total particulate emissions (unburned fuel, soot and incondensable matter in suspension in gas<br />
fl ows), deriving from the RFO, Natural Gas and Fuel Gas combustion in the LCP´s, in process furnaces and the AP.<br />
The emissions are determined in accordance with the formulas in the EPA Manual:<br />
Emissions particules = Emissions RFO + Emissions FG + Emissions GN<br />
Emissions RFO = (9,19x%S RPC + 3,22) x 0,1195 x Consumo RPC (t)<br />
P RPC (g/cm 3 )<br />
Emissions = FG Consumption x 7,6 x 16<br />
FG<br />
P FG (g/cm 3 ) x 10 6<br />
Emissions GN = Consumption GN x 7,6 x 16 GN<br />
P GN (g/cm 3 ) x 10 6<br />
Beginning April 1 st , for fi xed sources with continuous monitoring, the calculation of emissions will be switched<br />
to being conducted by the Centralised Environmental Information System (SIAC - Sistema Informação Ambiental<br />
Centralizada).<br />
Means the ratio between the particulate matter emissions, accounted for according to the contents of<br />
“Particulate matter emissions” and the load processed.<br />
Personal accidents Refers to the total number of accidents suffered by employees excluding in itinerate. Includes accidents<br />
involving fi rst aid, cases of medical treatment and accidents leading to working day losses.<br />
pH in wastewater Refers to the potential hydrogen in the wastewater from the Refi nery WWTP, through laboratory analyses<br />
conducted on them.<br />
Phenols Represents the concentration of Phenols in wastewater in accordance with the laboratory analyses conducted<br />
in the Refi nery Laboratory.<br />
Process The process includes the plant activities involving fuel consumption. The Flares and Claus Unit are included in<br />
this description.<br />
Processed Crude Represents the quantity of crude oil processed in the refi nery, supplying the units. ton<br />
MATOSINHOS REFINERY / DATA BOOK ON HEALTH, SAFETY AND ENVIRONMENT <strong>2011</strong><br />
Number of trainees<br />
Number of trainees<br />
Number of activities<br />
Number of activities<br />
Number of cases<br />
mg/L<br />
ton<br />
kg/ton<br />
Number of accidents<br />
Sorensen Scale<br />
Production Represents the quantity of each type of product produced in the Refi nery. Number of ton/<br />
product<br />
mg/L
01<br />
02<br />
03<br />
04<br />
05<br />
06<br />
07<br />
GLOSSARY<br />
08 09 11<br />
Term Defi nition Unity<br />
Property damaging<br />
accidents<br />
Quantity of recovered<br />
materials<br />
Refers to the total number of accidents causing damage to material goods, namely, assets, equipment, product,<br />
productivity, stoppage of production, fi nes for non-compliance with legislation or expenses of another nature,<br />
related to the accident or the person involved in the accident.<br />
Corresponds to the quantity of materials sent for recycling, such as scrap metal, packaging, paper, plastic and<br />
used oil. The Lubricants Plant is not included.<br />
Recovered Sulphur Represents in terms of mass the sulphur recovered in sulphur recovery units.<br />
This value is determined based on the refi nery mass balances, according to the load of H 2 S in the units and its<br />
purifi cation effi ciency.<br />
Recovered sulphur per<br />
load processed<br />
This is provided by the ratio between recovered sulphur, accounted for as described in the contents of<br />
“Recovered sulphur”, and the load processed.<br />
Recycled water Represents the quantity of treated water in the WWTP of Refi nery that is reuse in the water fi re network and in<br />
the service water network.<br />
RFO Consumption Consumption of Combustible Process Waste (Fuel-oil for internal consumption), for burning in LCP´s and process<br />
furnaces.<br />
Number of accidents<br />
Severity rate Number of total days lost per Number of Lost workdays injuries Number of total days<br />
lost/ number of lost<br />
workdays injuries<br />
SO 2 emissions This indicator represents the sulphur dioxide emissions arising from RFO combustion LCP´s and in process<br />
furnaces, in the AP and in the Claus Unit. The combustion emissions are calculated using the following formula:<br />
SO 2 Emissions per level of<br />
activity<br />
SO 2 = SO 2 RFO (t) = Consumption RFO (t) x % S RFO x 0,02<br />
% S RFO represents the level of Sulphur in the RFO (See “Sulphur content in the RFO”). Emissions of SO 2 from the<br />
Fuel Gas and Natural Gas are not considered as the level of Sulphur is very close to zero.<br />
Beginning April 1 st , for fi xed sources with continuous monitoring, the calculation of emissions switched to<br />
being conducted by the Centralised Environmental Information System (SIAC - Sistema Informação Ambiental<br />
Centralizada).<br />
Means the ratio between SO 2 emissions, accounted for according to the contents of “SO 2 Emissions” and the<br />
treated load.<br />
SO 2 ”bubble” Represents the concentration of sulphur oxides in the form of sulphur dioxide, a virtual stack, weighing the<br />
various fl ow rates and concentrations of different sources, as well as their sulphur content. The formula was<br />
approved by the Portuguese Agency for the Environment, and excludes emissions from the Claus unit and<br />
Flares.<br />
Sulphur content in the<br />
RFO<br />
Means the percentage value of sulphur content in RFO. This value is determined in the laboratory, through<br />
weekly analyses on compound samples, the annual value constituting a weighted average of the mean<br />
monthly values.<br />
Total Iron Represents the concentration of Iron in wastewater in accordance with the laboratory analyses conducted in<br />
the Refi nery Laboratory.<br />
Total Suspended Solids Corresponds to the concentration of Suspended Solids in the wastewater, in accordance with the laboratory<br />
analyses conducted in the Refi nery Laboratory.<br />
Wastewater<br />
per level of activity<br />
Wastewater<br />
produced<br />
Waste produced considered<br />
solid urban waste<br />
Water consumption per level<br />
of activity<br />
Means the ratio between wastewater produced, accounted for according to the contents of “Wastewater<br />
produced” and the load processed.<br />
Involves the volume of wastewater produced. m 3<br />
Means the quantity of domestic or similar waste produced, due to its nature or composition ton<br />
Represents the consumption of process water in the plant (captured from the Ave River), as well as water for<br />
human consumption from the <strong>Matosinhos</strong> Municipal Water and Sanitation Service<br />
MATOSINHOS REFINERY / DATA BOOK ON HEALTH, SAFETY AND ENVIRONMENT <strong>2011</strong><br />
ton<br />
ton<br />
kg/ton<br />
m 3<br />
ton<br />
Múltiplo de t<br />
kg/ton<br />
mg/Nm 3<br />
%<br />
mg/l<br />
mg/l<br />
m 3 /ton<br />
m 3 /ton<br />
51<br />
10
11 01 02 03 04 05 06 07 08 09 10 DECLARAÇÃO CONFORMITY DE CONFORMIDADE<br />
STATEMENT<br />
11<br />
52<br />
11 . CONFORMITY STATEMENT<br />
MATOSINHOS REFINERY / DATA BOOK ON HEALTH, SAFETY AND ENVIRONMENT <strong>2011</strong>
01<br />
02<br />
03<br />
04<br />
05<br />
06<br />
07<br />
08 09 10<br />
CONFORMITY STATEMENT<br />
MATOSINHOS REFINERY / DATA BOOK ON HEALTH, SAFETY AND ENVIRONMENT <strong>2011</strong><br />
53<br />
11
11 01<br />
02 03 04 05 06 07 08 09 10<br />
CONFORMITY STATEMENT<br />
54<br />
MATOSINHOS REFINERY / DATA BOOK ON HEALTH, SAFETY AND ENVIRONMENT <strong>2011</strong>
<strong>Galp</strong> <strong>Energia</strong>, SGPS, S. A.<br />
Public Company<br />
Investor Relations and Corporate<br />
Communication Division<br />
Rua Tomás da Fonseca, Torre C<br />
1600-209 Lisboa<br />
Tel.: +351 217 240 866<br />
Fax: +351 217 242 965<br />
e-mail: investor.relations@galpenergia.com<br />
www.galpenergia.com