Cranbourne East Precinct Structure Plan - Growth Areas Authority
Cranbourne East Precinct Structure Plan - Growth Areas Authority
Cranbourne East Precinct Structure Plan - Growth Areas Authority

You also want an ePaper? Increase the reach of your titles
YUMPU automatically turns print PDFs into web optimized ePapers that Google loves.
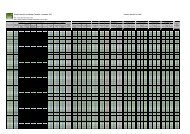
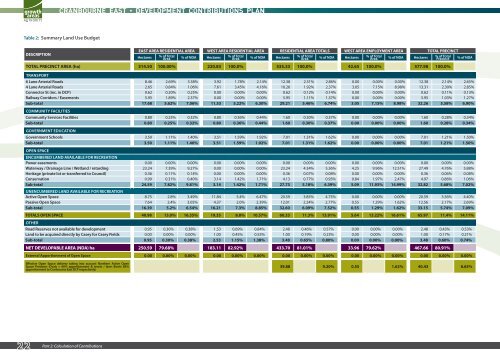
Table 2: Summary Land Use Budget<br />
DESCRIPTION<br />
EAST AREA RESIDENTIAL AREA WEST AREA RESIDENTIAL AREA RESIDENTIAL AREA TOTALS WEST AREA EMPLOYMENT AREA TOTAL PRECINCT<br />
Hectares % of Total<br />
Area % of NDA Hectares % of Total<br />
Area % of NDA Hectares % of Total<br />
Area % of NDA Hectares % of Total<br />
Area % of NDA Hectares % of Total<br />
<strong>Precinct</strong> % of NDA<br />
TOTAL PRECINCT AREA (ha) 314.50 100.00% 220.83 100.0% 535.33 100.0% 42.65 100.0% 577.98 100.0%<br />
TRANSPORT<br />
6 Lane Arterial Roads 8.46 2.69% 3.38% 3.92 1.78% 2.14% 12.38 2.31% 2.86% 0.00 0.00% 0.00% 12.38 2.14% 2.65%<br />
4 Lane Arterial Roads 2.65 0.84% 1.06% 7.61 3.45% 4.16% 10.26 1.92% 2.37% 3.05 7.15% 8.98% 13.31 2.30% 2.85%<br />
Connector St (inc. in DCP) 0.62 0.20% 0.25% 0.00 0.00% 0.00% 0.62 0.12% 0.14% 0.00 0.00% 0.00% 0.62 0.11% 0.13%<br />
Railway Corridors / Easements 5.95 1.89% 2.37% 0.00 0.00% 0.00% 5.95 1.11% 1.37% 0.00 0.00% 0.00% 5.95 1.03% 1.27%<br />
Sub-total 17.68 5.62% 7.06% 11.53 5.22% 6.30% 29.21 5.46% 6.74% 3.05 7.15% 8.98% 32.26 5.58% 6.90%<br />
COMMUNITY FACILITIES<br />
Community Services Facilities 0.80 0.25% 0.32% 0.80 0.36% 0.44% 1.60 0.30% 0.37% 0.00 0.00% 0.00% 1.60 0.28% 0.34%<br />
Sub-total 0.80 0.25% 0.32% 0.80 0.36% 0.44% 1.60 0.30% 0.37% 0.00 0.00% 0.00% 1.60 0.28% 0.34%<br />
GOVERNMENT EDUCATION<br />
Government Schools 3.50 1.11% 1.40% 3.51 1.59% 1.92% 7.01 1.31% 1.62% 0.00 0.00% 0.00% 7.01 1.21% 1.50%<br />
Sub-total 3.50 1.11% 1.40% 3.51 1.59% 1.92% 7.01 1.31% 1.62% 0.00 0.00% 0.00% 7.01 1.21% 1.50%<br />
OPEN SPACE<br />
ENCUMBERED LAND AVAILABLE FOR RECREATION<br />
Power easements 0.00 0.00% 0.00% 0.00 0.00% 0.00% 0.00 0.00% 0.00% 0.00 0.00% 0.00% 0.00 0.00% 0.00%<br />
Waterway / Drainage Line / Wetland / retarding 23.24 7.39% 9.27% 0.00 0.00% 0.00% 23.24 4.34% 5.36% 4.25 9.96% 12.51% 27.49 4.76% 5.88%<br />
Heritage (private lot or transferred to Council) 0.36 0.11% 0.14% 0.00 0.00% 0.00% 0.36 0.07% 0.08% 0.00 0.00% 0.00% 0.36 0.06% 0.08%<br />
Conservation 0.99 0.31% 0.40% 3.14 1.42% 1.71% 4.13 0.77% 0.95% 0.84 1.97% 2.47% 4.97 0.86% 1.06%<br />
Sub-total<br />
UNENCUMBERED LAND AVAILABLE FOR RECREATION<br />
24.59 7.82% 9.81% 3.14 1.42% 1.71% 27.73 5.18% 6.39% 5.09 11.93% 14.99% 32.82 5.68% 7.02%<br />
Active Open Space 8.75 2.8% 3.49% 11.84 5.4% 6.47% 20.59 3.85% 4.75% 0.00 0.00% 0.00% 20.59 3.56% 4.40%<br />
Passive Open Space 7.64 2.4% 3.05% 4.37 2.0% 2.39% 12.01 2.24% 2.77% 0.55 1.29% 1.62% 12.56 2.17% 2.69%<br />
Sub-total 16.39 5.2% 6.54% 16.21 7.3% 8.85% 32.60 6.09% 7.52% 0.55 1.29% 1.62% 33.15 5.74% 7.09%<br />
TOTALS OPEN SPACE 40.98 13.0% 16.35% 19.35 8.8% 10.57% 60.33 11.3% 13.91% 5.64 13.22% 16.61% 65.97 11.4% 14.11%<br />
OTHER<br />
Road Reserves not available for development 0.95 0.30% 0.38% 1.53 0.69% 0.84% 2.48 0.46% 0.57% 0.00 0.00% 0.00% 2.48 0.43% 0.53%<br />
Land to be acquired directly by Casey for Casey Fields 0.00 0.00% 0.00% 1.00 0.45% 0.55% 1.00 0.19% 0.23% 0.00 0.00% 0.00% 1.00 0.17% 0.21%<br />
Sub-total 0.95 0.30% 0.38% 2.53 1.15% 1.38% 3.48 0.65% 0.80% 0.00 0.00% 0.00% 3.48 0.60% 0.74%<br />
NET DEVELOPABLE AREA (NDA) ha 250.59 79.68% 183.11 82.92% 433.70 81.01% 33.96 79.62% 467.66 80.91%<br />
External Apportionment of Open Space 0.00 0.00% 0.00% 0.00 0.00% 0.00% 0.00 0.00% 0.00% 0.00 0.00% 0.00% 0.00 0.00% 0.00%<br />
Eff ective Open Space delivery taking into account Northern Active Open<br />
Space Provision (Ovals = 66% apportionment & tennis / lawn Bowls 68%<br />
apportionment to <strong>Cranbourne</strong> <strong>East</strong> DCP respectively)<br />
22 Part 2: Calculation of Contributions<br />
39.88 9.20% 0.55 1.62% 40.43 8.65%<br />
cranbourne east development contributions plan<br />
SM | 20100511 02:03