Beginning the Dialogue - Report on SGR - Federal Transit ...
Beginning the Dialogue - Report on SGR - Federal Transit ...
Beginning the Dialogue - Report on SGR - Federal Transit ...

You also want an ePaper? Increase the reach of your titles
YUMPU automatically turns print PDFs into web optimized ePapers that Google loves.
C<strong>on</strong>diti<strong>on</strong>s of <strong>Transit</strong> Infrastructure<br />
relies <strong>on</strong> data reported to FTA through <str<strong>on</strong>g>the</str<strong>on</strong>g> Nati<strong>on</strong>al<br />
<strong>Transit</strong> Database (NTD) and also through special<br />
asset inventory data requests to large rail and bus<br />
operators.<br />
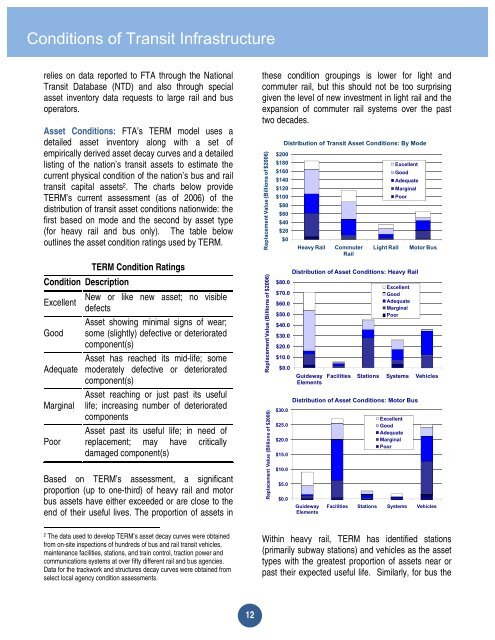
Asset C<strong>on</strong>diti<strong>on</strong>s: FTA’s TERM model uses a<br />
detailed asset inventory al<strong>on</strong>g with a set of<br />
empirically derived asset decay curves and a detailed<br />
listing of <str<strong>on</strong>g>the</str<strong>on</strong>g> nati<strong>on</strong>’s transit assets to estimate <str<strong>on</strong>g>the</str<strong>on</strong>g><br />
current physical c<strong>on</strong>diti<strong>on</strong> of <str<strong>on</strong>g>the</str<strong>on</strong>g> nati<strong>on</strong>’s bus and rail<br />
transit capital assets2 . The charts below provide<br />
TERM’s current assessment (as of 2006) of <str<strong>on</strong>g>the</str<strong>on</strong>g><br />
distributi<strong>on</strong> of transit asset c<strong>on</strong>diti<strong>on</strong>s nati<strong>on</strong>wide: <str<strong>on</strong>g>the</str<strong>on</strong>g><br />
first based <strong>on</strong> mode and <str<strong>on</strong>g>the</str<strong>on</strong>g> sec<strong>on</strong>d by asset type<br />
(for heavy rail and bus <strong>on</strong>ly). The table below<br />
outlines <str<strong>on</strong>g>the</str<strong>on</strong>g> asset c<strong>on</strong>diti<strong>on</strong> ratings used by TERM.<br />
TERM C<strong>on</strong>diti<strong>on</strong> Ratings<br />
C<strong>on</strong>diti<strong>on</strong> Descripti<strong>on</strong><br />
New or like new asset; no visible<br />
Excellent<br />
defects<br />
Asset showing minimal signs of wear;<br />
Good some (slightly) defective or deteriorated<br />
comp<strong>on</strong>ent(s)<br />
Asset has reached its mid-life; some<br />
Adequate moderately defective or deteriorated<br />
comp<strong>on</strong>ent(s)<br />
Asset reaching or just past its useful<br />
<str<strong>on</strong>g>the</str<strong>on</strong>g>se c<strong>on</strong>diti<strong>on</strong> groupings is lower for light and<br />
commuter rail, but this should not be too surprising<br />
given <str<strong>on</strong>g>the</str<strong>on</strong>g> level of new investment in light rail and <str<strong>on</strong>g>the</str<strong>on</strong>g><br />
expansi<strong>on</strong> of commuter rail systems over <str<strong>on</strong>g>the</str<strong>on</strong>g> past<br />
two decades.<br />
Replacement Value (Billi<strong>on</strong>s of $2006) Replacement Value (Billi<strong>on</strong>s of $2006) Replacement Value (Billi<strong>on</strong>s of $2006)<br />
$200<br />
$180<br />
$160<br />
$140<br />
$120<br />
$100<br />
$80<br />
$60<br />
$40<br />
$20<br />
$0<br />
Marginal life; increasing number of deteriorated $30.0<br />
comp<strong>on</strong>ents<br />
Asset past its useful life; in need of<br />
Poor replacement; may have critically<br />
damaged comp<strong>on</strong>ent(s)<br />
Based <strong>on</strong> TERM’s assessment, a significant<br />
proporti<strong>on</strong> (up to <strong>on</strong>e-third) of heavy rail and motor<br />
bus assets have ei<str<strong>on</strong>g>the</str<strong>on</strong>g>r exceeded or are close to <str<strong>on</strong>g>the</str<strong>on</strong>g><br />
end of <str<strong>on</strong>g>the</str<strong>on</strong>g>ir useful lives. The proporti<strong>on</strong> of assets in<br />
Distributi<strong>on</strong> of <strong>Transit</strong> Asset C<strong>on</strong>diti<strong>on</strong>s: By Mode<br />
Excellent<br />
Good<br />
Adequate<br />
Marginal<br />
Poor<br />
Heavy Rail Commuter Light Rail Motor Bus<br />
Rail<br />
Distributi<strong>on</strong> of Asset C<strong>on</strong>diti<strong>on</strong>s: Heavy Rail<br />
$80.0<br />
Excellent<br />
$70.0<br />
Good<br />
Adequate<br />
$60.0<br />
Marginal<br />
$50.0<br />
Poor<br />
$40.0<br />
$30.0<br />
$20.0<br />
$10.0<br />
$0.0<br />
$25.0<br />
$20.0<br />
$15.0<br />
$10.0<br />
$5.0<br />
$0.0<br />
Guideway Facilities Stati<strong>on</strong>s Systems Vehicles<br />
Elements<br />
Distributi<strong>on</strong> of Asset C<strong>on</strong>diti<strong>on</strong>s: Motor Bus<br />
Excellent<br />
Good<br />
Adequate<br />
Marginal<br />
Poor<br />
Guideway<br />
Elements<br />
Facilities Stati<strong>on</strong>s Systems Vehicles<br />
2 The data used to develop TERM’s asset decay curves were obtained<br />
from <strong>on</strong>-site inspecti<strong>on</strong>s of hundreds of bus and rail transit vehicles,<br />
maintenance facilities, stati<strong>on</strong>s, and train c<strong>on</strong>trol, tracti<strong>on</strong> power and<br />
communicati<strong>on</strong>s systems at over fifty different rail and bus agencies.<br />
Within heavy rail, TERM has identified stati<strong>on</strong>s<br />
(primarily subway stati<strong>on</strong>s) and vehicles as <str<strong>on</strong>g>the</str<strong>on</strong>g> asset<br />
types with <str<strong>on</strong>g>the</str<strong>on</strong>g> greatest proporti<strong>on</strong> of assets near or<br />
Data for <str<strong>on</strong>g>the</str<strong>on</strong>g> trackwork and structures decay curves were obtained from<br />
select local agency c<strong>on</strong>diti<strong>on</strong> assessments.<br />
past <str<strong>on</strong>g>the</str<strong>on</strong>g>ir expected useful life. Similarly, for bus <str<strong>on</strong>g>the</str<strong>on</strong>g><br />
12