Beginning the Dialogue - Report on SGR - Federal Transit ...
Beginning the Dialogue - Report on SGR - Federal Transit ...
Beginning the Dialogue - Report on SGR - Federal Transit ...

You also want an ePaper? Increase the reach of your titles
YUMPU automatically turns print PDFs into web optimized ePapers that Google loves.
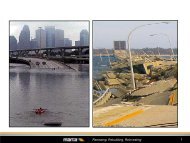
Maintaining <str<strong>on</strong>g>the</str<strong>on</strong>g> c<strong>on</strong>diti<strong>on</strong> of our transit infrastructure is an issue of nati<strong>on</strong>al importance—and<br />
<strong>on</strong>e that poses pressing challenges—for most of <str<strong>on</strong>g>the</str<strong>on</strong>g> Nati<strong>on</strong>’s transit systems. In a country<br />
where public transportati<strong>on</strong> is increasingly looked to as a necessary and critical mode of<br />
travel, ensuring that local transit systems are maintained in a “state of good repair” to provide<br />
efficient, reliable, and safe service is more important than ever.<br />
The <strong>Federal</strong> <strong>Transit</strong> Administrati<strong>on</strong> (FTA) has been, and will c<strong>on</strong>tinue to be, proactive <strong>on</strong> this<br />
issue by raising awareness throughout <str<strong>on</strong>g>the</str<strong>on</strong>g> industry, bringing diverse stakeholders toge<str<strong>on</strong>g>the</str<strong>on</strong>g>r to<br />
assess and measure <str<strong>on</strong>g>the</str<strong>on</strong>g> scope of <str<strong>on</strong>g>the</str<strong>on</strong>g> problem, and by exploring creative approaches to<br />
financing necessary repairs and upgrades for aging transportati<strong>on</strong> assets.<br />
In <str<strong>on</strong>g>the</str<strong>on</strong>g> summer of 2008, <str<strong>on</strong>g>the</str<strong>on</strong>g> <strong>Federal</strong> <strong>Transit</strong> Administrati<strong>on</strong> (FTA) brought toge<str<strong>on</strong>g>the</str<strong>on</strong>g>r<br />
representatives from 14 public transportati<strong>on</strong> providers and State Departments of<br />
Transportati<strong>on</strong> to discuss <str<strong>on</strong>g>the</str<strong>on</strong>g> state of repair of our Nati<strong>on</strong>’s transit inventory. We discussed,<br />
am<strong>on</strong>g o<str<strong>on</strong>g>the</str<strong>on</strong>g>r things, transit recapitalizati<strong>on</strong> and maintenance issues, asset management<br />
practices, and innovative financing strategies. We explored issues related to measuring <str<strong>on</strong>g>the</str<strong>on</strong>g><br />
c<strong>on</strong>diti<strong>on</strong> of transit capital assets, prioritizing local transit re-investment decisi<strong>on</strong>s, and<br />
preventive maintenance practices. And we discussed research needs and potential tools for<br />
helping agencies cope with this growing problem.<br />
Subsequently, FTA met with equipment manufacturers, c<strong>on</strong>structi<strong>on</strong> and engineering firms,<br />
and private equity firms to explore potential public-private partnership opportunities within<br />
public transportati<strong>on</strong>—including <str<strong>on</strong>g>the</str<strong>on</strong>g> potential for private-sector involvement in l<strong>on</strong>g-term<br />
capital asset management, to help ensure that legacy assets are maintained or replaced as<br />
needed.<br />
We will c<strong>on</strong>tinue to focus <strong>on</strong> this issue, in part by including a discussi<strong>on</strong> about ways to<br />
include state-of-good-repair needs in <str<strong>on</strong>g>the</str<strong>on</strong>g> next authorizati<strong>on</strong> for federal surface transportati<strong>on</strong><br />
programs.<br />
In additi<strong>on</strong>, FTA plans to c<strong>on</strong>vene a State of Good Repair Roundtable in 2009 to fur<str<strong>on</strong>g>the</str<strong>on</strong>g>r<br />
discuss <str<strong>on</strong>g>the</str<strong>on</strong>g> challenge of transit recapitalizati<strong>on</strong>, less<strong>on</strong>s learned, and best practices. We will<br />
report to C<strong>on</strong>gress as well <strong>on</strong> <str<strong>on</strong>g>the</str<strong>on</strong>g> level of investment needed to bring <str<strong>on</strong>g>the</str<strong>on</strong>g> Nati<strong>on</strong>’s largest rail<br />
transit agencies to a state of good repair, and will c<strong>on</strong>tinue to explore o<str<strong>on</strong>g>the</str<strong>on</strong>g>r opportunities to<br />
discuss this issue and potential soluti<strong>on</strong>s.<br />
Bringing our Nati<strong>on</strong>’s transit systems to a state of good repair—while at <str<strong>on</strong>g>the</str<strong>on</strong>g> same time<br />
planning for and implementing needed service expansi<strong>on</strong>s—is a steep challenge. But we at<br />
FTA are c<strong>on</strong>fident that working toge<str<strong>on</strong>g>the</str<strong>on</strong>g>r we can develop <str<strong>on</strong>g>the</str<strong>on</strong>g> soluti<strong>on</strong>s to c<strong>on</strong>tinue to provide<br />
public transportati<strong>on</strong> to <str<strong>on</strong>g>the</str<strong>on</strong>g> milli<strong>on</strong>s of Americans that depend <strong>on</strong> it.
<str<strong>on</strong>g>Beginning</str<strong>on</strong>g> <str<strong>on</strong>g>the</str<strong>on</strong>g> <str<strong>on</strong>g>Dialogue</str<strong>on</strong>g><br />
r State of Good Repair Initiative<br />
Maintaining <str<strong>on</strong>g>the</str<strong>on</strong>g> nati<strong>on</strong>’s bus and rail systems in a<br />
state of good repair (<strong>SGR</strong>) is essential if public<br />
transportati<strong>on</strong> systems are to provide safe and<br />
reliable service to milli<strong>on</strong>s of daily riders. Data,<br />
discussed later in this paper, indicates that<br />
investments to date have not been adequate. This<br />
report is <str<strong>on</strong>g>the</str<strong>on</strong>g> first step in a collaborative initiative to<br />
comprehensively articulate <str<strong>on</strong>g>the</str<strong>on</strong>g> problem, to define a<br />
comm<strong>on</strong>ly adopted definiti<strong>on</strong> of “state of good repair”,<br />
and to identify strategies, technical assistance briefs,<br />
peer to peer exchanges, and best practices aimed at<br />
achieveing such a state industrywide.<br />
Capital Funding Shares: 1997 to 2006<br />
Directly<br />
Generated<br />
28%<br />
Local<br />
16%<br />
Source: NTD<br />
State<br />
12%<br />
<strong>Federal</strong><br />
44%<br />
Since 1991, <strong>Federal</strong>, state and local funding<br />
resources have invested $165 billi<strong>on</strong> in <str<strong>on</strong>g>the</str<strong>on</strong>g><br />
preservati<strong>on</strong> and expansi<strong>on</strong> of <str<strong>on</strong>g>the</str<strong>on</strong>g> nati<strong>on</strong>’s rolling<br />
stock and infrastructure. Despite this <strong>on</strong>going<br />
investment, much of <str<strong>on</strong>g>the</str<strong>on</strong>g> nati<strong>on</strong>’s rolling stock and<br />
infrastructure is deteriorating and <str<strong>on</strong>g>the</str<strong>on</strong>g> current capital<br />
reinvestment rates appear insufficient to halt or<br />
reverse this decline. For transit riders, this<br />
deteriorati<strong>on</strong> manifests itself in <str<strong>on</strong>g>the</str<strong>on</strong>g> form of declining<br />
service reliability. For transit operators, aging capital<br />
assets drive increasing maintenance costs and limits<br />
<str<strong>on</strong>g>the</str<strong>on</strong>g> ability to expand system capacity at a time of high<br />
demand prompted by high fuel costs. All share a<br />
mutual c<strong>on</strong>cern over <str<strong>on</strong>g>the</str<strong>on</strong>g> potential impacts <strong>on</strong> safety.<br />
Current capital reinvestment rates are <strong>on</strong>ly 60%<br />
to 80% of that required to address existing<br />
backlog and normal replacement needs<br />
1<br />
These c<strong>on</strong>cerns have prompted FTA to take a closer<br />
look at <str<strong>on</strong>g>the</str<strong>on</strong>g> nati<strong>on</strong>’s transit recapitalizati<strong>on</strong> and<br />
maintenance needs. As we do so, FTA is partnering<br />
with <str<strong>on</strong>g>the</str<strong>on</strong>g> industry to help assess <str<strong>on</strong>g>the</str<strong>on</strong>g> magnitude of <str<strong>on</strong>g>the</str<strong>on</strong>g><br />
problem and to identify meaningful soluti<strong>on</strong>s. Working<br />
toge<str<strong>on</strong>g>the</str<strong>on</strong>g>r, we hope to ensure adequate commitment<br />
and resources to protect and preserve investments.<br />
r Recent Trends<br />
The <strong>on</strong>going decline<br />
of <str<strong>on</strong>g>the</str<strong>on</strong>g> nati<strong>on</strong>’s bus<br />
and rail assets and<br />
<str<strong>on</strong>g>the</str<strong>on</strong>g> increasing<br />
pressure <strong>on</strong> existing<br />
funding sources to<br />
address <str<strong>on</strong>g>the</str<strong>on</strong>g> resulting<br />
reinvestment needs<br />
has been captured by a broad range of industry<br />
analyses. C<strong>on</strong>sider <str<strong>on</strong>g>the</str<strong>on</strong>g> following:<br />
n Current C<strong>on</strong>diti<strong>on</strong>s: FTA analysis of nati<strong>on</strong>al<br />
transit data suggests that roughly <strong>on</strong>e-quarter of <str<strong>on</strong>g>the</str<strong>on</strong>g><br />
nati<strong>on</strong>’s bus and rail assets are in marginal or poor<br />
c<strong>on</strong>diti<strong>on</strong> (implying <str<strong>on</strong>g>the</str<strong>on</strong>g>se assets are near or past <str<strong>on</strong>g>the</str<strong>on</strong>g>ir<br />
useful life or have <strong>on</strong>e or more defective or<br />
deteriorated comp<strong>on</strong>ents). The proporti<strong>on</strong> of assets<br />
in marginal or poor c<strong>on</strong>diti<strong>on</strong> jumps to <strong>on</strong>e-third when<br />
<str<strong>on</strong>g>the</str<strong>on</strong>g> analysis is limited to <str<strong>on</strong>g>the</str<strong>on</strong>g> nati<strong>on</strong>’s nine largest rail<br />
agencies (including <str<strong>on</strong>g>the</str<strong>on</strong>g>se agencies’ n<strong>on</strong>-rail assets).<br />
Asset C<strong>on</strong>diti<strong>on</strong>s: Largest Rail Agencies<br />
Poor<br />
8%<br />
Excellent<br />
8%<br />
Marginal Good<br />
27% 22%<br />
Source: TERM 2006<br />
Adequate<br />
35%
<str<strong>on</strong>g>Beginning</str<strong>on</strong>g> <str<strong>on</strong>g>the</str<strong>on</strong>g> <str<strong>on</strong>g>Dialogue</str<strong>on</strong>g><br />
Asset c<strong>on</strong>diti<strong>on</strong>s are generally poorest for <str<strong>on</strong>g>the</str<strong>on</strong>g> heavy<br />
rail and bus modes (both with roughly <strong>on</strong>e-third of<br />
assets in marginal or poor c<strong>on</strong>diti<strong>on</strong>). A lesser<br />
proporti<strong>on</strong> (7%) of light rail assets are in marginal or<br />
poor c<strong>on</strong>diti<strong>on</strong>, reflecting <str<strong>on</strong>g>the</str<strong>on</strong>g> significant level of<br />
investment in new light rail systems over <str<strong>on</strong>g>the</str<strong>on</strong>g> past<br />
twenty years (resulting in a greater proporti<strong>on</strong> of<br />
younger assets compared to o<str<strong>on</strong>g>the</str<strong>on</strong>g>r modes). FTA<br />
expects <str<strong>on</strong>g>the</str<strong>on</strong>g>se percentages to grow if recapitalizati<strong>on</strong><br />
needs are not addressed.<br />
Over Age Assets By Type<br />
Power<br />
Guideway Structures<br />
Trackwork<br />
Elevators / Escalators<br />
Rail (Yards & Shops)<br />
Stati<strong>on</strong>s<br />
Communicati<strong>on</strong>s<br />
Bus Facilities<br />
Revenue Vehicles<br />
Signals<br />
Source: TERM 2006<br />
0% 10% 20% 30%<br />
Percent of Assets Exceeding<br />
Their Useful Life<br />
n <strong>SGR</strong> Backlog: Based <strong>on</strong> FTA analysis, <str<strong>on</strong>g>the</str<strong>on</strong>g> total<br />
level of investment required to bring <str<strong>on</strong>g>the</str<strong>on</strong>g> nati<strong>on</strong>’s bus<br />
and rail assets to a state of good repair is currently<br />
estimated at $25 billi<strong>on</strong> ($2004). This investment<br />
would effectively replace all assets that currently<br />
exceed <str<strong>on</strong>g>the</str<strong>on</strong>g>ir expected useful life and address<br />
delayed rehabilitati<strong>on</strong> activities. After eliminating <str<strong>on</strong>g>the</str<strong>on</strong>g><br />
backlog, an additi<strong>on</strong>al $9 to $11 billi<strong>on</strong> from all<br />
sources is required annually to maintain this state of<br />
good repair into <str<strong>on</strong>g>the</str<strong>on</strong>g> future. At present, annual capital<br />
reinvestment rates are <strong>on</strong>ly 60% to 80% of that<br />
required to address both <str<strong>on</strong>g>the</str<strong>on</strong>g> existing backlog and<br />
normal replacement needs.<br />
n Declining Share of <strong>Federal</strong> Resources: The<br />
nati<strong>on</strong>’s oldest and largest rail transit agencies carry<br />
nearly 60% of ridership and receive 40% of all<br />
<strong>Federal</strong> transit funding. And while <str<strong>on</strong>g>the</str<strong>on</strong>g> increase in <str<strong>on</strong>g>the</str<strong>on</strong>g><br />
2<br />
number of rail systems throughout <str<strong>on</strong>g>the</str<strong>on</strong>g> country brings<br />
access to improved transit service to more<br />
Americans, <str<strong>on</strong>g>the</str<strong>on</strong>g> Fixed Guideway Modernizati<strong>on</strong><br />
Program – FTA’s primary source of rail capital<br />
replacement funds – is spread more thinly as new<br />
systems are added. As a c<strong>on</strong>sequence, <str<strong>on</strong>g>the</str<strong>on</strong>g><br />
proporti<strong>on</strong> of Fixed Guideway Modernizati<strong>on</strong> funds<br />
distributed to <str<strong>on</strong>g>the</str<strong>on</strong>g> oldest rail systems (with <str<strong>on</strong>g>the</str<strong>on</strong>g> highest<br />
proporti<strong>on</strong>s of poor and marginal asset c<strong>on</strong>diti<strong>on</strong>s)<br />
has declined from over 90% in 1993 to less than 70%<br />
by 2006. The demand for Fixed Guideway<br />
Modernizati<strong>on</strong> funds will <strong>on</strong>ly accelerate as rail<br />
systems c<strong>on</strong>structed in <str<strong>on</strong>g>the</str<strong>on</strong>g> 1980s and 1990s begin to<br />
experience <str<strong>on</strong>g>the</str<strong>on</strong>g>ir first major recapitalizati<strong>on</strong> needs.<br />
Current Dollars ($Billi<strong>on</strong>s)<br />
$3.5<br />
$3.0<br />
$2.5<br />
$2.0<br />
$1.5<br />
$1.0<br />
$0.5<br />
$0.0<br />
Fixed Guideway Modernizati<strong>on</strong> Funds:<br />
1993 to 2006<br />
Total<br />
Mature Rail Cities<br />
1993 1995 1997 1999 2001 2003 2005<br />
n Safety: In recent hearings and reports, <str<strong>on</strong>g>the</str<strong>on</strong>g><br />
Nati<strong>on</strong>al Transportati<strong>on</strong> Safety Board (NTSB) stated<br />
its c<strong>on</strong>cern that <str<strong>on</strong>g>the</str<strong>on</strong>g> rail transit industry is not investing<br />
enough to protect its workers, passengers and capital<br />
assets. An example here is a July 2006 CTA Blue<br />
Line derailment where <str<strong>on</strong>g>the</str<strong>on</strong>g> NTSB c<strong>on</strong>cluded that:<br />
“The tie plates and fastener systems failed to<br />
maintain <str<strong>on</strong>g>the</str<strong>on</strong>g> track gauge because of <str<strong>on</strong>g>the</str<strong>on</strong>g> effects of<br />
corrosi<strong>on</strong> and wear of <str<strong>on</strong>g>the</str<strong>on</strong>g> rail and fastener systems,<br />
and degraded ties.” NTSB Member Higgins called <str<strong>on</strong>g>the</str<strong>on</strong>g><br />
incident a “wake up call…to all transit agencies…with<br />
equipment and infrastructure that ages with each<br />
passing day.”<br />
n Local Examples: Local agency analyses also<br />
highlight <str<strong>on</strong>g>the</str<strong>on</strong>g> need for significant capital reinvestment,
to address needs that remain unmet due to<br />
insufficient funding.<br />
§ New York City <strong>Transit</strong> (NYCT): NYCT has been<br />
working steadily since 1982 to bring <str<strong>on</strong>g>the</str<strong>on</strong>g> nati<strong>on</strong>’s<br />
largest and sec<strong>on</strong>d oldest rail transit system to a<br />
state of good repair, this following a period of<br />
underinvestment and decline. After making<br />
significant progress, this l<strong>on</strong>g-term major<br />
reinvestment program recently encountered a<br />
setback following <str<strong>on</strong>g>the</str<strong>on</strong>g> defeat of New York’s<br />
proposed c<strong>on</strong>gesti<strong>on</strong> pricing plan, a measure<br />
that would have yielded a significant porti<strong>on</strong> of<br />
funding to meet NYCT’s reinvestment and<br />
expansi<strong>on</strong> needs. Over <str<strong>on</strong>g>the</str<strong>on</strong>g> next twenty years,<br />
NYCT capital needs<br />
include roughly $20<br />
billi<strong>on</strong> in state of<br />
good repair (<strong>SGR</strong>)<br />
investments and an<br />
additi<strong>on</strong>al $2 billi<strong>on</strong><br />
in annual normal<br />
replacement (NR)<br />
investments.<br />
§ Massachusetts Bay Transportati<strong>on</strong> Authority<br />
(MBTA): Bost<strong>on</strong> MBTA estimates that it needs<br />
$620 milli<strong>on</strong> in annual capital investment to<br />
attain its assets in a state of good repair over<br />
<str<strong>on</strong>g>the</str<strong>on</strong>g> next twenty years. With <strong>on</strong>ly $470 milli<strong>on</strong> in<br />
anticipated annual funding, this leaves roughly<br />
$150 milli<strong>on</strong> in annual unfunded capital needs.<br />
The resulting investment backlog includes<br />
parking, maintenance shops, and fare<br />
equipment, as well as assets that serve fewer<br />
passengers (and hence a lower investment<br />
priority). Eliminating <str<strong>on</strong>g>the</str<strong>on</strong>g> existing backlog would<br />
help improve operating speeds and reliability,<br />
reduce operating costs and encourage new<br />
ridership.<br />
§ Washingt<strong>on</strong> Metropolitan Area <strong>Transit</strong> Authority<br />
(WMATA): WMATA, al<strong>on</strong>g with San Francisco’s<br />
Bay Area Rapid <strong>Transit</strong> (BART) and <str<strong>on</strong>g>the</str<strong>on</strong>g><br />
3<br />
Metropolitan Atlanta Rapid <strong>Transit</strong> Authority<br />
(MARTA), is representative of a group of larger<br />
operators with rail systems entering <str<strong>on</strong>g>the</str<strong>on</strong>g>ir first<br />
major rounds of capital reinvestment needs.<br />
Built over <str<strong>on</strong>g>the</str<strong>on</strong>g> past thirty years, many of<br />
WMATA’s rail assets are now entering “middle<br />
age,” leading to increasing recapitalizati<strong>on</strong><br />
needs. At <str<strong>on</strong>g>the</str<strong>on</strong>g> same time, <str<strong>on</strong>g>the</str<strong>on</strong>g> Washingt<strong>on</strong><br />
Metropolitan regi<strong>on</strong> c<strong>on</strong>tinues to grow, leading<br />
to tough choices between expansi<strong>on</strong> and<br />
reinvestment.<br />
r <str<strong>on</strong>g>Beginning</str<strong>on</strong>g> <str<strong>on</strong>g>the</str<strong>on</strong>g> <str<strong>on</strong>g>Dialogue</str<strong>on</strong>g><br />
Over <str<strong>on</strong>g>the</str<strong>on</strong>g> past several m<strong>on</strong>ths, FTA has taken some<br />
initial steps to focus attenti<strong>on</strong> <strong>on</strong> transit capital asset<br />
preservati<strong>on</strong> and renewal. Moving <str<strong>on</strong>g>the</str<strong>on</strong>g> industry<br />
towards an overall “state of good repair” is a key<br />
agency objective. C<strong>on</strong>sider <str<strong>on</strong>g>the</str<strong>on</strong>g> following:<br />
n What is a “state of good repair” (<strong>SGR</strong>) and how<br />
can we measure it?<br />
n What is <str<strong>on</strong>g>the</str<strong>on</strong>g> magnitude of <str<strong>on</strong>g>the</str<strong>on</strong>g> <strong>SGR</strong> investment<br />
backlog?<br />
n What is <str<strong>on</strong>g>the</str<strong>on</strong>g> gap between reinvestment needs<br />
and available resources?<br />
n What strategies are agencies using to address<br />
<strong>SGR</strong> needs?<br />
n How can FTA help?<br />
The answers to <str<strong>on</strong>g>the</str<strong>on</strong>g>se<br />
questi<strong>on</strong>s will impact how<br />
we think about and<br />
address state of good<br />
repair issues. Recent FTA<br />
initiatives have begun to<br />
address <str<strong>on</strong>g>the</str<strong>on</strong>g>se challenges.<br />
n <strong>SGR</strong> Workshop: In August 2008, FTA c<strong>on</strong>vened<br />
a two-day workshop with senior engineers and capital<br />
planning staff from 14 bus and rail agencies. The<br />
<strong>SGR</strong> Workshop provided local agency staff with an<br />
opportunity to discuss <str<strong>on</strong>g>the</str<strong>on</strong>g> magnitude of <str<strong>on</strong>g>the</str<strong>on</strong>g>ir <strong>SGR</strong>
<str<strong>on</strong>g>Beginning</str<strong>on</strong>g> <str<strong>on</strong>g>the</str<strong>on</strong>g> <str<strong>on</strong>g>Dialogue</str<strong>on</strong>g><br />
needs, potential strategies to address this problem,<br />
and <str<strong>on</strong>g>the</str<strong>on</strong>g> problem of limited resources. The discussi<strong>on</strong><br />
topics and findings from this workshop are provided<br />
at <str<strong>on</strong>g>the</str<strong>on</strong>g> end of this report. The <strong>SGR</strong> workshop<br />
represents <strong>on</strong>ly a first step in FTA’s plan to partner<br />
with <str<strong>on</strong>g>the</str<strong>on</strong>g> industry to jointly assess and address <str<strong>on</strong>g>the</str<strong>on</strong>g><br />
nati<strong>on</strong>’s transit recapitalizati<strong>on</strong> needs.<br />
n Rail Modernizati<strong>on</strong> Study: In resp<strong>on</strong>se to a<br />
December 7, 2007 letter from twelve U.S. Senators 1 ,<br />
and related language in <str<strong>on</strong>g>the</str<strong>on</strong>g> FY 2008 Transportati<strong>on</strong>-<br />
HUD Appropriati<strong>on</strong>s bill, FTA is c<strong>on</strong>ducting a Rail<br />
Modernizati<strong>on</strong> Study. This study will assess <str<strong>on</strong>g>the</str<strong>on</strong>g> level<br />
of investment required to bring <str<strong>on</strong>g>the</str<strong>on</strong>g> nati<strong>on</strong>’s largest<br />
rail transit systems to a state of good repair. The<br />
study will also c<strong>on</strong>sider <str<strong>on</strong>g>the</str<strong>on</strong>g> gap between<br />
reinvestment needs and historic funding levels, and<br />
potential changes to <str<strong>on</strong>g>the</str<strong>on</strong>g> existing Fixed Guideway<br />
Modernizati<strong>on</strong> funding formulas. The study will be<br />
submitted to C<strong>on</strong>gress in early 2009. Prior FTA rail<br />
modernizati<strong>on</strong> studies were completed in 1979 and in<br />
1987.<br />
n FTA <strong>SGR</strong> Working Group: FTA has established<br />
an internal working group that meets regularly to<br />
c<strong>on</strong>sider <strong>SGR</strong> related issues and to establish new<br />
initiatives.<br />
r Future Focus<br />
Bey<strong>on</strong>d <str<strong>on</strong>g>the</str<strong>on</strong>g>se first<br />
steps, FTA is<br />
c<strong>on</strong>sidering additi<strong>on</strong>al<br />
strategies to promote<br />
an understanding and<br />
awareness of nati<strong>on</strong>al<br />
transit recapitalizati<strong>on</strong><br />
and maintenance needs and potential soluti<strong>on</strong>s to<br />
address those needs.<br />
1 Senators signing <str<strong>on</strong>g>the</str<strong>on</strong>g> letter include: Richard Durbin, Barack Obama, Evan<br />
Bayh, Robert Casey, Hillary Clint<strong>on</strong>, Christopher Dodd, John Kerry, Edward<br />
Kennedy, Joe Lieberman, Robert Menendez, Charles Schumer, and Arlen<br />
Specter.<br />
4<br />
n <strong>SGR</strong> Roundtables and Advisory Groups: FTA<br />
currently c<strong>on</strong>ducts biannual “roundtables” with<br />
industry engineering professi<strong>on</strong>als to address<br />
comm<strong>on</strong> issues impacting <str<strong>on</strong>g>the</str<strong>on</strong>g> design and<br />
c<strong>on</strong>structi<strong>on</strong> of New Starts projects. FTA is<br />
c<strong>on</strong>sidering a similar roundtable program to address<br />
state of good repair issues. As with <str<strong>on</strong>g>the</str<strong>on</strong>g> existing<br />
C<strong>on</strong>structi<strong>on</strong> Roundtables, <str<strong>on</strong>g>the</str<strong>on</strong>g>se “<strong>SGR</strong> Roundtables”<br />
would include industry engineering and capital<br />
planning experts, with <str<strong>on</strong>g>the</str<strong>on</strong>g> objective of sharing<br />
approaches and soluti<strong>on</strong>s to comm<strong>on</strong> state of good<br />
repair problems. These roundtables would also help<br />
ensure that FTA’s strategies for attaining state of<br />
good repair accurately reflect real world reinvestment<br />
realities. The possibility of an <strong>SGR</strong> Roundtable<br />
received str<strong>on</strong>g support from <str<strong>on</strong>g>the</str<strong>on</strong>g> transit agency staff<br />
attending FTA’s recent <strong>SGR</strong> workshop.<br />
n Definiti<strong>on</strong> and Measurement of State of Good<br />
Repair: At present, <str<strong>on</strong>g>the</str<strong>on</strong>g>re is no industry accepted<br />
definiti<strong>on</strong> of “state of good repair.” In <str<strong>on</strong>g>the</str<strong>on</strong>g> absence of a<br />
clear definiti<strong>on</strong> and reliable measures, <strong>Federal</strong>, state<br />
and local decisi<strong>on</strong>-makers cannot easily establish an<br />
operati<strong>on</strong>al policy of attaining a state of good repair,<br />
determine what it will take to reach that objective or<br />
determine when (or if) that goal has been attained.<br />
FTA will work with <str<strong>on</strong>g>the</str<strong>on</strong>g> industry to help define what is<br />
meant by “state of good repair” and how best to<br />
measure it. The goal would not be to impose a<br />
comm<strong>on</strong> definiti<strong>on</strong> or measures <strong>on</strong> <str<strong>on</strong>g>the</str<strong>on</strong>g> industry but<br />
ra<str<strong>on</strong>g>the</str<strong>on</strong>g>r to find a comm<strong>on</strong> language to discuss <str<strong>on</strong>g>the</str<strong>on</strong>g><br />
problem.<br />
Asset management is a strategic capital<br />
planning process that supports well informed<br />
investment decisi<strong>on</strong>s based <strong>on</strong> good quality<br />
data and clear organizati<strong>on</strong>al objectives.<br />
n <strong>Transit</strong> Asset Management: In <str<strong>on</strong>g>the</str<strong>on</strong>g> early 1990s,<br />
<str<strong>on</strong>g>the</str<strong>on</strong>g> nati<strong>on</strong>’s highway industry initiated development of<br />
<str<strong>on</strong>g>the</str<strong>on</strong>g> country’s first transportati<strong>on</strong> asset management<br />
systems. Today, virtually all state DOTs possess well
developed asset management processes designed to<br />
actively m<strong>on</strong>itor current asset c<strong>on</strong>diti<strong>on</strong>s and<br />
evaluate reinvestment needs and tradeoffs. In<br />
c<strong>on</strong>trast, few U.S. transit operators possess asset<br />
management processes comparable to those in <str<strong>on</strong>g>the</str<strong>on</strong>g><br />
highway sector. FTA looks forward to working<br />
toge<str<strong>on</strong>g>the</str<strong>on</strong>g>r with <str<strong>on</strong>g>the</str<strong>on</strong>g> transit industry to jointly develop<br />
asset management approaches that serve our<br />
specific needs. Asset management can help<br />
agencies:<br />
§ Establish clear organizati<strong>on</strong>al <strong>SGR</strong> definiti<strong>on</strong>s<br />
and objectives;<br />
§ Assess <str<strong>on</strong>g>the</str<strong>on</strong>g> magnitude of <str<strong>on</strong>g>the</str<strong>on</strong>g> issue;<br />
§ Better coordinate agency planning, engineering<br />
and decisi<strong>on</strong>-making functi<strong>on</strong>s;<br />
§ Prioritize <str<strong>on</strong>g>the</str<strong>on</strong>g> use of scarce reinvestment funds.<br />
n “TERM Light”: FTA’s <strong>Transit</strong> Ec<strong>on</strong>omic<br />
Requirements Model (TERM) is an analysis tool<br />
designed to help evaluate l<strong>on</strong>g-term transit<br />
recapitalizati<strong>on</strong> needs. In development for more than<br />
a decade, TERM can estimate <str<strong>on</strong>g>the</str<strong>on</strong>g> level of capital<br />
investment required to attain a state of good repair<br />
(or o<str<strong>on</strong>g>the</str<strong>on</strong>g>r investment objective) and can also assess<br />
how variati<strong>on</strong>s in capital funding availability will likely<br />
impact <str<strong>on</strong>g>the</str<strong>on</strong>g> future c<strong>on</strong>diti<strong>on</strong> and performance of transit<br />
assets. FTA is exploring <str<strong>on</strong>g>the</str<strong>on</strong>g> development of a<br />
simplified versi<strong>on</strong> of TERM (or “TERM Light”) for use<br />
by local agency capital planning staff. In return, FTA<br />
5<br />
will seek local agency asset data and participati<strong>on</strong> in<br />
<str<strong>on</strong>g>the</str<strong>on</strong>g> <strong>on</strong>going improvement of this useful tool.<br />
n Nati<strong>on</strong>al <strong>Transit</strong> Asset Inventory: A<br />
prerequisite to effective, l<strong>on</strong>g-term transit capital<br />
reinvestment analysis – at ei<str<strong>on</strong>g>the</str<strong>on</strong>g>r <str<strong>on</strong>g>the</str<strong>on</strong>g> nati<strong>on</strong>al or local<br />
levels – is <str<strong>on</strong>g>the</str<strong>on</strong>g> availability of good quality asset<br />
inventory and c<strong>on</strong>diti<strong>on</strong> data. At present, <strong>on</strong>ly a<br />
handful of U.S. transit operators actively maintain<br />
transit asset inventories for capital planning purposes<br />
and <str<strong>on</strong>g>the</str<strong>on</strong>g>re is no <strong>Federal</strong> reporting <strong>on</strong> transit assets<br />
except vehicles. FTA is c<strong>on</strong>sidering expanding <str<strong>on</strong>g>the</str<strong>on</strong>g><br />
current Nati<strong>on</strong>al <strong>Transit</strong> Database (NTD) reporting<br />
requirements to include data <strong>on</strong> local agency asset<br />
inventory holdings and c<strong>on</strong>diti<strong>on</strong>s. This data will<br />
support TERM’s assessments of nati<strong>on</strong>al<br />
reinvestment needs and will be valuable to those<br />
agencies not currently collecting this data for <str<strong>on</strong>g>the</str<strong>on</strong>g>ir<br />
own needs assessment purposes.<br />
n Research and Technical Assistance: The <strong>SGR</strong><br />
Workshop identified several areas where FTA might<br />
provide research and technical assistance relating to<br />
state of good repair and asset management.<br />
Examples include:<br />
§ Asset Inventory Development: What are <str<strong>on</strong>g>the</str<strong>on</strong>g><br />
best practices in <str<strong>on</strong>g>the</str<strong>on</strong>g> development of asset<br />
inventories and how are o<str<strong>on</strong>g>the</str<strong>on</strong>g>r agencies applying<br />
<str<strong>on</strong>g>the</str<strong>on</strong>g>ir inventories?<br />
§ Linear Asset Management Tools: How are rail<br />
transit agencies utilizing “linear asset<br />
management tools” for <str<strong>on</strong>g>the</str<strong>on</strong>g> maintenance<br />
management and capital planning needs of <str<strong>on</strong>g>the</str<strong>on</strong>g>ir<br />
linear rail asset types (e.g., right of way, signals,<br />
track, tower, structures, etc.)?<br />
§ Maintenance Management Systems: How can<br />
agencies make better use of <str<strong>on</strong>g>the</str<strong>on</strong>g>ir existing<br />
maintenance management systems to address<br />
state of good repair issues?<br />
§ Innovative Financing: How can FTA support <str<strong>on</strong>g>the</str<strong>on</strong>g><br />
industry in developing and promoting <str<strong>on</strong>g>the</str<strong>on</strong>g> use of<br />
innovative financing methods specifically<br />
designed to support capital reinvestment?
<str<strong>on</strong>g>Beginning</str<strong>on</strong>g> <str<strong>on</strong>g>the</str<strong>on</strong>g> <str<strong>on</strong>g>Dialogue</str<strong>on</strong>g><br />
§ Less<strong>on</strong>s Learned and Best Practices: What are r Next Steps<br />
<str<strong>on</strong>g>the</str<strong>on</strong>g> best practices in asset management and<br />
state of good repair planning? In <str<strong>on</strong>g>the</str<strong>on</strong>g> coming m<strong>on</strong>ths, FTA will complete <str<strong>on</strong>g>the</str<strong>on</strong>g> Rail<br />
Modernizati<strong>on</strong> Study and o<str<strong>on</strong>g>the</str<strong>on</strong>g>r <strong>SGR</strong> related efforts<br />
designed to help inform <str<strong>on</strong>g>the</str<strong>on</strong>g> upcoming Surface<br />
Transportati<strong>on</strong> Reauthorizati<strong>on</strong>. Moving forward, FTA<br />
will c<strong>on</strong>tinue to promote<br />
attainment of industry-wide<br />
state of good repair as a key<br />
l<strong>on</strong>g-term objective. As we<br />
do so, we will work closely<br />
with <str<strong>on</strong>g>the</str<strong>on</strong>g> industry to better<br />
understand <str<strong>on</strong>g>the</str<strong>on</strong>g> problem and<br />
to develop effective strategies that preserve <str<strong>on</strong>g>the</str<strong>on</strong>g><br />
nati<strong>on</strong>’s transit capital assets and ensure safe and<br />
reliable transit service to <str<strong>on</strong>g>the</str<strong>on</strong>g> nati<strong>on</strong>’s riding public.<br />
6
FTA State of Good Repair Workshop<br />
Topics and Proceedings<br />
INTRODUCTION TO FTA STATE OF GOOD REPAIR WORKSHOP......................................................................8<br />
CURRENT CONDITIONS OF THE NATION’S TRANSIT INFRASTRUCTURE.....................................................11<br />
DEFINING AND MEASURING STATE OF GOOD REPAIR...................................................................................18<br />
TRANSIT ASSET MANAGEMENT..........................................................................................................................23<br />
STANDARDS FOR PREVENTIVE MAINTENANCE...............................................................................................31<br />
CORE CAPACITY OF A TRANSIT SYSTEM..........................................................................................................36<br />
ALTERNATIVE APPROACHES TO FINANCING...................................................................................................41<br />
RESEARCH NEEDS ................................................................................................................................................48<br />
7
FTA State of Good Repair Workshop<br />
r OVERVIEW<br />
Introducti<strong>on</strong> to FTA State of Good Repair Workshop<br />
On August 13, 2008, <str<strong>on</strong>g>the</str<strong>on</strong>g> <strong>Federal</strong> <strong>Transit</strong><br />
Administrati<strong>on</strong> (FTA) c<strong>on</strong>vened a two-day workshop<br />
to c<strong>on</strong>sider <str<strong>on</strong>g>the</str<strong>on</strong>g> state of good repair (<strong>SGR</strong>) needs of<br />
<str<strong>on</strong>g>the</str<strong>on</strong>g> nati<strong>on</strong>’s rail and bus transit rolling stock and<br />
infrastructure. Specific issues c<strong>on</strong>sidered by <str<strong>on</strong>g>the</str<strong>on</strong>g><br />
workshop included:<br />
n How should state of good repair be defined and<br />
measured?<br />
n What is <str<strong>on</strong>g>the</str<strong>on</strong>g> current c<strong>on</strong>diti<strong>on</strong> of <str<strong>on</strong>g>the</str<strong>on</strong>g> nati<strong>on</strong>’s<br />
transit capital assets?<br />
n What level of investment is required to attain<br />
<strong>SGR</strong>, and how does this compare with existing<br />
funding?<br />
n How are local agencies addressing <str<strong>on</strong>g>the</str<strong>on</strong>g>ir <strong>SGR</strong><br />
needs?<br />
n How can preventive maintenance, asset<br />
management and alternative financing<br />
approaches help agencies attain <strong>SGR</strong>?<br />
n What should <str<strong>on</strong>g>the</str<strong>on</strong>g> federal role in <strong>SGR</strong> be?<br />
The seven papers in this volume address each of<br />
<str<strong>on</strong>g>the</str<strong>on</strong>g>se questi<strong>on</strong>s, provide background <strong>on</strong> <str<strong>on</strong>g>the</str<strong>on</strong>g> current<br />
understanding of <str<strong>on</strong>g>the</str<strong>on</strong>g> underlying issues, and <str<strong>on</strong>g>the</str<strong>on</strong>g>n<br />
encourage <str<strong>on</strong>g>the</str<strong>on</strong>g> reader to c<strong>on</strong>sider alternate<br />
approaches or soluti<strong>on</strong>s to <str<strong>on</strong>g>the</str<strong>on</strong>g>se issues. Preliminary<br />
versi<strong>on</strong>s of each paper were provided to each<br />
workshop participant before <str<strong>on</strong>g>the</str<strong>on</strong>g> meeting date as<br />
preparati<strong>on</strong> for <str<strong>on</strong>g>the</str<strong>on</strong>g> workshop. The workshop <str<strong>on</strong>g>the</str<strong>on</strong>g>n<br />
included <strong>on</strong>e sessi<strong>on</strong> related to each of <str<strong>on</strong>g>the</str<strong>on</strong>g> seven<br />
topics.<br />
This report updates each of <str<strong>on</strong>g>the</str<strong>on</strong>g> seven papers and<br />
presents key observati<strong>on</strong>s from <str<strong>on</strong>g>the</str<strong>on</strong>g> <strong>SGR</strong> workshop.<br />
r BACKGROUND<br />
The <strong>SGR</strong> workshop and related FTA state of good<br />
repair initiatives (e.g., <str<strong>on</strong>g>the</str<strong>on</strong>g> Rail Modernizati<strong>on</strong> Study)<br />
8<br />
are motivated by a number of related events and<br />
c<strong>on</strong>cerns:<br />
n Several highly visible infrastructure failures have<br />
called into questi<strong>on</strong> <str<strong>on</strong>g>the</str<strong>on</strong>g> adequacy of <str<strong>on</strong>g>the</str<strong>on</strong>g><br />
maintenance of <str<strong>on</strong>g>the</str<strong>on</strong>g> nati<strong>on</strong>’s transportati<strong>on</strong><br />
infrastructure.<br />
n FTA seeks more accurate informati<strong>on</strong> c<strong>on</strong>cerning<br />
<str<strong>on</strong>g>the</str<strong>on</strong>g> scope and cost of maintaining <str<strong>on</strong>g>the</str<strong>on</strong>g> nati<strong>on</strong>’s<br />
transit capital assets in a state of good repair.<br />
n By law, FTA must examine its grantees’ ability to<br />
maintain <str<strong>on</strong>g>the</str<strong>on</strong>g>ir existing transit systems when<br />
making decisi<strong>on</strong>s to support new fixed guideway<br />
projects. FTA is c<strong>on</strong>cerned that some guideway<br />
modernizati<strong>on</strong> funds have been diverted to its<br />
New Starts program.<br />
n At <str<strong>on</strong>g>the</str<strong>on</strong>g> request of twelve U.S. Senators and <str<strong>on</strong>g>the</str<strong>on</strong>g><br />
FY2008 Transportati<strong>on</strong>-HUD Appropriati<strong>on</strong>s Bill,<br />
FTA is currently c<strong>on</strong>ducting a “Rail Modernizati<strong>on</strong><br />
Study” to assess <str<strong>on</strong>g>the</str<strong>on</strong>g> level of investment required<br />
to bring <str<strong>on</strong>g>the</str<strong>on</strong>g> assets of <str<strong>on</strong>g>the</str<strong>on</strong>g> nati<strong>on</strong>’s largest rail<br />
transit agencies to a state of good repair.<br />
Given <str<strong>on</strong>g>the</str<strong>on</strong>g>se events and c<strong>on</strong>cerns, key objectives of<br />
<str<strong>on</strong>g>the</str<strong>on</strong>g> <strong>SGR</strong> workshop were to (1) help assess <str<strong>on</strong>g>the</str<strong>on</strong>g> extent<br />
of <str<strong>on</strong>g>the</str<strong>on</strong>g> issue (e.g., what is <strong>SGR</strong>, how should <strong>SGR</strong><br />
needs be assessed, how are agencies currently<br />
addressing <str<strong>on</strong>g>the</str<strong>on</strong>g>se needs, etc.) and (2) obtain local<br />
agency input to FTA’s State of Good Repair initiative.<br />
r <strong>SGR</strong> WORKSHOP<br />
The objective of this workshop was to obtain local<br />
agency perspectives <strong>on</strong> a range of <strong>SGR</strong>-related<br />
issues currently of interest to FTA.<br />
Workshop Participants: The workshop participants<br />
included each of <str<strong>on</strong>g>the</str<strong>on</strong>g> agencies included in FTA’s Rail<br />
Modernizati<strong>on</strong> Study as well as representatives of<br />
smaller rail and bus agencies. Participants also<br />
included senior FTA staff – including Deputy
Administrator Sherry Little – and c<strong>on</strong>sultant staff<br />
supporting <str<strong>on</strong>g>the</str<strong>on</strong>g> workshop. A complete listing of <str<strong>on</strong>g>the</str<strong>on</strong>g><br />
transit agency workshop participants is found at <str<strong>on</strong>g>the</str<strong>on</strong>g><br />
end of this introducti<strong>on</strong>.<br />
Workshop Sessi<strong>on</strong>s: The <strong>SGR</strong> Workshop<br />
c<strong>on</strong>sisted of a series of moderated sessi<strong>on</strong>s, and<br />
opening and closing remarks by workshop<br />
participants. Each sessi<strong>on</strong> covered a different <strong>SGR</strong>related<br />
issue and each of <str<strong>on</strong>g>the</str<strong>on</strong>g> papers in this volume<br />
corresp<strong>on</strong>ds to <strong>on</strong>e of those sessi<strong>on</strong>s. Each sessi<strong>on</strong><br />
c<strong>on</strong>sisted of a brief overview of <str<strong>on</strong>g>the</str<strong>on</strong>g> topic area to be<br />
discussed (e.g., <str<strong>on</strong>g>the</str<strong>on</strong>g> applicati<strong>on</strong> of asset management<br />
to address <strong>SGR</strong> needs) followed by a questi<strong>on</strong> and<br />
answer period between <str<strong>on</strong>g>the</str<strong>on</strong>g> sessi<strong>on</strong> moderator and<br />
<str<strong>on</strong>g>the</str<strong>on</strong>g> sessi<strong>on</strong> participants. This process produced an<br />
improved understanding of how local agency staff are<br />
currently addressing each of <str<strong>on</strong>g>the</str<strong>on</strong>g> topic areas<br />
discussed.<br />
r TOPICS<br />
The seven papers presented here c<strong>on</strong>sider <str<strong>on</strong>g>the</str<strong>on</strong>g> topic<br />
areas for each of <str<strong>on</strong>g>the</str<strong>on</strong>g> seven primary sessi<strong>on</strong> areas of<br />
<str<strong>on</strong>g>the</str<strong>on</strong>g> <strong>SGR</strong> Workshop. These papers are not intended<br />
to provide final answers or policy directives, but<br />
ra<str<strong>on</strong>g>the</str<strong>on</strong>g>r to elicit thought and local agency perspectives<br />
<strong>on</strong> <str<strong>on</strong>g>the</str<strong>on</strong>g> part of workshop participants and provide<br />
useful background and understanding of <str<strong>on</strong>g>the</str<strong>on</strong>g> major<br />
state of good repair issues. Local agency and o<str<strong>on</strong>g>the</str<strong>on</strong>g>r<br />
transit industry participants should find <str<strong>on</strong>g>the</str<strong>on</strong>g>se papers<br />
helpful in identifying approaches and policies for<br />
addressing <str<strong>on</strong>g>the</str<strong>on</strong>g>ir own state of good repair needs.<br />
r KEY OBSERVATIONS<br />
The <strong>SGR</strong> Workshop yielded a number of<br />
observati<strong>on</strong>s and valuable perspectives with respect<br />
to state of good repair issues.<br />
n Funding Gap: Most agencies clearly indicated<br />
that existing funding was less than that required<br />
to meet current capital reinvestment needs.<br />
n Investment Prioritizati<strong>on</strong>: Agencies tend to<br />
favor reinvestment in some asset types versus<br />
o<str<strong>on</strong>g>the</str<strong>on</strong>g>rs. For example, “missi<strong>on</strong> critical” asset<br />
9<br />
types like vehicle fleets tend to receive <str<strong>on</strong>g>the</str<strong>on</strong>g><br />
highest priority, whereas “less critical” assets<br />
such as maintenance facilities and stati<strong>on</strong><br />
amenities tend to receive lower prioritizati<strong>on</strong>.<br />
n Betterments and Standards Requirements:<br />
Few assets are replaced “in-kind.” Ra<str<strong>on</strong>g>the</str<strong>on</strong>g>r, most<br />
replacement activities include some form of<br />
quality, technology, or safety improvement or<br />
mandated improvements such as those related to<br />
ADA requirements. For this reas<strong>on</strong>, replacement<br />
costs are not “comparable” to, and generally<br />
higher than, <str<strong>on</strong>g>the</str<strong>on</strong>g> replaced asset’s initial purchase<br />
cost.<br />
n Preventive Maintenance (PM) Practices: Good<br />
quality PM programs can c<strong>on</strong>tribute to increasing<br />
asset l<strong>on</strong>gevity and service reliability as well as<br />
overall state of good repair.<br />
n Measurement of <strong>SGR</strong>: Physical asset c<strong>on</strong>diti<strong>on</strong><br />
assessment is <str<strong>on</strong>g>the</str<strong>on</strong>g> best way to measure <strong>SGR</strong> for<br />
individual assets and <strong>on</strong> an agency-wide basis.<br />
Asset age is a sec<strong>on</strong>d-best proxy, since it is<br />
highly variable based <strong>on</strong> asset utilizati<strong>on</strong>,<br />
envir<strong>on</strong>ment, quality of manufacture and o<str<strong>on</strong>g>the</str<strong>on</strong>g>r<br />
factors.<br />
n Data: Agencies that have collected and<br />
maintained detailed inventories of <str<strong>on</strong>g>the</str<strong>on</strong>g>ir transit<br />
assets have benefited from a clearer<br />
understanding of <str<strong>on</strong>g>the</str<strong>on</strong>g>ir l<strong>on</strong>g-term capital<br />
reinvestment needs. FTA would also benefit from<br />
a reporting process <strong>on</strong> <str<strong>on</strong>g>the</str<strong>on</strong>g> age and c<strong>on</strong>diti<strong>on</strong> of<br />
<str<strong>on</strong>g>the</str<strong>on</strong>g> nati<strong>on</strong>’s inventory of transit assets.<br />
n <strong>SGR</strong> Research: The transit industry would<br />
benefit from nati<strong>on</strong>al-level research <strong>on</strong> <strong>SGR</strong>related<br />
issues such as new materials, preventive<br />
maintenance practices and best practices in<br />
asset management.
FTA State of Good Repair Workshop<br />
r QUESTIONS<br />
At <str<strong>on</strong>g>the</str<strong>on</strong>g> opening and closing of <str<strong>on</strong>g>the</str<strong>on</strong>g> workshop, FTA<br />
Deputy Administrator Sherry Little posed <str<strong>on</strong>g>the</str<strong>on</strong>g><br />
following key questi<strong>on</strong>s for <str<strong>on</strong>g>the</str<strong>on</strong>g> industry to c<strong>on</strong>sider<br />
with respect to state of good repair:<br />
n What should <str<strong>on</strong>g>the</str<strong>on</strong>g> <strong>Federal</strong> role in <strong>SGR</strong> be? Setting<br />
standards or sharing best practices?<br />
n If FTA combined all grant programs into <strong>on</strong>e<br />
flexible block grant, how would your agency use<br />
this m<strong>on</strong>ey, assuming <str<strong>on</strong>g>the</str<strong>on</strong>g>re are no set rules for<br />
its expenditure?<br />
n How would you bring your system to a <strong>SGR</strong> if<br />
you have limited additi<strong>on</strong>al resources?<br />
n How can we generate political support for <strong>SGR</strong><br />
activities? Can FTA help make fix-it-first as<br />
politically appealing as ribb<strong>on</strong>-cutting for a new<br />
service?<br />
Moving forward, FTA will c<strong>on</strong>tinue to pursue answers<br />
to <str<strong>on</strong>g>the</str<strong>on</strong>g>se questi<strong>on</strong>s through future workshops with<br />
industry representatives and related initiatives.<br />
r APPENDIX: <strong>SGR</strong> WORKSHOP<br />
PARTICIPANTS<br />
As noted above, <str<strong>on</strong>g>the</str<strong>on</strong>g> workshop participants included<br />
each of <str<strong>on</strong>g>the</str<strong>on</strong>g> agencies in FTA’s Rail Modernizati<strong>on</strong><br />
Study as well as representatives of smaller rail and<br />
bus agencies. Participants also included FTA staff<br />
and c<strong>on</strong>sultant staff supporting <str<strong>on</strong>g>the</str<strong>on</strong>g> workshop. <strong>Transit</strong><br />
agency participants included:<br />
<strong>Transit</strong> Agency Attendees (alphabetical order)<br />
Name Title Agency<br />
Vicki Barr<strong>on</strong><br />
Director, Project<br />
Delivery<br />
Portland Tri-<br />
Met<br />
Michael Chubak<br />
Executive Vice<br />
President<br />
Manager, Capital<br />
New York<br />
NYCT<br />
Michael C<strong>on</strong>nelly Improvement Program<br />
Development<br />
Chicago CTA<br />
David Couch<br />
Director, Infrastructure<br />
Renewal Projects<br />
Washingt<strong>on</strong><br />
WMATA<br />
Michael Davis<br />
Director, Metro<br />
Operati<strong>on</strong>s<br />
Maryland MTA<br />
Peter Garino<br />
Director, Strategic<br />
Policy Initiatives<br />
New Jersey<br />
NJT<br />
Richard Jarrold<br />
Director, System<br />
Development &<br />
Engineering<br />
Assistant GM,<br />
Kansas City<br />
KCATA<br />
Jeffrey Knueppel<br />
Engineering,<br />
Maintenance &<br />
C<strong>on</strong>structi<strong>on</strong><br />
Philadelphia<br />
SEPTA<br />
John Lewis<br />
Deputy Chief Operating<br />
Officer<br />
Bost<strong>on</strong> MBTA<br />
Denise L<strong>on</strong>gley<br />
DEO, Strategic<br />
Development, Facilities<br />
& Operati<strong>on</strong>s<br />
Los Angeles<br />
MTA<br />
Gregg Marrama<br />
Department Manager,<br />
Capital Programs<br />
San Francisco<br />
BART<br />
Charlie Passanisi<br />
Deputy Director,<br />
Capital Budget<br />
Bost<strong>on</strong> MBTA<br />
Barbara Reese<br />
Deputy Secretary of<br />
Transportati<strong>on</strong><br />
Senior Director,<br />
Virginia DOT<br />
Carter R. Rohan<br />
Transportati<strong>on</strong><br />
Planning &<br />
Development<br />
San Francisco<br />
MTA<br />
James Zingale Deputy Director<br />
Charlotte<br />
CATS<br />
10
C<strong>on</strong>diti<strong>on</strong>s of <strong>Transit</strong> Infrastructure<br />
r OVERVIEW<br />
Current C<strong>on</strong>diti<strong>on</strong>s of <str<strong>on</strong>g>the</str<strong>on</strong>g> Nati<strong>on</strong>’s <strong>Transit</strong> Infrastructure<br />
FTA State of Good Repair Workshop<br />
Despite <strong>on</strong>going reinvestment, much of <str<strong>on</strong>g>the</str<strong>on</strong>g> nati<strong>on</strong>’s<br />
capital assets c<strong>on</strong>tinue to deteriorate, and current<br />
capital reinvestment rates appear insufficient to<br />
reverse <str<strong>on</strong>g>the</str<strong>on</strong>g> decline. Decaying transit capital assets<br />
raise c<strong>on</strong>cerns for service reliability and rider safety.<br />
FTA and its state and local funding partners have a<br />
mutual interest in understanding <str<strong>on</strong>g>the</str<strong>on</strong>g> extent of <str<strong>on</strong>g>the</str<strong>on</strong>g><br />
problem and <str<strong>on</strong>g>the</str<strong>on</strong>g> ability of existing funding resources<br />
to address <str<strong>on</strong>g>the</str<strong>on</strong>g> issue. This paper c<strong>on</strong>siders <str<strong>on</strong>g>the</str<strong>on</strong>g><br />
current c<strong>on</strong>diti<strong>on</strong> and capital reinvestment needs of<br />
<str<strong>on</strong>g>the</str<strong>on</strong>g> nati<strong>on</strong>’s bus and rail transit capital assets:<br />
n What is <str<strong>on</strong>g>the</str<strong>on</strong>g> current physical and service<br />
c<strong>on</strong>diti<strong>on</strong> of <str<strong>on</strong>g>the</str<strong>on</strong>g> nati<strong>on</strong>’s transit assets and how<br />
do <str<strong>on</strong>g>the</str<strong>on</strong>g>se c<strong>on</strong>diti<strong>on</strong>s compare to an “ideal state of<br />
good repair”?<br />
n What is <str<strong>on</strong>g>the</str<strong>on</strong>g> current investment backlog and what<br />
level of investment would be required to attain a<br />
state of good repair?<br />
n How are unmet reinvestment needs affecting<br />
service quality and maintenance needs?<br />
To explore <str<strong>on</strong>g>the</str<strong>on</strong>g>se questi<strong>on</strong>s, this paper reviews<br />
industry sources including local agency capital plans,<br />
industry studies, and FTA’s own analyses. The<br />
issues c<strong>on</strong>sidered here are central to <str<strong>on</strong>g>the</str<strong>on</strong>g> workshop<br />
objectives of defining, measuring and addressing <str<strong>on</strong>g>the</str<strong>on</strong>g><br />
nati<strong>on</strong>’s transit state of good repair needs.<br />
r BACKGROUND<br />
Developing a clear understanding of <str<strong>on</strong>g>the</str<strong>on</strong>g> overall<br />
c<strong>on</strong>diti<strong>on</strong> of <str<strong>on</strong>g>the</str<strong>on</strong>g> nati<strong>on</strong>’s transit assets – and <str<strong>on</strong>g>the</str<strong>on</strong>g><br />
impact of those c<strong>on</strong>diti<strong>on</strong>s <strong>on</strong> service performance<br />
and investment needs – is complicated by <str<strong>on</strong>g>the</str<strong>on</strong>g><br />
scarcity of reliable and c<strong>on</strong>sistent informati<strong>on</strong><br />
sources. As a means of describing overall needs,<br />
this paper will rely <strong>on</strong> <str<strong>on</strong>g>the</str<strong>on</strong>g> following two sources:<br />
11<br />
n <strong>Federal</strong> Analyses – including FTA analyses as<br />
published in <str<strong>on</strong>g>the</str<strong>on</strong>g> biennial C<strong>on</strong>diti<strong>on</strong> and<br />
Performance <str<strong>on</strong>g>Report</str<strong>on</strong>g> to C<strong>on</strong>gress<br />
n Local Agency <str<strong>on</strong>g>Report</str<strong>on</strong>g>s – including Capital<br />
Improvement Programs (CIPs) and 10- and 20year<br />
plans<br />
This discussi<strong>on</strong> makes it clear that a significant<br />
proporti<strong>on</strong> of <str<strong>on</strong>g>the</str<strong>on</strong>g> nati<strong>on</strong>’s transit assets are past <str<strong>on</strong>g>the</str<strong>on</strong>g>ir<br />
useful life. In additi<strong>on</strong>, current expenditures <strong>on</strong><br />
capital reinvestment are insufficient to address this<br />
backlog, and may not be sufficient to maintain current<br />
c<strong>on</strong>diti<strong>on</strong>s.<br />
Moreover, this review observes that a complete<br />
understanding of nati<strong>on</strong>al transit asset c<strong>on</strong>diti<strong>on</strong>s is<br />
hampered by <str<strong>on</strong>g>the</str<strong>on</strong>g> scarcity of reliable data sources and<br />
<str<strong>on</strong>g>the</str<strong>on</strong>g> broad range of assumpti<strong>on</strong>s used by local<br />
agencies in assessing <str<strong>on</strong>g>the</str<strong>on</strong>g>ir own needs (including<br />
differences in useful lives, and rehabilitati<strong>on</strong> and<br />
preventive maintenance practices). Toge<str<strong>on</strong>g>the</str<strong>on</strong>g>r, <str<strong>on</strong>g>the</str<strong>on</strong>g>se<br />
factors suggest <str<strong>on</strong>g>the</str<strong>on</strong>g> need to develop better, more<br />
reliable nati<strong>on</strong>al-level informati<strong>on</strong> sources and, where<br />
appropriate, to better define industry standards for<br />
useful life and preventive maintenance.<br />
r ASSESSMENT OF NATIONAL<br />
CONDITIONS<br />
Every two years, <str<strong>on</strong>g>the</str<strong>on</strong>g> FTA and <strong>Federal</strong> Highway<br />
Administrati<strong>on</strong> (FHWA) jointly issue a report to <str<strong>on</strong>g>the</str<strong>on</strong>g><br />
U.S. C<strong>on</strong>gress <strong>on</strong> <str<strong>on</strong>g>the</str<strong>on</strong>g> C<strong>on</strong>diti<strong>on</strong> and Performance of<br />
<str<strong>on</strong>g>the</str<strong>on</strong>g> nati<strong>on</strong>’s surface transportati<strong>on</strong> capital assets<br />
(known as <str<strong>on</strong>g>the</str<strong>on</strong>g> “C&P <str<strong>on</strong>g>Report</str<strong>on</strong>g>”). The C&P <str<strong>on</strong>g>Report</str<strong>on</strong>g><br />
provides a comprehensive assessment of <str<strong>on</strong>g>the</str<strong>on</strong>g><br />
physical c<strong>on</strong>diti<strong>on</strong> and reinvestment needs for all<br />
public transportati<strong>on</strong> capital assets nati<strong>on</strong>wide. For<br />
transit assets, this assessment is developed based<br />
<strong>on</strong> output from FTA’s <strong>Transit</strong> Ec<strong>on</strong>omic<br />
Requirements Model (TERM), a federal-level needs<br />
assessment decisi<strong>on</strong> support tool. In turn, TERM
C<strong>on</strong>diti<strong>on</strong>s of <strong>Transit</strong> Infrastructure<br />
relies <strong>on</strong> data reported to FTA through <str<strong>on</strong>g>the</str<strong>on</strong>g> Nati<strong>on</strong>al<br />
<strong>Transit</strong> Database (NTD) and also through special<br />
asset inventory data requests to large rail and bus<br />
operators.<br />
Asset C<strong>on</strong>diti<strong>on</strong>s: FTA’s TERM model uses a<br />
detailed asset inventory al<strong>on</strong>g with a set of<br />
empirically derived asset decay curves and a detailed<br />
listing of <str<strong>on</strong>g>the</str<strong>on</strong>g> nati<strong>on</strong>’s transit assets to estimate <str<strong>on</strong>g>the</str<strong>on</strong>g><br />
current physical c<strong>on</strong>diti<strong>on</strong> of <str<strong>on</strong>g>the</str<strong>on</strong>g> nati<strong>on</strong>’s bus and rail<br />
transit capital assets2 . The charts below provide<br />
TERM’s current assessment (as of 2006) of <str<strong>on</strong>g>the</str<strong>on</strong>g><br />
distributi<strong>on</strong> of transit asset c<strong>on</strong>diti<strong>on</strong>s nati<strong>on</strong>wide: <str<strong>on</strong>g>the</str<strong>on</strong>g><br />
first based <strong>on</strong> mode and <str<strong>on</strong>g>the</str<strong>on</strong>g> sec<strong>on</strong>d by asset type<br />
(for heavy rail and bus <strong>on</strong>ly). The table below<br />
outlines <str<strong>on</strong>g>the</str<strong>on</strong>g> asset c<strong>on</strong>diti<strong>on</strong> ratings used by TERM.<br />
TERM C<strong>on</strong>diti<strong>on</strong> Ratings<br />
C<strong>on</strong>diti<strong>on</strong> Descripti<strong>on</strong><br />
New or like new asset; no visible<br />
Excellent<br />
defects<br />
Asset showing minimal signs of wear;<br />
Good some (slightly) defective or deteriorated<br />
comp<strong>on</strong>ent(s)<br />
Asset has reached its mid-life; some<br />
Adequate moderately defective or deteriorated<br />
comp<strong>on</strong>ent(s)<br />
Asset reaching or just past its useful<br />
<str<strong>on</strong>g>the</str<strong>on</strong>g>se c<strong>on</strong>diti<strong>on</strong> groupings is lower for light and<br />
commuter rail, but this should not be too surprising<br />
given <str<strong>on</strong>g>the</str<strong>on</strong>g> level of new investment in light rail and <str<strong>on</strong>g>the</str<strong>on</strong>g><br />
expansi<strong>on</strong> of commuter rail systems over <str<strong>on</strong>g>the</str<strong>on</strong>g> past<br />
two decades.<br />
Replacement Value (Billi<strong>on</strong>s of $2006) Replacement Value (Billi<strong>on</strong>s of $2006) Replacement Value (Billi<strong>on</strong>s of $2006)<br />
$200<br />
$180<br />
$160<br />
$140<br />
$120<br />
$100<br />
$80<br />
$60<br />
$40<br />
$20<br />
$0<br />
Marginal life; increasing number of deteriorated $30.0<br />
comp<strong>on</strong>ents<br />
Asset past its useful life; in need of<br />
Poor replacement; may have critically<br />
damaged comp<strong>on</strong>ent(s)<br />
Based <strong>on</strong> TERM’s assessment, a significant<br />
proporti<strong>on</strong> (up to <strong>on</strong>e-third) of heavy rail and motor<br />
bus assets have ei<str<strong>on</strong>g>the</str<strong>on</strong>g>r exceeded or are close to <str<strong>on</strong>g>the</str<strong>on</strong>g><br />
end of <str<strong>on</strong>g>the</str<strong>on</strong>g>ir useful lives. The proporti<strong>on</strong> of assets in<br />
Distributi<strong>on</strong> of <strong>Transit</strong> Asset C<strong>on</strong>diti<strong>on</strong>s: By Mode<br />
Excellent<br />
Good<br />
Adequate<br />
Marginal<br />
Poor<br />
Heavy Rail Commuter Light Rail Motor Bus<br />
Rail<br />
Distributi<strong>on</strong> of Asset C<strong>on</strong>diti<strong>on</strong>s: Heavy Rail<br />
$80.0<br />
Excellent<br />
$70.0<br />
Good<br />
Adequate<br />
$60.0<br />
Marginal<br />
$50.0<br />
Poor<br />
$40.0<br />
$30.0<br />
$20.0<br />
$10.0<br />
$0.0<br />
$25.0<br />
$20.0<br />
$15.0<br />
$10.0<br />
$5.0<br />
$0.0<br />
Guideway Facilities Stati<strong>on</strong>s Systems Vehicles<br />
Elements<br />
Distributi<strong>on</strong> of Asset C<strong>on</strong>diti<strong>on</strong>s: Motor Bus<br />
Excellent<br />
Good<br />
Adequate<br />
Marginal<br />
Poor<br />
Guideway<br />
Elements<br />
Facilities Stati<strong>on</strong>s Systems Vehicles<br />
2 The data used to develop TERM’s asset decay curves were obtained<br />
from <strong>on</strong>-site inspecti<strong>on</strong>s of hundreds of bus and rail transit vehicles,<br />
maintenance facilities, stati<strong>on</strong>s, and train c<strong>on</strong>trol, tracti<strong>on</strong> power and<br />
communicati<strong>on</strong>s systems at over fifty different rail and bus agencies.<br />
Within heavy rail, TERM has identified stati<strong>on</strong>s<br />
(primarily subway stati<strong>on</strong>s) and vehicles as <str<strong>on</strong>g>the</str<strong>on</strong>g> asset<br />
types with <str<strong>on</strong>g>the</str<strong>on</strong>g> greatest proporti<strong>on</strong> of assets near or<br />
Data for <str<strong>on</strong>g>the</str<strong>on</strong>g> trackwork and structures decay curves were obtained from<br />
select local agency c<strong>on</strong>diti<strong>on</strong> assessments.<br />
past <str<strong>on</strong>g>the</str<strong>on</strong>g>ir expected useful life. Similarly, for bus <str<strong>on</strong>g>the</str<strong>on</strong>g><br />
12
maintenance facilities and revenue vehicles have <str<strong>on</strong>g>the</str<strong>on</strong>g><br />
greatest proporti<strong>on</strong> of assets in <str<strong>on</strong>g>the</str<strong>on</strong>g> lowest c<strong>on</strong>diti<strong>on</strong>.<br />
Billi<strong>on</strong>s of $2006<br />
$4.5<br />
$4.0<br />
$3.5<br />
$3.0<br />
$2.5<br />
$2.0<br />
$1.5<br />
$1.0<br />
$0.5<br />
$0.0<br />
Annual Reinvestment Needs: By Mode<br />
Vehicles<br />
Stati<strong>on</strong>s<br />
Systems<br />
Facilities<br />
Guideway<br />
Heavy Rail Commuter Light Rail Motor Bus<br />
Rail<br />
Reinvestment Needs: In additi<strong>on</strong> to assessing<br />
current c<strong>on</strong>diti<strong>on</strong>s, TERM also generates estimates<br />
of average annual investment needs for <str<strong>on</strong>g>the</str<strong>on</strong>g> next<br />
twenty year period as required to attain a “state of<br />
good repair”. 3 These needs estimates (by mode and<br />
asset type) are presented in <str<strong>on</strong>g>the</str<strong>on</strong>g> chart above. As<br />
should be expected from <str<strong>on</strong>g>the</str<strong>on</strong>g> preceding c<strong>on</strong>diti<strong>on</strong><br />
assessment discussi<strong>on</strong>, <str<strong>on</strong>g>the</str<strong>on</strong>g> estimated needs are<br />
greatest for heavy rail and motor bus and within<br />
<str<strong>on</strong>g>the</str<strong>on</strong>g>se two modes, needs are highest for vehicles.<br />
After vehicles, annual reinvestment needs are<br />
highest, and roughly equal for heavy rail stati<strong>on</strong>s,<br />
systems and guideway comp<strong>on</strong>ents (track and<br />
structures) and for bus maintenance facilities.<br />
Estimated total needs to attain a state of good repair<br />
for <str<strong>on</strong>g>the</str<strong>on</strong>g>se three modes (but excluding paratransit,<br />
ferry, van pool and o<str<strong>on</strong>g>the</str<strong>on</strong>g>r modes) is roughly $9.0<br />
billi<strong>on</strong> annually from all sources for <str<strong>on</strong>g>the</str<strong>on</strong>g> next twenty<br />
years. 4 When all transit modes are included, <str<strong>on</strong>g>the</str<strong>on</strong>g><br />
average annual needs estimate increases to $10.7<br />
billi<strong>on</strong> from all sources. Both amounts exceed <str<strong>on</strong>g>the</str<strong>on</strong>g><br />
roughly $8.6 billi<strong>on</strong> in annual capital reinvestment<br />
expenditures from all sources observed in 2006.<br />
3 For this TERM analysis, a “state of good repair” is defined as having<br />
replaced all assets exceeding <str<strong>on</strong>g>the</str<strong>on</strong>g>ir useful life over <str<strong>on</strong>g>the</str<strong>on</strong>g> twenty-year<br />
period covered by <str<strong>on</strong>g>the</str<strong>on</strong>g> model analysis.<br />
4 All investment needs identified by TERM are required to pass TERM’s<br />
benefit-cost test before being included in <str<strong>on</strong>g>the</str<strong>on</strong>g> model’s tally of nati<strong>on</strong>al<br />
investment needs (as required by OMB). Hence, <str<strong>on</strong>g>the</str<strong>on</strong>g> numbers reported<br />
here <strong>on</strong>ly include <str<strong>on</strong>g>the</str<strong>on</strong>g> needs for those investments that pass this<br />
benefit-cost test.<br />
13<br />
r AGENCY ASSESSMENTS<br />
While most transit operators regularly develop Capital<br />
Improvement Plans (CIPs) to determine how existing<br />
capital funding will be spent, relatively few publish<br />
estimates of unc<strong>on</strong>strained needs and fewer still<br />
c<strong>on</strong>duct comprehensive assessments of current<br />
c<strong>on</strong>diti<strong>on</strong>s. Never<str<strong>on</strong>g>the</str<strong>on</strong>g>less, most agency practices are<br />
c<strong>on</strong>sistent in <str<strong>on</strong>g>the</str<strong>on</strong>g>ir emphasis <strong>on</strong> facilities, signals, and<br />
stati<strong>on</strong>s, and <str<strong>on</strong>g>the</str<strong>on</strong>g>ir c<strong>on</strong>clusi<strong>on</strong> that infrastructure<br />
needs exceed available funds.<br />
Asset C<strong>on</strong>diti<strong>on</strong>s: The table <strong>on</strong> <str<strong>on</strong>g>the</str<strong>on</strong>g> following page<br />
presents agency estimates of <str<strong>on</strong>g>the</str<strong>on</strong>g> proporti<strong>on</strong> of assets<br />
exceeding <str<strong>on</strong>g>the</str<strong>on</strong>g>ir useful life based <strong>on</strong> analyses at New<br />
York City <strong>Transit</strong> (NYCT) and <str<strong>on</strong>g>the</str<strong>on</strong>g> Massachusetts Bay<br />
Transportati<strong>on</strong> Authority (MBTA). 5 The table also<br />
presents TERM’s estimates of overage vehicles for<br />
comparis<strong>on</strong> purposes for <str<strong>on</strong>g>the</str<strong>on</strong>g> entire country. With a<br />
few minor excepti<strong>on</strong>s, <str<strong>on</strong>g>the</str<strong>on</strong>g> proporti<strong>on</strong>s of assets<br />
estimated to exceed <str<strong>on</strong>g>the</str<strong>on</strong>g>ir useful lives is roughly<br />
comparable for <str<strong>on</strong>g>the</str<strong>on</strong>g>se two mature rail agencies and<br />
for <str<strong>on</strong>g>the</str<strong>on</strong>g> industry as a whole (based <strong>on</strong> TERM’s<br />
estimates). Based <strong>on</strong> this limited sample analysis,<br />
<str<strong>on</strong>g>the</str<strong>on</strong>g> data suggest that stati<strong>on</strong>s and rail signal systems<br />
have <str<strong>on</strong>g>the</str<strong>on</strong>g> largest proporti<strong>on</strong> of assets exceeding <str<strong>on</strong>g>the</str<strong>on</strong>g>ir<br />
useful life (<str<strong>on</strong>g>the</str<strong>on</strong>g> latter driven in part by technological<br />
obsolescence). Rail yards and shops also appear to<br />
have a relatively high proporti<strong>on</strong> of overage assets.<br />
The significant difference between <str<strong>on</strong>g>the</str<strong>on</strong>g> TERM<br />
estimates of <str<strong>on</strong>g>the</str<strong>on</strong>g> share of overage revenue vehicles<br />
and <str<strong>on</strong>g>the</str<strong>on</strong>g> agency shares likely represents differences<br />
in assumed useful life – TERM assumes <str<strong>on</strong>g>the</str<strong>on</strong>g> FTA<br />
minimum while agencies generally assume a l<strong>on</strong>ger<br />
expected life (e.g., <str<strong>on</strong>g>the</str<strong>on</strong>g> FTA minimums are 12 years<br />
for 40-foot buses and 25 years for rail vehicles;<br />
MBTA assumes 15 years for buses and 35 years for<br />
rail vehicles).<br />
5 The data presented here were derived from NYCT’s Twenty Year<br />
Needs Assessment 2005-2024 and MBTA’s State of Good Repair<br />
<str<strong>on</strong>g>Report</str<strong>on</strong>g>: 2006 Editi<strong>on</strong>.
C<strong>on</strong>diti<strong>on</strong>s of <strong>Transit</strong> Infrastructure<br />
Percent of Assets Exceeding Their Useful Life<br />
Asset Type NYCT MBTA TERM<br />
Guideway Elements<br />
(2005) (2006) (2006)<br />
Structures 10% 15% 5%<br />
Trackwork<br />
Facilities<br />
0% 0% 5%<br />
10%<br />
Bus 10% 10% 20%<br />
Rail (Yards &<br />
Shops)<br />
Systems<br />
20% 20% 15%<br />
Signals 25% 30% 30%<br />
Power 10% 10% 5%<br />
Communicati<strong>on</strong>s 0% 40% 20%<br />
Elevators/<br />
0% 25% 15%<br />
Escalators<br />
Stati<strong>on</strong>s 55% 30% 20%<br />
Revenue Vehicles > 5% > 5% 25%<br />
Reinvestment Needs: The table at right presents<br />
agency estimates of <str<strong>on</strong>g>the</str<strong>on</strong>g> level of annual capital<br />
investment as required to address outstanding capital<br />
reinvestment needs for a sample of rail transit<br />
operators, including <str<strong>on</strong>g>the</str<strong>on</strong>g> Bay Area Rapid <strong>Transit</strong><br />
(BART), <str<strong>on</strong>g>the</str<strong>on</strong>g> Chicago <strong>Transit</strong> Authority (CTA), NYCT<br />
and MBTA. 6 The table also shows <str<strong>on</strong>g>the</str<strong>on</strong>g> assumed time<br />
period to address <str<strong>on</strong>g>the</str<strong>on</strong>g> outstanding needs, which<br />
varies significantly across operators, as well as each<br />
agency’s expected (or recent) funding levels and <str<strong>on</strong>g>the</str<strong>on</strong>g><br />
gap between expected funding and unc<strong>on</strong>strained<br />
needs. Finally, <str<strong>on</strong>g>the</str<strong>on</strong>g> table also presents TERM’s<br />
nati<strong>on</strong>al level estimates.<br />
It is clear that unc<strong>on</strong>strained needs (i.e., <str<strong>on</strong>g>the</str<strong>on</strong>g> level of<br />
expenditures required to address both deferred<br />
investments and normal replacements) over various<br />
time periods is less than expected funding levels.<br />
This finding implies that <str<strong>on</strong>g>the</str<strong>on</strong>g> c<strong>on</strong>diti<strong>on</strong> of <str<strong>on</strong>g>the</str<strong>on</strong>g> nati<strong>on</strong>’s<br />
transit assets is likely to decline in <str<strong>on</strong>g>the</str<strong>on</strong>g> absence of<br />
new funding capacity.<br />
6 The data presented here were derived from BART’s FY08 Short<br />
Range <strong>Transit</strong> Plan and Capital Improvement Program, CTA’s 2007<br />
Unfunded Capital Needs, NYCT’s Twenty Year Needs Assessment<br />
2005-2024 and MBTA’s State of Good Repair <str<strong>on</strong>g>Report</str<strong>on</strong>g>: 2006 Editi<strong>on</strong>.<br />
14<br />
Annual Unc<strong>on</strong>strained Needs* vs. Expected<br />
Funding* ($Milli<strong>on</strong>s)<br />
Agency Average Time Expected<br />
Annual Period Annual<br />
Needs (yrs) Funding Gap<br />
BART $386 25 $151 $235<br />
CTA $1,536 5 $376 $1,160<br />
MBTA $620 20 $470 $150<br />
NYCT $2,406 20 $2,162 $244<br />
* Excludes expansi<strong>on</strong> investments<br />
r IMPACT ON PERFORMANCE<br />
The analysis referenced has c<strong>on</strong>sidered <str<strong>on</strong>g>the</str<strong>on</strong>g> current<br />
c<strong>on</strong>diti<strong>on</strong> of <str<strong>on</strong>g>the</str<strong>on</strong>g> nati<strong>on</strong>’s transit assets and estimates<br />
of <str<strong>on</strong>g>the</str<strong>on</strong>g> level of investment required to address both<br />
outstanding and normal replacement needs. The<br />
questi<strong>on</strong> remains, <str<strong>on</strong>g>the</str<strong>on</strong>g>n, as to how current transit<br />
c<strong>on</strong>diti<strong>on</strong>s are impacting service performance (e.g.,<br />
service reliability, mean time/distance between<br />
failures, track operating speeds)? Similarly, how<br />
would attaining a state of good repair improve service<br />
performance and/or reduce operating and<br />
maintenance costs? This secti<strong>on</strong> c<strong>on</strong>siders <str<strong>on</strong>g>the</str<strong>on</strong>g><br />
known relati<strong>on</strong>ships between transit c<strong>on</strong>diti<strong>on</strong>s and<br />
each of <str<strong>on</strong>g>the</str<strong>on</strong>g> following:<br />
n Maintenance costs<br />
n Service disrupti<strong>on</strong>s<br />
n Slow speed z<strong>on</strong>es<br />
n O<str<strong>on</strong>g>the</str<strong>on</strong>g>r service quality measures<br />
Given limitati<strong>on</strong>s in data and <str<strong>on</strong>g>the</str<strong>on</strong>g> existing research,<br />
this discussi<strong>on</strong> focuses primarily (but not exclusively)<br />
<strong>on</strong> vehicle c<strong>on</strong>diti<strong>on</strong>s and performance, with <str<strong>on</strong>g>the</str<strong>on</strong>g><br />
understanding that similar issues are encountered<br />
with most o<str<strong>on</strong>g>the</str<strong>on</strong>g>r asset types. Moreover, <str<strong>on</strong>g>the</str<strong>on</strong>g><br />
discussi<strong>on</strong> below <strong>on</strong>ly serves to help emphasize <str<strong>on</strong>g>the</str<strong>on</strong>g><br />
relati<strong>on</strong>ships between c<strong>on</strong>diti<strong>on</strong> and performance; it<br />
does not assess current performance or quantify <str<strong>on</strong>g>the</str<strong>on</strong>g><br />
expected improvement to performance from a<br />
significant reinvestment program.<br />
Operating and Maintenance Costs: Older assets –<br />
including vehicles, roadbeds and facilities – tend to
experience increasing maintenance needs and hence<br />
increasing costs as compared to newer assets. It<br />
should be expected <str<strong>on</strong>g>the</str<strong>on</strong>g>n that aging transit fleets and<br />
o<str<strong>on</strong>g>the</str<strong>on</strong>g>r infrastructure implies increasing maintenance<br />
and repair costs, and both agency reports and cost<br />
research supports this positi<strong>on</strong>. As an example,<br />
c<strong>on</strong>sider <str<strong>on</strong>g>the</str<strong>on</strong>g> chart below showing <str<strong>on</strong>g>the</str<strong>on</strong>g> expected<br />
increase in bus operating and maintenance (O&M)<br />
costs as total life-to-date miles <strong>on</strong> <str<strong>on</strong>g>the</str<strong>on</strong>g> vehicle<br />
increases.<br />
Annualized Vehicle O&M Costs<br />
$50,000<br />
$45,000<br />
$40,000<br />
$35,000<br />
$30,000<br />
$25,000<br />
$20,000<br />
$15,000<br />
$10,000<br />
Annual Operating and Maintenance Costs: 40ft Bus<br />
25,000 Miles per Year<br />
35,000 Miles per Year<br />
50,000 Miles per Year<br />
1 2 3 4 5 6 7 8 9 10 11 12 13 14 15 16 17 18<br />
Vehicle Age (years)<br />
Service Disrupti<strong>on</strong>s: Similarly, older assets are less<br />
reliable, with <str<strong>on</strong>g>the</str<strong>on</strong>g> probability of failure increasing with<br />
asset age and asset wear. While this is again most<br />
easily dem<strong>on</strong>strated with fleet vehicles (see chart <strong>on</strong><br />
in-service failures vs. rail vehicle age below), this<br />
observati<strong>on</strong> also applies to o<str<strong>on</strong>g>the</str<strong>on</strong>g>r asset types as well,<br />
including train c<strong>on</strong>trol systems, trackwork, and<br />
electrificati<strong>on</strong> systems.<br />
Mean Distance Between Failures (Miles)<br />
14,000<br />
12,000<br />
10,000<br />
8,000<br />
6,000<br />
4,000<br />
2,000<br />
Mean Distance Between Failures: Rail Vehicles<br />
0<br />
0 10 20<br />
Vehicle Age (Years)<br />
30 40<br />
15<br />
Slow Speed Z<strong>on</strong>es: Slow z<strong>on</strong>es occur where trains<br />
are required to reduce <str<strong>on</strong>g>the</str<strong>on</strong>g>ir speed due to poor<br />
structural, power, signal, or track c<strong>on</strong>diti<strong>on</strong>s. To <str<strong>on</strong>g>the</str<strong>on</strong>g><br />
extent that poor c<strong>on</strong>diti<strong>on</strong>s can become more<br />
prevalent as assets age (more so for track and<br />
structures), slow z<strong>on</strong>es are likely to be both more<br />
numerous and require greater speed reducti<strong>on</strong>s with<br />
an aging asset base.<br />
Service Quality Measures: Finally, <str<strong>on</strong>g>the</str<strong>on</strong>g> impact of<br />
asset physical c<strong>on</strong>diti<strong>on</strong>s <strong>on</strong> performance can also be<br />
assessed using a variety of service quality measures<br />
including <str<strong>on</strong>g>the</str<strong>on</strong>g> percent of assets in proper working<br />
order (e.g., fleet vehicles, fare gates, escalators,<br />
etc.), <strong>on</strong> time performance, and <str<strong>on</strong>g>the</str<strong>on</strong>g> number of<br />
customer complaints relating to asset c<strong>on</strong>diti<strong>on</strong>s/<br />
deteriorati<strong>on</strong>.<br />
r ASSESSMENT LIMITATIONS<br />
The ability of local agencies and FTA to assess <str<strong>on</strong>g>the</str<strong>on</strong>g><br />
current asset c<strong>on</strong>diti<strong>on</strong>s and reinvestment needs of<br />
<str<strong>on</strong>g>the</str<strong>on</strong>g> transit industry is hampered by a variety of<br />
factors. These include <str<strong>on</strong>g>the</str<strong>on</strong>g> following:<br />
At <str<strong>on</strong>g>the</str<strong>on</strong>g> Local Level:<br />
n Few agencies perform detailed c<strong>on</strong>diti<strong>on</strong><br />
assessments <strong>on</strong> a regular basis;<br />
n Most agencies do not maintain comprehensive<br />
asset inventories (for <str<strong>on</strong>g>the</str<strong>on</strong>g> purpose of asset<br />
c<strong>on</strong>diti<strong>on</strong> m<strong>on</strong>itoring and replacement needs<br />
assessments);<br />
n Most agencies do not c<strong>on</strong>duct unc<strong>on</strong>strained<br />
l<strong>on</strong>g-term state of good repair needs estimates<br />
<strong>on</strong> a regular basis.<br />
At <str<strong>on</strong>g>the</str<strong>on</strong>g> <strong>Federal</strong> Level:<br />
n Absence of a nati<strong>on</strong>al asset c<strong>on</strong>diti<strong>on</strong> or<br />
inventory reporting requirement;<br />
n Absence of a standardized c<strong>on</strong>diti<strong>on</strong> reporting<br />
system;<br />
n Assumpti<strong>on</strong>s regarding asset useful lives and <str<strong>on</strong>g>the</str<strong>on</strong>g><br />
time period to address <str<strong>on</strong>g>the</str<strong>on</strong>g> investment backlog<br />
vary widely across agencies.
C<strong>on</strong>diti<strong>on</strong>s of <strong>Transit</strong> Infrastructure<br />
r OBSERVATIONS FROM <strong>SGR</strong><br />
WORKSHOP<br />
The <strong>SGR</strong> Workshop yielded a number of<br />
observati<strong>on</strong>s and valuable perspectives with respect<br />
to <str<strong>on</strong>g>the</str<strong>on</strong>g> current c<strong>on</strong>diti<strong>on</strong> of <str<strong>on</strong>g>the</str<strong>on</strong>g> nati<strong>on</strong>’s transit assets<br />
and <str<strong>on</strong>g>the</str<strong>on</strong>g> level of investment required to address<br />
unmet needs. Following are several key study<br />
observati<strong>on</strong>s:<br />
Current Nati<strong>on</strong>al Estimates: Some workshop<br />
participants expressed <str<strong>on</strong>g>the</str<strong>on</strong>g> c<strong>on</strong>cern that <str<strong>on</strong>g>the</str<strong>on</strong>g> current<br />
estimates produced by FTA’s TERM model may be<br />
low, and discussed at length <str<strong>on</strong>g>the</str<strong>on</strong>g> importance of a<br />
c<strong>on</strong>sistent definiti<strong>on</strong> of <strong>SGR</strong> needs. In particular,<br />
participants were c<strong>on</strong>cerned that <str<strong>on</strong>g>the</str<strong>on</strong>g> tool may not<br />
fully account for “betterments,” “improvements” or<br />
mandated requirements (e.g., ADA) that occur<br />
whenever assets are replaced, or additi<strong>on</strong>al costs to<br />
replace assets supporting active operati<strong>on</strong>s (note:<br />
many TERM replacements are made “in-kind”). FTA<br />
has already initiated work programs to better capture<br />
<str<strong>on</strong>g>the</str<strong>on</strong>g>se betterment and improvement cost increments<br />
in future versi<strong>on</strong>s of <str<strong>on</strong>g>the</str<strong>on</strong>g> model.<br />
Needs versus Funding: Representatives of two of<br />
<str<strong>on</strong>g>the</str<strong>on</strong>g> older rail agencies participating in <str<strong>on</strong>g>the</str<strong>on</strong>g> workshop<br />
cited internal estimates that <str<strong>on</strong>g>the</str<strong>on</strong>g>ir <strong>SGR</strong> needs outpace<br />
expenditures by a ratio of 2:1. Participants also<br />
noted that some operating expenses (e.g., lease<br />
payments) are actually <strong>SGR</strong> related investments.<br />
Hence, strict comparis<strong>on</strong>s of available reinvestment<br />
needs and funding available for reinvestment<br />
activities may not account for <str<strong>on</strong>g>the</str<strong>on</strong>g>se types of<br />
expenditures.<br />
Deferred Investments: Most participants agreed that<br />
maintenance facilities, bridges, signals, and stati<strong>on</strong><br />
amenities tended to be <str<strong>on</strong>g>the</str<strong>on</strong>g> asset types with <str<strong>on</strong>g>the</str<strong>on</strong>g><br />
largest deferred investment needs (<str<strong>on</strong>g>the</str<strong>on</strong>g>se are<br />
generally c<strong>on</strong>sidered lower priority assets, assuming<br />
<str<strong>on</strong>g>the</str<strong>on</strong>g>re are no safety issues resulting from <str<strong>on</strong>g>the</str<strong>on</strong>g>ir<br />
deferral).<br />
Rehabilitati<strong>on</strong>/Replacement Costs: Participants<br />
noted that rehabilitati<strong>on</strong> and replacement costs used<br />
16<br />
for needs estimati<strong>on</strong> must fully capture all cost<br />
factors including:<br />
n Installati<strong>on</strong> under no, partial or full service;<br />
n Agency force account and/or c<strong>on</strong>tracted labor;<br />
n Soft costs, including design and project<br />
management;<br />
n Inflati<strong>on</strong> rates appropriate to <str<strong>on</strong>g>the</str<strong>on</strong>g> types of<br />
materials and labor being utilized;<br />
n Required materials or technology improvements.<br />
Technological Obsolescence: Reinvestment<br />
activities are sometimes driven by <str<strong>on</strong>g>the</str<strong>on</strong>g> need for<br />
technological improvements as much as by<br />
replacement of worn assets.<br />
r ISSUES REMAINING<br />
Following are additi<strong>on</strong>al questi<strong>on</strong>s for <str<strong>on</strong>g>the</str<strong>on</strong>g> industry to<br />
address with respect to <str<strong>on</strong>g>the</str<strong>on</strong>g> current c<strong>on</strong>diti<strong>on</strong>s of <str<strong>on</strong>g>the</str<strong>on</strong>g><br />
nati<strong>on</strong>’s transit assets and overall state of good<br />
repair:<br />
n Is <str<strong>on</strong>g>the</str<strong>on</strong>g> assessment of needs and c<strong>on</strong>diti<strong>on</strong>s<br />
presented above reas<strong>on</strong>ably accurate? For<br />
example, are asset c<strong>on</strong>diti<strong>on</strong>s poorest and<br />
investment needs most significant for bus and<br />
heavy rail? Within <str<strong>on</strong>g>the</str<strong>on</strong>g>se two modes, are <str<strong>on</strong>g>the</str<strong>on</strong>g><br />
highest reinvestment needs for stati<strong>on</strong>s and<br />
vehicles (heavy rail) and vehicles and<br />
maintenance facilities (bus)?<br />
n What are <str<strong>on</strong>g>the</str<strong>on</strong>g> biggest investment needs in terms<br />
of investment dollars (i.e., where are <str<strong>on</strong>g>the</str<strong>on</strong>g> largest<br />
deferred needs) by mode and asset type?<br />
n How are local agencies addressing <str<strong>on</strong>g>the</str<strong>on</strong>g>ir<br />
reinvestment needs given <str<strong>on</strong>g>the</str<strong>on</strong>g> gap between<br />
needs and available funding?<br />
n Where are <str<strong>on</strong>g>the</str<strong>on</strong>g> most significant sources of<br />
potential risk to local agencies if current<br />
outstanding needs are not addressed (e.g., in<br />
terms of safety, potential for extended service<br />
disrupti<strong>on</strong>s, or o<str<strong>on</strong>g>the</str<strong>on</strong>g>r risks)? Is <str<strong>on</strong>g>the</str<strong>on</strong>g>re a specific<br />
asset type most associated with risk?
n How would attaining full <strong>SGR</strong> impact nati<strong>on</strong>al n How significant is <str<strong>on</strong>g>the</str<strong>on</strong>g> gap between available<br />
transit performance in terms of: throughput, resources and local agency state of good repair<br />
reliability, operating speed, maintenance costs needs? Do local agencies have reliable<br />
and overall quality of service? estimates of <str<strong>on</strong>g>the</str<strong>on</strong>g> size of that gap?<br />
17
Defining and Measuring <strong>SGR</strong><br />
r OVERVIEW<br />
Defining and Measuring State of Good Repair<br />
FTA State of Good Repair Workshop<br />
What exactly is meant by a “state of good repair”? In<br />
<str<strong>on</strong>g>the</str<strong>on</strong>g> absence of a clear and widely-shared definiti<strong>on</strong><br />
and reliable measures of <strong>SGR</strong>, pursuing a state of<br />
good repair can be challenging. Without such a<br />
definiti<strong>on</strong>, local agency decisi<strong>on</strong>-makers will struggle<br />
to 1) establish an operati<strong>on</strong>al policy of attaining <strong>SGR</strong>,<br />
2) determine what it will take to reach that objective,<br />
and 3) determine when (or if) that goal has been<br />
attained. Therefore, this paper c<strong>on</strong>siders (but does<br />
not fully answer) <str<strong>on</strong>g>the</str<strong>on</strong>g> following questi<strong>on</strong>s:<br />
n How should <str<strong>on</strong>g>the</str<strong>on</strong>g> transit industry define <strong>SGR</strong>?<br />
n How can <strong>SGR</strong> (or movement towards or away<br />
from <strong>SGR</strong>) best be measured?<br />
n Should <str<strong>on</strong>g>the</str<strong>on</strong>g> c<strong>on</strong>cept of <strong>SGR</strong> be based entirely <strong>on</strong><br />
asset physical c<strong>on</strong>diti<strong>on</strong> or should issues of<br />
technological obsolescence or desired service<br />
performance be embedded in <str<strong>on</strong>g>the</str<strong>on</strong>g> c<strong>on</strong>cept?<br />
r DEFINING STATE OF GOOD REPAIR<br />
Before being able to measure <strong>SGR</strong> it is first<br />
necessary to define what <strong>SGR</strong> means. The table at<br />
right presents several definiti<strong>on</strong>s of “state of good<br />
repair” as applied by a sample of U.S. transit<br />
operators. These definiti<strong>on</strong>s include a mix of<br />
c<strong>on</strong>cepts – including specific reinvestment guidelines<br />
(when should specific asset types be replaced?),<br />
asset performance standards investment (ensuring<br />
assets are functi<strong>on</strong>ing at <str<strong>on</strong>g>the</str<strong>on</strong>g>ir “ideal capacity”) and<br />
investments that address deferred needs. Despite<br />
<str<strong>on</strong>g>the</str<strong>on</strong>g>ir differences, <str<strong>on</strong>g>the</str<strong>on</strong>g>se definiti<strong>on</strong>s are essentially a<br />
variati<strong>on</strong> <strong>on</strong> <str<strong>on</strong>g>the</str<strong>on</strong>g> basic <str<strong>on</strong>g>the</str<strong>on</strong>g>me that assets are in a<br />
“state of good repair” when all life cycle investment<br />
needs have been addressed – including preventive<br />
maintenance, rehabilitati<strong>on</strong>s and scheduled<br />
replacement needs – resulting in <str<strong>on</strong>g>the</str<strong>on</strong>g> general<br />
absence of deferred investment needs. While this<br />
characterizati<strong>on</strong> of <strong>SGR</strong> represents a noti<strong>on</strong>al ideal (it<br />
18<br />
is impossible to maintain this ideal state as scheduled<br />
rehabilitati<strong>on</strong> and replacement activities arise<br />
c<strong>on</strong>tinuously), it does provide an objective (if<br />
unattainable) investment target and a standard<br />
against which current c<strong>on</strong>diti<strong>on</strong>s can be measured.<br />
<strong>Transit</strong> Agency Definiti<strong>on</strong>s of State of Good<br />
Repair (<strong>SGR</strong>)<br />
Agency<br />
CTA<br />
Cleveland<br />
RTA<br />
MBTA<br />
NJT<br />
NYCT<br />
SEPTA<br />
Definiti<strong>on</strong><br />
CTA defines <strong>SGR</strong> primarily in terms of standards:<br />
• Rail lines should be free of slow z<strong>on</strong>es and have<br />
reliable signals.<br />
• Buses should be rehabbed at 6 years and<br />
replaced at 12 years.<br />
• Rail cars should be rehabbed at quarter- and<br />
half-life intervals and replaced at 25 years.<br />
• Maintenance facilities should be replaced at 40<br />
years (70 years if rehabbed).<br />
State of good repair projects are those needed to<br />
bring <str<strong>on</strong>g>the</str<strong>on</strong>g> system to a c<strong>on</strong>sistent, high quality<br />
c<strong>on</strong>diti<strong>on</strong> system-wide.<br />
A state of good repair standard [is where] all capital<br />
assets are functi<strong>on</strong>ing at <str<strong>on</strong>g>the</str<strong>on</strong>g>ir ideal capacity within<br />
<str<strong>on</strong>g>the</str<strong>on</strong>g>ir design life.<br />
"State of Good Repair" is achieved when <str<strong>on</strong>g>the</str<strong>on</strong>g><br />
infrastructure comp<strong>on</strong>ents are replaced <strong>on</strong> a<br />
schedule c<strong>on</strong>sistent with <str<strong>on</strong>g>the</str<strong>on</strong>g>ir life expectancy.<br />
Investments that address deteriorated c<strong>on</strong>diti<strong>on</strong>s<br />
and make up for past disinvestment<br />
An asset or system is in a state of good repair<br />
when no backlog of needs exists and no<br />
comp<strong>on</strong>ent is bey<strong>on</strong>d its useful life. State of good<br />
repair projects correct past deferred maintenance,<br />
or replace capital assets that have exceeded <str<strong>on</strong>g>the</str<strong>on</strong>g>ir<br />
useful life.<br />
For <str<strong>on</strong>g>the</str<strong>on</strong>g> purposes of discussi<strong>on</strong>, this paper suggests<br />
<str<strong>on</strong>g>the</str<strong>on</strong>g> following operati<strong>on</strong>al definiti<strong>on</strong> of <strong>SGR</strong> based <strong>on</strong><br />
<str<strong>on</strong>g>the</str<strong>on</strong>g> definiti<strong>on</strong>s c<strong>on</strong>sidered above as a starting point<br />
for <str<strong>on</strong>g>the</str<strong>on</strong>g> dialogue:<br />
An asset or system is in a state of good<br />
repair when no backlog of capital needs
exists – hence all asset life cycle investment<br />
needs (e.g., preventive maintenance and<br />
rehabilitati<strong>on</strong>) have been addressed and no<br />
capital asset exceeds its useful life.<br />
This definiti<strong>on</strong> is “operati<strong>on</strong>al” since it is possible to<br />
c<strong>on</strong>tinuously evaluate <str<strong>on</strong>g>the</str<strong>on</strong>g> size of <str<strong>on</strong>g>the</str<strong>on</strong>g> investment<br />
backlog – <str<strong>on</strong>g>the</str<strong>on</strong>g> total value of all deferred life cycle<br />
investments – an amount that reflects <str<strong>on</strong>g>the</str<strong>on</strong>g> difference<br />
between an ideal state of good repair and <str<strong>on</strong>g>the</str<strong>on</strong>g> current<br />
c<strong>on</strong>diti<strong>on</strong> of an agency’s existing assets.<br />
Making <strong>SGR</strong> “Operati<strong>on</strong>al”: To make this definiti<strong>on</strong><br />
operati<strong>on</strong>al, agencies must first define <str<strong>on</strong>g>the</str<strong>on</strong>g> timing of<br />
asset life cycle events (i.e., at what ages are assets<br />
rehabbed and replaced). These decisi<strong>on</strong>s are<br />
important as <str<strong>on</strong>g>the</str<strong>on</strong>g> selected rehab and replacement<br />
policies will directly impact both total investment<br />
needs (shorter replacement cycles are generally<br />
more costly) as well as what physical c<strong>on</strong>diti<strong>on</strong>s are<br />
Sample Useful Life Assumpti<strong>on</strong>s<br />
Asset<br />
Category<br />
CTA MBTA NYCT<br />
Structures 100-year life Subway: 100 Subway: 100<br />
yrs<br />
yrs<br />
Bridges: 50-70 Elevated: 50<br />
yrs<br />
yrs<br />
Trackwork As needed 25-year life Ballasted: 35<br />
yrs<br />
Subway DF:<br />
65 yrs<br />
Elevated: 25<br />
yrs<br />
Facilities 40-year life; 75-year life; 75-year life;<br />
70 with Mid-life rehab Mid-life rehab/<br />
renovati<strong>on</strong> /minor minor<br />
renovati<strong>on</strong>s renovati<strong>on</strong>s<br />
Signals 50 yrs 25 yrs 50 yrs<br />
Substati<strong>on</strong>s 40 yrs 30 yrs 40 yrs<br />
Cable<br />
15 years 50 years<br />
Stati<strong>on</strong>s 40-year 50-year life; 35-year rehab<br />
(buildings) rehab cycle mid-life<br />
overhaul<br />
cycle<br />
Rail 25-year life; 35-year life; 40-year life;<br />
Vehicles Mid/quarter Mid-life Mid-life<br />
life overhauls overhaul overhaul<br />
Bus 12-year life; 15-year life; 12-year life;<br />
Vehicles Mid-life Mid-life Mid-life<br />
overhaul overhaul overhaul<br />
19<br />
c<strong>on</strong>sidered “acceptable”. As <str<strong>on</strong>g>the</str<strong>on</strong>g> table dem<strong>on</strong>strates,<br />
<str<strong>on</strong>g>the</str<strong>on</strong>g>re are no comm<strong>on</strong> industry standards for asset<br />
useful lives.<br />
Related Investment C<strong>on</strong>cepts: Before moving <strong>on</strong><br />
to <str<strong>on</strong>g>the</str<strong>on</strong>g> topic of <strong>SGR</strong> measurement, it may be helpful<br />
to c<strong>on</strong>trast <str<strong>on</strong>g>the</str<strong>on</strong>g> c<strong>on</strong>cept of <strong>SGR</strong> with o<str<strong>on</strong>g>the</str<strong>on</strong>g>r investment<br />
c<strong>on</strong>cepts as a means of better defining what <strong>SGR</strong> is<br />
and is not. C<strong>on</strong>sider <str<strong>on</strong>g>the</str<strong>on</strong>g> following:<br />
n Normal Replacement (NR) - Projects that<br />
replace assets at <str<strong>on</strong>g>the</str<strong>on</strong>g> end of <str<strong>on</strong>g>the</str<strong>on</strong>g>ir normal useful<br />
life based <strong>on</strong> <str<strong>on</strong>g>the</str<strong>on</strong>g> age and according to a<br />
scheduled program of replacement as needed to<br />
maintain a state of good repair. (In c<strong>on</strong>trast to<br />
<strong>SGR</strong> investments, which move an agency<br />
towards a state of good repair, normal<br />
replacements help maintain a state of good<br />
repair).<br />
n System Improvement (SI) - Projects to improve<br />
existing assets or operati<strong>on</strong>s (e.g., technology or<br />
materials upgrades, capacity improvements).<br />
<strong>SGR</strong> and NR investments frequently include an<br />
SI comp<strong>on</strong>ent as assets are rarely replaced<br />
entirely “in kind”.<br />
r MEASURING STATE OF GOOD<br />
REPAIR<br />
This secti<strong>on</strong> c<strong>on</strong>siders four different measures of<br />
state of good repair based <strong>on</strong> <str<strong>on</strong>g>the</str<strong>on</strong>g> definiti<strong>on</strong> of <strong>SGR</strong><br />
developed above. Each of <str<strong>on</strong>g>the</str<strong>on</strong>g> following is<br />
c<strong>on</strong>sidered:<br />
n Percent of assets in <strong>SGR</strong><br />
n Percent of service life remaining<br />
n Asset c<strong>on</strong>diti<strong>on</strong> ratings<br />
n Asset specific c<strong>on</strong>diti<strong>on</strong> measures<br />
Percent of Assets in <strong>SGR</strong>: Percent of assets in a<br />
state of good repair is <str<strong>on</strong>g>the</str<strong>on</strong>g> simplest and easiest to<br />
understand measure of state of good repair. In<br />
practice this percentage measure can be based<br />
ei<str<strong>on</strong>g>the</str<strong>on</strong>g>r <strong>on</strong> (i) <str<strong>on</strong>g>the</str<strong>on</strong>g> proporti<strong>on</strong> of assets (by count or
Defining and Measuring <strong>SGR</strong><br />
value) that do not exceed <str<strong>on</strong>g>the</str<strong>on</strong>g>ir expected useful life or<br />
(ii) based <strong>on</strong> engineering assessments of <str<strong>on</strong>g>the</str<strong>on</strong>g><br />
proporti<strong>on</strong> of assets that are in “good working order”.<br />
The chart below presents an example of this<br />
measure, showing <str<strong>on</strong>g>the</str<strong>on</strong>g> proporti<strong>on</strong> of U.S. transit<br />
assets, by type, that are less than <str<strong>on</strong>g>the</str<strong>on</strong>g>ir expected<br />
useful life. The chart is based <strong>on</strong> asset data from <str<strong>on</strong>g>the</str<strong>on</strong>g><br />
<strong>Federal</strong> <strong>Transit</strong> Administrati<strong>on</strong>s’ (FTA) <strong>Transit</strong><br />
Ec<strong>on</strong>omic Requirements Model (TERM).<br />
Percent of U.S. <strong>Transit</strong> Assets in <strong>SGR</strong> (Estimate)<br />
Power<br />
Guideway Structures<br />
Trackwork<br />
Elevators / Escalators<br />
Rail (Yards & Shops)<br />
Stati <strong>on</strong>s<br />
Communicati<strong>on</strong>s<br />
Bus Facilities<br />
Revenue Vehi cl es<br />
Signals<br />
0% 20% 40% 60% 80% 100%<br />
While easy to develop and easy to explain to<br />
decisi<strong>on</strong>-makers, percent of assets in <strong>SGR</strong> provides<br />
no informati<strong>on</strong> <strong>on</strong> <str<strong>on</strong>g>the</str<strong>on</strong>g> c<strong>on</strong>diti<strong>on</strong> of assets currently in<br />
<strong>SGR</strong>. For example, are most assets in excellent<br />
shape or will a significant proporti<strong>on</strong> of assets<br />
currently in <strong>SGR</strong> require rehabilitati<strong>on</strong> or replacement<br />
in <str<strong>on</strong>g>the</str<strong>on</strong>g> near future? Percent of assets in <strong>SGR</strong> cannot<br />
shed light <strong>on</strong> <str<strong>on</strong>g>the</str<strong>on</strong>g>se questi<strong>on</strong>s.<br />
Percent of Service Life Remaining: Distributi<strong>on</strong>s of<br />
percent of service life remaining show <str<strong>on</strong>g>the</str<strong>on</strong>g> proporti<strong>on</strong>s<br />
of transit assets at different stages during <str<strong>on</strong>g>the</str<strong>on</strong>g>ir<br />
service life cycle based <strong>on</strong> <str<strong>on</strong>g>the</str<strong>on</strong>g>ir expected useful life.<br />
In <str<strong>on</strong>g>the</str<strong>on</strong>g> example below, track work assets from a<br />
sample of U.S. rail operators are segmented into<br />
quarter life groupings (for trackwork within its useful<br />
life) and an additi<strong>on</strong>al grouping for trackwork that has<br />
exceeded its expected service life. This presentati<strong>on</strong><br />
provides more informati<strong>on</strong> <strong>on</strong> <str<strong>on</strong>g>the</str<strong>on</strong>g> overall c<strong>on</strong>diti<strong>on</strong> of<br />
an asset grouping, as compared to <str<strong>on</strong>g>the</str<strong>on</strong>g> percent of<br />
assets in <strong>SGR</strong> example presented above. This<br />
measure can be applied to any grouping of agency<br />
20<br />
assets, ranging from <str<strong>on</strong>g>the</str<strong>on</strong>g> age distributi<strong>on</strong> for a specific<br />
subsystem (e.g., rail switches) to age distributi<strong>on</strong> of<br />
all agency assets system-wide.<br />
Percent of Trackwork by Service Life Remaining<br />
(1/4 Lives) Service life<br />
24% to 0% of<br />
service life,<br />
13%<br />
49% to 25%<br />
of service<br />
life,<br />
10%<br />
exceeded<br />
18%<br />
100% to 75%<br />
of service life<br />
31%<br />
74% to 50%<br />
of service<br />
life,<br />
28%<br />
Note that infrastructure managers in o<str<strong>on</strong>g>the</str<strong>on</strong>g>r industries<br />
often report <strong>on</strong>ly <str<strong>on</strong>g>the</str<strong>on</strong>g> proporti<strong>on</strong> of assets that<br />
currently exceed <str<strong>on</strong>g>the</str<strong>on</strong>g>ir useful life. This is sometimes<br />
called a “facilities c<strong>on</strong>diti<strong>on</strong> index” and equal to <str<strong>on</strong>g>the</str<strong>on</strong>g><br />
following:<br />
Facilities C<strong>on</strong>diti<strong>on</strong> Index = Value of Assets Exceeding Useful Life<br />
Value of all Assets<br />
This measure has also been used to establish a<br />
desired <strong>SGR</strong> target within some industries (e.g., no<br />
more than 2% of assets exceed <str<strong>on</strong>g>the</str<strong>on</strong>g>ir useful life). Note<br />
that <str<strong>on</strong>g>the</str<strong>on</strong>g> percent of assets that currently exceed <str<strong>on</strong>g>the</str<strong>on</strong>g>ir<br />
useful life is <str<strong>on</strong>g>the</str<strong>on</strong>g> exact opposite of <str<strong>on</strong>g>the</str<strong>on</strong>g> proporti<strong>on</strong> of<br />
assets in <strong>SGR</strong> measure.<br />
Asset C<strong>on</strong>diti<strong>on</strong> Ratings: While <str<strong>on</strong>g>the</str<strong>on</strong>g> percent of<br />
service life age distributi<strong>on</strong>s presented above<br />
provides a good understanding of <str<strong>on</strong>g>the</str<strong>on</strong>g> proporti<strong>on</strong>s of<br />
assets in varying c<strong>on</strong>diti<strong>on</strong>s, <str<strong>on</strong>g>the</str<strong>on</strong>g> practice of using<br />
quarter-life age groupings is arbitrary. Specifically,<br />
<str<strong>on</strong>g>the</str<strong>on</strong>g>se age groupings may not provide a good<br />
representati<strong>on</strong> of <str<strong>on</strong>g>the</str<strong>on</strong>g> differing phases of asset<br />
c<strong>on</strong>diti<strong>on</strong>s an asset will experience throughout <str<strong>on</strong>g>the</str<strong>on</strong>g> full<br />
life cycle. To address this issue, many transit<br />
agencies, state DOTs and engineering firms utilize<br />
four- or five-point c<strong>on</strong>diti<strong>on</strong> rating scales to assess<br />
<str<strong>on</strong>g>the</str<strong>on</strong>g> c<strong>on</strong>diti<strong>on</strong> of capital assets. An example of this
approach is <str<strong>on</strong>g>the</str<strong>on</strong>g> five-level c<strong>on</strong>diti<strong>on</strong> scale used by<br />
FTA’s <strong>Transit</strong> Ec<strong>on</strong>omic Requirements Model<br />
(TERM), which was adapted from a detailed<br />
engineering c<strong>on</strong>diti<strong>on</strong> assessment performed by <str<strong>on</strong>g>the</str<strong>on</strong>g><br />
Chicago <strong>Transit</strong> Authority in <str<strong>on</strong>g>the</str<strong>on</strong>g> early 1990s. This<br />
c<strong>on</strong>diti<strong>on</strong> scale and a c<strong>on</strong>diti<strong>on</strong> distributi<strong>on</strong> chart for<br />
U.S. light rail operators based <strong>on</strong> this scale follow.<br />
C<strong>on</strong>diti<strong>on</strong> Descripti<strong>on</strong><br />
TERM C<strong>on</strong>diti<strong>on</strong> Ratings<br />
Excellent New or like new asset; no visible defects<br />
Good<br />
Adequate<br />
Marginal<br />
Asset showing minimal signs of wear; some<br />
(slightly) defective or deteriorated comp<strong>on</strong>ents<br />
Asset has reached its mid-life; some moderately<br />
defective or deteriorated comp<strong>on</strong>ents<br />
Asset reaching or just past its useful life;<br />
increasing number of deteriorated comp<strong>on</strong>ents<br />
Asset past its useful life; in need of<br />
Poor replacement; may have critically damaged<br />
comp<strong>on</strong>ents<br />
C<strong>on</strong>diti<strong>on</strong> Distributi<strong>on</strong> of U.S. Light Rail Assets<br />
(TERM)<br />
A key value of c<strong>on</strong>diti<strong>on</strong> rating systems is that all<br />
assets, regardless of type, can be rated using <str<strong>on</strong>g>the</str<strong>on</strong>g><br />
same c<strong>on</strong>diti<strong>on</strong> ratings. This facilitates both<br />
comparis<strong>on</strong>s of c<strong>on</strong>diti<strong>on</strong>s across asset types (e.g.,<br />
between vehicles and trackwork) and also allows <str<strong>on</strong>g>the</str<strong>on</strong>g><br />
agency to represent asset c<strong>on</strong>diti<strong>on</strong>s for any<br />
grouping of assets – including <str<strong>on</strong>g>the</str<strong>on</strong>g> agency as a whole<br />
(or a whole mode, as provided in <str<strong>on</strong>g>the</str<strong>on</strong>g> pie chart<br />
above).<br />
21<br />
Asset-Specific C<strong>on</strong>diti<strong>on</strong> Measures: Finally,<br />
agencies can also develop and utilize <strong>SGR</strong> measures<br />
that are specific to individual asset types. For<br />
example, most rail agencies maintain records of rail<br />
c<strong>on</strong>diti<strong>on</strong>s as obtained from track geometry car<br />
readings. O<str<strong>on</strong>g>the</str<strong>on</strong>g>r examples include pavement<br />
roughness indexes (for busway lanes), mean time<br />
between failure rates for vehicles, and vehicle ride<br />
quality indices. While <str<strong>on</strong>g>the</str<strong>on</strong>g>se measures are extremely<br />
valuable in m<strong>on</strong>itoring <str<strong>on</strong>g>the</str<strong>on</strong>g> needs of <str<strong>on</strong>g>the</str<strong>on</strong>g> specific asset<br />
types <str<strong>on</strong>g>the</str<strong>on</strong>g>y address, <str<strong>on</strong>g>the</str<strong>on</strong>g>y are of less value than <str<strong>on</strong>g>the</str<strong>on</strong>g><br />
measures c<strong>on</strong>sidered above when assessing an<br />
agency’s overall state of good repair.<br />
Summary: <strong>SGR</strong> Measure Strengths and<br />
Weaknesses<br />
Measure Strengths Weaknesses<br />
Percent of • Easy to • Poor<br />
assets in <strong>SGR</strong> implement understanding of<br />
• Easy to<br />
understand<br />
full distributi<strong>on</strong> of<br />
asset c<strong>on</strong>diti<strong>on</strong>s<br />
Percent of • Easy to • ¼-life age<br />
service life implement groupings may not<br />
remaining<br />
• Easy to<br />
understand<br />
reflect meaningful<br />
differences in<br />
c<strong>on</strong>diti<strong>on</strong>s or<br />
needs<br />
Asset c<strong>on</strong>diti<strong>on</strong> • Can be applied • User must<br />
ratings<br />
across any understand <str<strong>on</strong>g>the</str<strong>on</strong>g><br />
grouping of<br />
assets<br />
rating system<br />
Asset specific • Good<br />
• Measures not<br />
c<strong>on</strong>diti<strong>on</strong> understanding of comparable across<br />
measures <str<strong>on</strong>g>the</str<strong>on</strong>g> c<strong>on</strong>diti<strong>on</strong>/<br />
needs of specific<br />
assets<br />
multiple types<br />
r STATE OF GOOD PERFORMANCE<br />
Finally, this paper has discussed <str<strong>on</strong>g>the</str<strong>on</strong>g> issue of state of<br />
good repair almost entirely in terms of re-investment<br />
in existing assets with deferred needs. There has<br />
been little discussi<strong>on</strong> of whe<str<strong>on</strong>g>the</str<strong>on</strong>g>r <str<strong>on</strong>g>the</str<strong>on</strong>g>se investments<br />
involve improvements or betterments to <str<strong>on</strong>g>the</str<strong>on</strong>g>se<br />
existing assets bey<strong>on</strong>d <str<strong>on</strong>g>the</str<strong>on</strong>g>ir original capabilities (i.e.,<br />
<str<strong>on</strong>g>the</str<strong>on</strong>g> discussi<strong>on</strong> has focused <strong>on</strong> replacement “in-kind”<br />
and not “betterments”). This raises <str<strong>on</strong>g>the</str<strong>on</strong>g> questi<strong>on</strong> of
Defining and Measuring <strong>SGR</strong><br />
whe<str<strong>on</strong>g>the</str<strong>on</strong>g>r <str<strong>on</strong>g>the</str<strong>on</strong>g> c<strong>on</strong>cept of state of good repair should be<br />
based entirely <strong>on</strong> asset physical c<strong>on</strong>diti<strong>on</strong><br />
c<strong>on</strong>siderati<strong>on</strong>s (for existing assets) or <str<strong>on</strong>g>the</str<strong>on</strong>g> extent to<br />
which <str<strong>on</strong>g>the</str<strong>on</strong>g> c<strong>on</strong>cept should also include c<strong>on</strong>siderati<strong>on</strong><br />
of overall system performance. Phrased differently, is<br />
<str<strong>on</strong>g>the</str<strong>on</strong>g> objective of <strong>SGR</strong> to ensure effective rehabilitati<strong>on</strong><br />
and replacement of existing assets, or is it to<br />
maintain a “state of good performance”?<br />
r OBSERVATIONS FROM <strong>SGR</strong><br />
WORKSHOP<br />
Most of <str<strong>on</strong>g>the</str<strong>on</strong>g> participating agencies have already<br />
established an internal definiti<strong>on</strong> of <strong>SGR</strong>. With minor<br />
variati<strong>on</strong>s, <str<strong>on</strong>g>the</str<strong>on</strong>g>se agencies typically defined <strong>SGR</strong> as a<br />
state where all assets are functi<strong>on</strong>ing normally<br />
(reliably) and within <str<strong>on</strong>g>the</str<strong>on</strong>g>ir useful life. The group<br />
discussed <str<strong>on</strong>g>the</str<strong>on</strong>g> advantages and disadvantages to<br />
measuring <strong>SGR</strong> using c<strong>on</strong>diti<strong>on</strong>, age, or<br />
performance, and generally agreed that c<strong>on</strong>diti<strong>on</strong><br />
was best, age was sec<strong>on</strong>d-best, and performance<br />
should probably not be used. The measurement may<br />
depend <strong>on</strong> <str<strong>on</strong>g>the</str<strong>on</strong>g> financial c<strong>on</strong>text or intended audience:<br />
C<strong>on</strong>diti<strong>on</strong> is <str<strong>on</strong>g>the</str<strong>on</strong>g> ideal measure of <strong>SGR</strong>, as it<br />
incorporates <str<strong>on</strong>g>the</str<strong>on</strong>g> <strong>on</strong>-site evaluati<strong>on</strong>s of trained<br />
engineering experts. On-site c<strong>on</strong>diti<strong>on</strong> assessments<br />
also take into account <str<strong>on</strong>g>the</str<strong>on</strong>g> current performance and<br />
expected future remaining life based <strong>on</strong> <str<strong>on</strong>g>the</str<strong>on</strong>g> specific<br />
envir<strong>on</strong>ment within which an individual asset is<br />
operating (i.e., <str<strong>on</strong>g>the</str<strong>on</strong>g> characteristics of which can<br />
significantly impact asset life expectancy).<br />
Age (Useful Life) is a “sec<strong>on</strong>d-best” measure of<br />
c<strong>on</strong>diti<strong>on</strong> as it does not incorporate o<str<strong>on</strong>g>the</str<strong>on</strong>g>r (n<strong>on</strong>-age)<br />
factors that can drive asset deteriorati<strong>on</strong> (e.g.,<br />
utilizati<strong>on</strong>, maintenance history and operating<br />
envir<strong>on</strong>ment). The use of age as a measure of<br />
c<strong>on</strong>diti<strong>on</strong> makes <str<strong>on</strong>g>the</str<strong>on</strong>g> implied assumpti<strong>on</strong> that a<br />
(single) industry standard useful life is correct and<br />
appropriate for all situati<strong>on</strong>s. On <str<strong>on</strong>g>the</str<strong>on</strong>g> o<str<strong>on</strong>g>the</str<strong>on</strong>g>r hand, age<br />
22<br />
data are more easily collected than c<strong>on</strong>diti<strong>on</strong> data<br />
and hence age makes an easy proxy for use in l<strong>on</strong>gterm<br />
planning exercises.<br />
Performance-Based measures of <strong>SGR</strong> – such as<br />
mean times between failures – provide valuable<br />
informati<strong>on</strong> but in reality are <strong>on</strong>ly indirect measures of<br />
<str<strong>on</strong>g>the</str<strong>on</strong>g> underlying state of repair or asset c<strong>on</strong>diti<strong>on</strong>s.<br />
Although <str<strong>on</strong>g>the</str<strong>on</strong>g> group did not reach c<strong>on</strong>sensus <strong>on</strong><br />
whe<str<strong>on</strong>g>the</str<strong>on</strong>g>r obsolescence should be included in <str<strong>on</strong>g>the</str<strong>on</strong>g><br />
definiti<strong>on</strong> of <strong>SGR</strong>, participants agreed that <str<strong>on</strong>g>the</str<strong>on</strong>g> cost of<br />
upgrading assets to modern standards should be<br />
included in <str<strong>on</strong>g>the</str<strong>on</strong>g>ir replacement cost.<br />
r ISSUES REMAINING<br />
Following are additi<strong>on</strong>al questi<strong>on</strong>s for <str<strong>on</strong>g>the</str<strong>on</strong>g> industry to<br />
address with respect to <str<strong>on</strong>g>the</str<strong>on</strong>g> definiti<strong>on</strong> and<br />
measurement of <str<strong>on</strong>g>the</str<strong>on</strong>g> state of good repair:<br />
n Should <str<strong>on</strong>g>the</str<strong>on</strong>g> industry develop a comm<strong>on</strong> definiti<strong>on</strong><br />
of “state of good repair”?<br />
n Are agencies developing clear life expectancy<br />
targets for all major transit asset types (e.g.,<br />
trackwork, structures, stati<strong>on</strong>s, bus and rail<br />
vehicles, systems and facilities)?<br />
n Are <str<strong>on</strong>g>the</str<strong>on</strong>g>re specific measures of <strong>SGR</strong> <str<strong>on</strong>g>the</str<strong>on</strong>g> industry<br />
should adopt?<br />
n What specific measures are in use by U.S.<br />
agencies? Are <str<strong>on</strong>g>the</str<strong>on</strong>g>y age, value or c<strong>on</strong>diti<strong>on</strong><br />
based?<br />
n Are agencies c<strong>on</strong>ducting asset c<strong>on</strong>diti<strong>on</strong><br />
assessments? When c<strong>on</strong>ducted, are <str<strong>on</strong>g>the</str<strong>on</strong>g>se<br />
assessments periodic or regularly scheduled<br />
events?<br />
n Would <str<strong>on</strong>g>the</str<strong>on</strong>g> transit industry benefit from<br />
development of a standardized set of useful life<br />
values for major transit asset types?
<strong>Transit</strong> TRANSIT Asset ASSET Management MANAGEMENT<br />
r OVERVIEW<br />
The term “asset management” has become<br />
widespread in discussi<strong>on</strong>s of how best to address <str<strong>on</strong>g>the</str<strong>on</strong>g><br />
needs of aging transportati<strong>on</strong> rolling stock and<br />
infrastructure. Unfortunately, <str<strong>on</strong>g>the</str<strong>on</strong>g> term has also taken<br />
<strong>on</strong> broadly different meanings for different user<br />
groups. This paper aims to help establish a working<br />
definiti<strong>on</strong> of “asset management” for transit – based<br />
primarily <strong>on</strong> <str<strong>on</strong>g>the</str<strong>on</strong>g> experience of o<str<strong>on</strong>g>the</str<strong>on</strong>g>r industries and<br />
transportati<strong>on</strong> modes – and <str<strong>on</strong>g>the</str<strong>on</strong>g>n to c<strong>on</strong>sider asset<br />
management’s potential role and limitati<strong>on</strong>s in<br />
addressing <str<strong>on</strong>g>the</str<strong>on</strong>g> issue of state of good repair:<br />
n What is asset management?<br />
n What are <str<strong>on</strong>g>the</str<strong>on</strong>g> benefits of asset management?<br />
n How do o<str<strong>on</strong>g>the</str<strong>on</strong>g>r transportati<strong>on</strong> modes, industries or<br />
countries define and practice asset<br />
management?<br />
n How is <str<strong>on</strong>g>the</str<strong>on</strong>g> transit industry applying asset<br />
management?<br />
n How can asset management help address state<br />
of good repair needs?<br />
This paper shows how asset management practices<br />
can help agencies make better-informed investment<br />
decisi<strong>on</strong>s – primarily in <str<strong>on</strong>g>the</str<strong>on</strong>g> areas of reinvestment<br />
planning and prioritizati<strong>on</strong> – and can help justify<br />
requests for increased funding. The U.S. transit<br />
industry is beginning to make positive advances in<br />
<str<strong>on</strong>g>the</str<strong>on</strong>g> applicati<strong>on</strong> of asset management principles, but it<br />
generally lags <str<strong>on</strong>g>the</str<strong>on</strong>g> domestic highways industry and<br />
much of <str<strong>on</strong>g>the</str<strong>on</strong>g> internati<strong>on</strong>al transportati<strong>on</strong> community,<br />
where <str<strong>on</strong>g>the</str<strong>on</strong>g> applicati<strong>on</strong> of asset management c<strong>on</strong>cepts<br />
is more advanced and <str<strong>on</strong>g>the</str<strong>on</strong>g> “state of <str<strong>on</strong>g>the</str<strong>on</strong>g> art“ more<br />
mature.<br />
<strong>Transit</strong> Asset Management<br />
FTA State of Good Repair Workshop<br />
23<br />
r BACKGROUND: WHAT IS ASSET<br />
MANAGEMENT?<br />
The c<strong>on</strong>cept of “asset management” has different<br />
meanings to different users. For many in <str<strong>on</strong>g>the</str<strong>on</strong>g> U.S.<br />
transit community, it is syn<strong>on</strong>ymous with<br />
maintenance management or preventive<br />
maintenance activities (e.g., day-to-day “shop floor”<br />
activities), while for o<str<strong>on</strong>g>the</str<strong>on</strong>g>rs it may imply outsourcing of<br />
operating and maintenance functi<strong>on</strong>s, potentially<br />
through a public private partnership. This paper<br />
suggests <str<strong>on</strong>g>the</str<strong>on</strong>g> following, much broader definiti<strong>on</strong> of<br />
Transportati<strong>on</strong> Asset Management (TAM):<br />
“Transportati<strong>on</strong> Asset Management is a<br />
strategic and systematic process of<br />
operating, maintaining, improving and<br />
expanding physical assets effectively<br />
throughout <str<strong>on</strong>g>the</str<strong>on</strong>g>ir life cycle. It focuses <strong>on</strong><br />
business and engineering practices for<br />
resource allocati<strong>on</strong> and utilizati<strong>on</strong>, with <str<strong>on</strong>g>the</str<strong>on</strong>g><br />
objective of better decisi<strong>on</strong>-making based<br />
up<strong>on</strong> quality informati<strong>on</strong> and well defined<br />
objectives.”<br />
This is <str<strong>on</strong>g>the</str<strong>on</strong>g> definiti<strong>on</strong> of asset management currently<br />
applied by <str<strong>on</strong>g>the</str<strong>on</strong>g> U.S. highways industry, including most<br />
State DOTs, <str<strong>on</strong>g>the</str<strong>on</strong>g> American Associati<strong>on</strong> of State<br />
Highway Transportati<strong>on</strong> Officials (AASHTO) and <str<strong>on</strong>g>the</str<strong>on</strong>g><br />
<strong>Federal</strong> Highway Administrati<strong>on</strong> (FHWA). This<br />
definiti<strong>on</strong> is also c<strong>on</strong>sistent with how asset<br />
management is being defined and applied by<br />
transportati<strong>on</strong> agencies in <str<strong>on</strong>g>the</str<strong>on</strong>g> UK, Canada, Australia,<br />
and New Zealand. Based <strong>on</strong> this definiti<strong>on</strong>, asset<br />
management is:<br />
n Strategic and not tactical (i.e., has a l<strong>on</strong>g-term<br />
focus)<br />
n Seeks to balance <str<strong>on</strong>g>the</str<strong>on</strong>g> competing needs of<br />
operati<strong>on</strong>s, maintenance, reinvestment and
<strong>Transit</strong> Asset Management<br />
system expansi<strong>on</strong>; it is not focused <strong>on</strong><br />
maintenance or reinvestment al<strong>on</strong>e<br />
n An organizati<strong>on</strong>-wide endeavor: It seeks to<br />
integrate planning, engineering, funding, and IT<br />
perspectives<br />
n Seeks to make informed and prioritized decisi<strong>on</strong>s<br />
regarding <str<strong>on</strong>g>the</str<strong>on</strong>g> use of scarce resources based <strong>on</strong><br />
reliable data in support of clear organizati<strong>on</strong>al<br />
objectives<br />
As a means of c<strong>on</strong>trasting this definiti<strong>on</strong> with more<br />
“traditi<strong>on</strong>al” practices, practiti<strong>on</strong>ers note that asset<br />
management seeks to allocate resources based <strong>on</strong><br />
merit (i.e., highest investment return) and not based<br />
<strong>on</strong> a simple, “worst first” prioritizati<strong>on</strong>. While many<br />
agencies have implicitly invested based <strong>on</strong> merit,<br />
asset management is designed to make <str<strong>on</strong>g>the</str<strong>on</strong>g>se<br />
processes explicit and well-defined.<br />
Transportati<strong>on</strong> Asset Management<br />
RESOURCES<br />
Preservati<strong>on</strong> Operati<strong>on</strong>s Capital Safety,<br />
Improvement Etc.<br />
Finally, this definiti<strong>on</strong>, and <str<strong>on</strong>g>the</str<strong>on</strong>g> practices it represents,<br />
has important implicati<strong>on</strong>s for attaining and<br />
maintaining a state of good repair. Specifically,<br />
attaining a state of good repair necessarily involves<br />
tradeoffs with o<str<strong>on</strong>g>the</str<strong>on</strong>g>r agency investment objectives,<br />
including operati<strong>on</strong>s, capital expansi<strong>on</strong> and safety.<br />
Moreover, <str<strong>on</strong>g>the</str<strong>on</strong>g> state of good repair objective must<br />
also c<strong>on</strong>sider tradeoffs between individual asset<br />
types (e.g., when to invest in trackwork vs.<br />
maintenance facilities). Again, a key goal of asset<br />
management is to make informed investment<br />
decisi<strong>on</strong>s when allocating resources between <str<strong>on</strong>g>the</str<strong>on</strong>g>se<br />
investment opti<strong>on</strong>s.<br />
24<br />
r COMPONENTS OF ASSET<br />
MANAGEMENT<br />
A comprehensive asset management program<br />
c<strong>on</strong>sists of a mix of agency objectives, data sources,<br />
measurement and evaluati<strong>on</strong> processes and decisi<strong>on</strong><br />
support tools. A typical representati<strong>on</strong> of <str<strong>on</strong>g>the</str<strong>on</strong>g>se<br />
comp<strong>on</strong>ents and <str<strong>on</strong>g>the</str<strong>on</strong>g>ir interacti<strong>on</strong> is provided in <str<strong>on</strong>g>the</str<strong>on</strong>g><br />
flow chart below.<br />
Transportati<strong>on</strong> Asset Management Process<br />
Goals and Objectives<br />
Asset Inventory<br />
C<strong>on</strong>diti<strong>on</strong> Assessment and<br />
Performance Modeling<br />
Analysis of Opti<strong>on</strong>s & Tradeoffs<br />
Preservati<strong>on</strong>, Operati<strong>on</strong>s, and Capacity<br />
Expansi<strong>on</strong><br />
Decisi<strong>on</strong>-Making and Resource<br />
Allocati<strong>on</strong><br />
Program Implementati<strong>on</strong><br />
Performance M<strong>on</strong>itoring<br />
Policies, Budgets,<br />
Expectati<strong>on</strong>s<br />
Of <str<strong>on</strong>g>the</str<strong>on</strong>g>se comp<strong>on</strong>ents, <str<strong>on</strong>g>the</str<strong>on</strong>g> following are most relevant<br />
to <str<strong>on</strong>g>the</str<strong>on</strong>g> objective of attaining and maintaining a state of<br />
good repair:<br />
n Goals and Objectives: Is attainment of a state<br />
of good repair an organizati<strong>on</strong>al objective? If so,<br />
has “state of good repair” been clearly defined?<br />
n Asset Inventory: Does your agency possess a<br />
comprehensive and current listing of all major<br />
fixed assets, documenting asset types, c<strong>on</strong>diti<strong>on</strong>,<br />
remaining useful life and value? This is not a<br />
fixed asset ledger for accounting purposes, but<br />
an asset-based inventory for needs assessment<br />
purposes.<br />
n C<strong>on</strong>diti<strong>on</strong> Assessment Process: Does your<br />
agency regularly (or periodically) assess <str<strong>on</strong>g>the</str<strong>on</strong>g>
physical c<strong>on</strong>diti<strong>on</strong>/remaining useful life of all<br />
inventory assets?<br />
n Decisi<strong>on</strong> Support Tools (model): Does your<br />
agency have a decisi<strong>on</strong> support tool with which<br />
to analyze state of good repair needs or<br />
investment scenarios over an extended time<br />
horiz<strong>on</strong> (e.g., 20 years)? These tools process<br />
<str<strong>on</strong>g>the</str<strong>on</strong>g> asset inventory and physical c<strong>on</strong>diti<strong>on</strong> data to<br />
assess unc<strong>on</strong>strained needs and to help<br />
prioritize investments.<br />
n Opti<strong>on</strong>s and Tradeoff Analysis: Does your<br />
agency have a process to evaluate <str<strong>on</strong>g>the</str<strong>on</strong>g><br />
investment tradeoffs and investment returns of<br />
alternate investment opti<strong>on</strong>s? One that<br />
c<strong>on</strong>siders <str<strong>on</strong>g>the</str<strong>on</strong>g> competing needs between different<br />
asset types (within preservati<strong>on</strong>) and between<br />
preservati<strong>on</strong> and o<str<strong>on</strong>g>the</str<strong>on</strong>g>r needs (e.g., expansi<strong>on</strong>,<br />
safety)?<br />
n Decisi<strong>on</strong> Making: What informati<strong>on</strong> sources and<br />
analyses do decisi<strong>on</strong>-makers rely <strong>on</strong> to allocate<br />
resources between competing uses? Asset<br />
management driven organizati<strong>on</strong>s utilize<br />
informati<strong>on</strong> garnered from <str<strong>on</strong>g>the</str<strong>on</strong>g> preceding steps.<br />
n Measurement: How do you measure “state of<br />
good repair” and your progress in attaining that<br />
goal? Does this measurement provide a clear<br />
target that can be defined as a “state of good<br />
repair”? Do you have incremental targets (toward<br />
that goal) for c<strong>on</strong>secutive three-to-five-year<br />
periods? 7<br />
Importantly, each of <str<strong>on</strong>g>the</str<strong>on</strong>g>se comp<strong>on</strong>ents is linked<br />
toge<str<strong>on</strong>g>the</str<strong>on</strong>g>r in a comprehensive asset management<br />
program, and relies <strong>on</strong> <str<strong>on</strong>g>the</str<strong>on</strong>g> joint participati<strong>on</strong> of<br />
various agency functi<strong>on</strong>s including engineering,<br />
budget, planning, IT and senior decisi<strong>on</strong>-makers.<br />
Moreover, many state DOTs are investing heavily in<br />
Enterprise Resource Planning (ERP) systems and<br />
7 Note: Transportati<strong>on</strong> agencies taking advantage of <str<strong>on</strong>g>the</str<strong>on</strong>g> “modified”<br />
accounting approach under GASB-34 are required to have an asset<br />
inventory, a c<strong>on</strong>diti<strong>on</strong> measurement system and clear c<strong>on</strong>diti<strong>on</strong><br />
attainment targets. As of 2002, nearly half of all state DOTs were using<br />
<str<strong>on</strong>g>the</str<strong>on</strong>g> modified GASB-34 method.<br />
25<br />
data warehouses to combine data from multiple<br />
agency sources into a centralized repository to<br />
facilitate both analysis and decisi<strong>on</strong>-making.<br />
r CURRENT TRANSIT INDUSTRY<br />
PRACTICES<br />
While most U.S. transit agencies have adopted some<br />
of <str<strong>on</strong>g>the</str<strong>on</strong>g> asset management comp<strong>on</strong>ents identified<br />
above, relatively few have initiated more<br />
comprehensive programs. The following is a very<br />
rough assessment of asset management as practiced<br />
by U.S. transit operators:<br />
Maintenance Management Systems: Most U.S.<br />
transit agencies utilize a maintenance management<br />
system (e.g., MAXIMO) to track and schedule<br />
maintenance activities for transit assets. While <str<strong>on</strong>g>the</str<strong>on</strong>g>y<br />
are designed for all asset types, most agencies <strong>on</strong>ly<br />
enter asset inventory data for <str<strong>on</strong>g>the</str<strong>on</strong>g>ir revenue vehicle<br />
fleets, repair equipment and maintenance facility<br />
comp<strong>on</strong>ents. Few agencies use <str<strong>on</strong>g>the</str<strong>on</strong>g>se systems for<br />
o<str<strong>on</strong>g>the</str<strong>on</strong>g>r asset types such as stati<strong>on</strong>s, tracti<strong>on</strong> power<br />
and train c<strong>on</strong>trol systems, or trackwork.<br />
Traditi<strong>on</strong>al Capital Reinvestment Planning: <strong>Transit</strong><br />
agencies’ engineering staff typically estimate capital<br />
reinvestment needs. Specifically, <str<strong>on</strong>g>the</str<strong>on</strong>g> engineering<br />
staff representing various categories of assets (e.g.,<br />
track, structures, facilities, vehicles) develop <str<strong>on</strong>g>the</str<strong>on</strong>g>ir<br />
own, independent assessments of <str<strong>on</strong>g>the</str<strong>on</strong>g> reinvestment<br />
needs for <str<strong>on</strong>g>the</str<strong>on</strong>g> assets <str<strong>on</strong>g>the</str<strong>on</strong>g>y represent. These needs are<br />
<str<strong>on</strong>g>the</str<strong>on</strong>g>n c<strong>on</strong>solidated across asset types and prioritized<br />
(subject to funding c<strong>on</strong>straints) based <strong>on</strong> fur<str<strong>on</strong>g>the</str<strong>on</strong>g>r input<br />
received from <str<strong>on</strong>g>the</str<strong>on</strong>g> engineers, <str<strong>on</strong>g>the</str<strong>on</strong>g> goals of <str<strong>on</strong>g>the</str<strong>on</strong>g><br />
organizati<strong>on</strong> (which may be implicit or explicit) and<br />
<str<strong>on</strong>g>the</str<strong>on</strong>g> judgment of decisi<strong>on</strong>-makers. This process is<br />
c<strong>on</strong>sistent with <str<strong>on</strong>g>the</str<strong>on</strong>g> asset management process<br />
described above as any comprehensive assessment<br />
of investment needs is impossible without input from<br />
agency engineers. At <str<strong>on</strong>g>the</str<strong>on</strong>g> same time, this process<br />
represents <strong>on</strong>ly a comp<strong>on</strong>ent of <str<strong>on</strong>g>the</str<strong>on</strong>g> full asset<br />
management process as it may lack an objective<br />
process for prioritizing needs (e.g., based <strong>on</strong><br />
generalized c<strong>on</strong>diti<strong>on</strong> measures) and may <strong>on</strong>ly reflect
<strong>Transit</strong> Asset Management<br />
short- to medium-term “tactical” needs (asset<br />
management is intended to have a l<strong>on</strong>g-term,<br />
strategic focus).<br />
C<strong>on</strong>diti<strong>on</strong> Assessments (periodic): Some major<br />
rail agencies have begun to c<strong>on</strong>duct periodic (e.g.,<br />
every five-to-ten years) system-wide c<strong>on</strong>diti<strong>on</strong><br />
assessments of all fixed assets. Such assessments<br />
can be thought of as independent “studies,” typically<br />
performed by outside c<strong>on</strong>tractors, and are used more<br />
as “snapshots” of current c<strong>on</strong>diti<strong>on</strong>s than an <strong>on</strong>going<br />
planning process. These assessments are a<br />
valuable input to <str<strong>on</strong>g>the</str<strong>on</strong>g> “traditi<strong>on</strong>al” capital reinvestment<br />
planning process described above.<br />
C<strong>on</strong>diti<strong>on</strong> Assessments (c<strong>on</strong>tinuous): In c<strong>on</strong>trast,<br />
o<str<strong>on</strong>g>the</str<strong>on</strong>g>r agencies assess <str<strong>on</strong>g>the</str<strong>on</strong>g>ir asset c<strong>on</strong>diti<strong>on</strong>s <strong>on</strong> a<br />
regular schedule, and to use this informati<strong>on</strong> within<br />
<str<strong>on</strong>g>the</str<strong>on</strong>g> c<strong>on</strong>text of an <strong>on</strong>going, l<strong>on</strong>g-term capital planning<br />
process. Agency engineering staff, not c<strong>on</strong>tractors,<br />
usually perform <str<strong>on</strong>g>the</str<strong>on</strong>g>se <strong>on</strong>going assessments. Given<br />
<str<strong>on</strong>g>the</str<strong>on</strong>g>ir c<strong>on</strong>tinuous nature, <str<strong>on</strong>g>the</str<strong>on</strong>g> c<strong>on</strong>diti<strong>on</strong> data provide a<br />
basis for assessing changes in asset c<strong>on</strong>diti<strong>on</strong>s over<br />
time and allow <str<strong>on</strong>g>the</str<strong>on</strong>g> agency to measure progress<br />
against <str<strong>on</strong>g>the</str<strong>on</strong>g>ir <strong>SGR</strong> goals.<br />
Decisi<strong>on</strong> Support Tools: Decisi<strong>on</strong> support tools are<br />
analytical processes and/or models used to estimate<br />
capital needs and model alternative investment<br />
scenarios over an extended time horiz<strong>on</strong>. These<br />
tools can be used to help prioritize specific<br />
investments, or to assess <str<strong>on</strong>g>the</str<strong>on</strong>g> impact of alternate<br />
funding level scenarios (e.g., how l<strong>on</strong>g will it take to<br />
attain a state of good repair under different funding<br />
levels?). A key value of <str<strong>on</strong>g>the</str<strong>on</strong>g>se tools is <str<strong>on</strong>g>the</str<strong>on</strong>g>ir ability to<br />
generate an objective analysis of agency needs<br />
across an extended time horiz<strong>on</strong>. Decisi<strong>on</strong> support<br />
tools are complements, not substitutes, for needs<br />
assessments by engineering staff; engineering needs<br />
analyses should be a key input to <str<strong>on</strong>g>the</str<strong>on</strong>g> decisi<strong>on</strong><br />
support tool.<br />
26<br />
Examples of <strong>Transit</strong> Decisi<strong>on</strong> Support Tools<br />
While decisi<strong>on</strong> support tools are not widely used by<br />
transit operators, several agencies have developed<br />
such tools with successful results and some have<br />
used <str<strong>on</strong>g>the</str<strong>on</strong>g>se tools to justify increased funding requests<br />
from local and state funding agencies. Examples<br />
include MBTA’s State of Good Repair Model,<br />
Chicago RTA’s Capital Asset Model, Illinois DOT’s<br />
Downstate <strong>Transit</strong> Capital Needs Model, and FTA’s<br />
<strong>Transit</strong> Ec<strong>on</strong>omic Requirements Model (TERM).<br />
Asset Inventory: Most comp<strong>on</strong>ents of transit asset<br />
management described here depend <strong>on</strong> <str<strong>on</strong>g>the</str<strong>on</strong>g><br />
availability of a current and comprehensive inventory<br />
of an agency’s major transit assets. This asset<br />
inventory should be organized around <str<strong>on</strong>g>the</str<strong>on</strong>g> assets’<br />
engineering and capital characteristics, separate and<br />
distinct from a fixed asset ledger used for accounting<br />
purposes. Inventory data can be collected as part of<br />
<strong>on</strong>going or periodic c<strong>on</strong>diti<strong>on</strong> assessments and can<br />
also be useful in analyzing that data <strong>on</strong> a systematic<br />
basis (e.g., for coordinated project planning). At this<br />
point, relatively few U.S. transit agencies actively<br />
maintain a comprehensive asset inventory for <str<strong>on</strong>g>the</str<strong>on</strong>g><br />
purpose of asset management.
Tradeoff Analysis: While most U.S. transit operators<br />
actively c<strong>on</strong>sider <str<strong>on</strong>g>the</str<strong>on</strong>g> expected impacts of differing<br />
investment scenarios, few have developed ei<str<strong>on</strong>g>the</str<strong>on</strong>g>r a<br />
clear set of prioritizati<strong>on</strong> objectives or a well-defined<br />
prioritizati<strong>on</strong> process. From an asset management<br />
perspective, a well-defined and objective prioritizati<strong>on</strong><br />
process is required to ensure that scarce capital<br />
dollars are directed towards those investments that<br />
do <str<strong>on</strong>g>the</str<strong>on</strong>g> most to support <str<strong>on</strong>g>the</str<strong>on</strong>g> agency’s overall goals and<br />
objectives (e.g., maximize service reliability, safety<br />
and/or quality of service). In practice, <str<strong>on</strong>g>the</str<strong>on</strong>g>se can<br />
c<strong>on</strong>sist of point-based ranking systems, well-defined<br />
internal review processes (with representati<strong>on</strong> from<br />
engineering, planning, capital budgeting staff and<br />
senior management), or combinati<strong>on</strong>s of similar<br />
approaches. This is in c<strong>on</strong>trast to more traditi<strong>on</strong>al<br />
agency approaches where engineering staff<br />
representing different asset classes (e.g., facilities,<br />
maintenance-of-way, vehicles, or structures) develop<br />
independent needs assessments for <str<strong>on</strong>g>the</str<strong>on</strong>g> asset groups<br />
<str<strong>on</strong>g>the</str<strong>on</strong>g>y represent and <str<strong>on</strong>g>the</str<strong>on</strong>g>n effectively compete for<br />
access to a limited pot of funding. Once again, <str<strong>on</strong>g>the</str<strong>on</strong>g><br />
objective of asset management is to replace <str<strong>on</strong>g>the</str<strong>on</strong>g><br />
implicit and potentially subjective investment<br />
prioritizati<strong>on</strong> of this more traditi<strong>on</strong>al process with a<br />
well-defined and objective prioritizati<strong>on</strong> process<br />
designed to directly support overall organizati<strong>on</strong>al<br />
objectives. Within <str<strong>on</strong>g>the</str<strong>on</strong>g> transit industry, <str<strong>on</strong>g>the</str<strong>on</strong>g>se<br />
processes can be and have been supported by<br />
decisi<strong>on</strong> support tools that facilitate <str<strong>on</strong>g>the</str<strong>on</strong>g> analysis of<br />
<str<strong>on</strong>g>the</str<strong>on</strong>g> service and state of good repair implicati<strong>on</strong>s of<br />
alternative prioritizati<strong>on</strong> ranking schemes.<br />
Linking IT Systems: Many state DOTs are currently<br />
working to link various asset inventory, c<strong>on</strong>diti<strong>on</strong><br />
assessment, maintenance management, accounting<br />
system and related databases to create informati<strong>on</strong><br />
warehouses to support asset management,<br />
sometimes called Enterprise Resource Planning<br />
(ERP) systems. The objective is to co-locate all data<br />
relevant to <str<strong>on</strong>g>the</str<strong>on</strong>g> asset management processes to<br />
facilitate analysis of current c<strong>on</strong>diti<strong>on</strong>s and future<br />
27<br />
needs. Few if any transit agencies have attempted to<br />
link multiple data sources for <str<strong>on</strong>g>the</str<strong>on</strong>g> purpose of asset<br />
management. A natural starting point to do so would<br />
be to combine data from asset inventories, c<strong>on</strong>diti<strong>on</strong><br />
assessments, maintenance management systems,<br />
track geometry readings, slow track z<strong>on</strong>es, and<br />
perhaps <str<strong>on</strong>g>the</str<strong>on</strong>g> fixed asset ledger.<br />
r WHAT CAN AGENCIES LEARN FROM<br />
ASSET MANAGEMENT?<br />
Effective asset management provides decisi<strong>on</strong>makers<br />
with reliable informati<strong>on</strong> <strong>on</strong>:<br />
n Current asset c<strong>on</strong>diti<strong>on</strong>s;<br />
n The investment required to maintain or improve<br />
those c<strong>on</strong>diti<strong>on</strong>s (e.g., to a state of good repair);<br />
and<br />
n How variati<strong>on</strong>s in funding will impact an agency’s<br />
ability to address investment needs over various<br />
time horiz<strong>on</strong>s.<br />
Asset management also helps decisi<strong>on</strong>-makers<br />
prioritize investment needs such that <str<strong>on</strong>g>the</str<strong>on</strong>g> highest<br />
return investments are addressed first (e.g., those<br />
with <str<strong>on</strong>g>the</str<strong>on</strong>g> highest benefits to <str<strong>on</strong>g>the</str<strong>on</strong>g> largest number of<br />
transit riders). The following is a good example of<br />
how asset management systems provide valuable<br />
informati<strong>on</strong> to decisi<strong>on</strong>-makers. Below are four<br />
charts displaying output from a transit agency asset<br />
management decisi<strong>on</strong> support tool. Specifically,<br />
<str<strong>on</strong>g>the</str<strong>on</strong>g>se four charts dem<strong>on</strong>strate how variati<strong>on</strong>s in<br />
funding availability will impact that agency’s total<br />
investment backlog. Following are descripti<strong>on</strong>s of<br />
each chart:<br />
n Years to Address Current Backlog<br />
(Unc<strong>on</strong>strained): this chart presents <str<strong>on</strong>g>the</str<strong>on</strong>g><br />
magnitude of <str<strong>on</strong>g>the</str<strong>on</strong>g> current backlog, and <str<strong>on</strong>g>the</str<strong>on</strong>g> years<br />
to address <str<strong>on</strong>g>the</str<strong>on</strong>g> backlog assuming funding is<br />
unc<strong>on</strong>strained.
<strong>Transit</strong> Asset Management<br />
Years to Address Current Backlog if Funding is<br />
Unc<strong>on</strong>strained<br />
n Maintain Current Funding Levels – what<br />
happens to <str<strong>on</strong>g>the</str<strong>on</strong>g> size of <str<strong>on</strong>g>the</str<strong>on</strong>g> backlog if funding<br />
remains at current levels? For this agency, <str<strong>on</strong>g>the</str<strong>on</strong>g><br />
backlog is expected to grow if funding remains<br />
unchanged. Note that <str<strong>on</strong>g>the</str<strong>on</strong>g> rate of growth in <str<strong>on</strong>g>the</str<strong>on</strong>g><br />
backlog is predictable as is its expected impact<br />
<strong>on</strong> c<strong>on</strong>diti<strong>on</strong>s and performance – all valuable<br />
informati<strong>on</strong> to agency decisi<strong>on</strong>-makers.<br />
Backlog if Current Funding Levels Remain<br />
Unchanged ($410m/yr)<br />
n Maintain Current C<strong>on</strong>diti<strong>on</strong>s – what level of<br />
investment is required to maintain current asset<br />
c<strong>on</strong>diti<strong>on</strong>s? This assumes that <str<strong>on</strong>g>the</str<strong>on</strong>g> status quo is a<br />
desirable investment target (which is not <str<strong>on</strong>g>the</str<strong>on</strong>g> case<br />
if <str<strong>on</strong>g>the</str<strong>on</strong>g> agency is at less than a state of good<br />
repair). This chart presents variati<strong>on</strong>s in <str<strong>on</strong>g>the</str<strong>on</strong>g><br />
backlog over time assuming sufficient funding<br />
such that <str<strong>on</strong>g>the</str<strong>on</strong>g> backlog in twenty years is <str<strong>on</strong>g>the</str<strong>on</strong>g> same<br />
as it is today.<br />
28<br />
Funding to Maintain Current Backlog ($470m/yr)<br />
n Eliminate Backlog in Twenty Years – what<br />
annual investment is required to fully address <str<strong>on</strong>g>the</str<strong>on</strong>g><br />
current backlog and attain a complete state of<br />
good repair in twenty years? Armed with this type<br />
of informati<strong>on</strong>, decisi<strong>on</strong>-makers can approach<br />
funding partners with specific details <strong>on</strong><br />
investment targets and <str<strong>on</strong>g>the</str<strong>on</strong>g> time and resources<br />
required to attain each target.<br />
Investment Required to Eliminate Backlog in<br />
Twenty Years ($620m/yr)<br />
r LIMITATIONS OF ASSET<br />
MANAGEMENT<br />
While effective asset management provides a<br />
powerful tool for improving <str<strong>on</strong>g>the</str<strong>on</strong>g> quality of capital<br />
investment decisi<strong>on</strong>s, it is not intended (nor is it<br />
capable of) addressing all agency needs.<br />
Specifically, total asset management is most effective<br />
in ensuring that limited funds (for<br />
rehabilitati<strong>on</strong>/replacement, expansi<strong>on</strong>, operati<strong>on</strong>s,
safety and o<str<strong>on</strong>g>the</str<strong>on</strong>g>r uses) are channeled towards <str<strong>on</strong>g>the</str<strong>on</strong>g>ir<br />
most effective uses – with funding allocati<strong>on</strong><br />
decisi<strong>on</strong>s based <strong>on</strong> sound informati<strong>on</strong> and welldefined<br />
and objective decisi<strong>on</strong>-making processes.<br />
Hence, asset management can very much help<br />
agencies make more effective use of existing agency<br />
resources.<br />
It is not, however, designed to expand <str<strong>on</strong>g>the</str<strong>on</strong>g> amount of<br />
available resources (e.g., operating and investment<br />
funds). With that in mind, it should be noted that good<br />
quality asset management practices arm <str<strong>on</strong>g>the</str<strong>on</strong>g> agency<br />
with superior informati<strong>on</strong> to help justify <str<strong>on</strong>g>the</str<strong>on</strong>g> reas<strong>on</strong>ing<br />
behind <str<strong>on</strong>g>the</str<strong>on</strong>g>ir funding requests as well as <str<strong>on</strong>g>the</str<strong>on</strong>g> ability to<br />
dem<strong>on</strong>strate how additi<strong>on</strong>al funds can lead directly to<br />
improvements in service quality, reliability and safety.<br />
Given this informati<strong>on</strong>, funding agencies are more<br />
likely to c<strong>on</strong>sider reallocating existing funds or<br />
developing new funding capacity in resp<strong>on</strong>se to this<br />
improved understanding (this has been <str<strong>on</strong>g>the</str<strong>on</strong>g> case for<br />
several state DOTs).<br />
r OBSERVATIONS FROM <strong>SGR</strong><br />
WORKSHOP<br />
The <strong>SGR</strong> Workshop yielded a number of<br />
observati<strong>on</strong>s and valuable perspectives with respect<br />
to both <str<strong>on</strong>g>the</str<strong>on</strong>g> applicati<strong>on</strong> and <str<strong>on</strong>g>the</str<strong>on</strong>g> effectiveness of asset<br />
management processes. Following are several key<br />
observati<strong>on</strong>s.<br />
Data – Asset Inventories: Many of <str<strong>on</strong>g>the</str<strong>on</strong>g> nati<strong>on</strong>’s<br />
larger transit agencies now possess asset inventories<br />
developed specifically for <str<strong>on</strong>g>the</str<strong>on</strong>g> purpose of capital<br />
planning and o<str<strong>on</strong>g>the</str<strong>on</strong>g>r asset management activities.<br />
Those agencies that have collected and maintained<br />
such asset inventories have benefited from a clearer<br />
understanding of both <str<strong>on</strong>g>the</str<strong>on</strong>g>ir current asset c<strong>on</strong>diti<strong>on</strong>s<br />
and <str<strong>on</strong>g>the</str<strong>on</strong>g>ir l<strong>on</strong>g-term capital reinvestment needs. At <str<strong>on</strong>g>the</str<strong>on</strong>g><br />
same time, most agencies rarely used direct analysis<br />
of <str<strong>on</strong>g>the</str<strong>on</strong>g>ir asset inventories to make precise, financiallyc<strong>on</strong>strained<br />
funding decisi<strong>on</strong>s for <str<strong>on</strong>g>the</str<strong>on</strong>g>ir short-term<br />
capital programs.<br />
29<br />
It was also recognized that FTA would benefit from a<br />
reporting process <strong>on</strong> <str<strong>on</strong>g>the</str<strong>on</strong>g> age and c<strong>on</strong>diti<strong>on</strong> of <str<strong>on</strong>g>the</str<strong>on</strong>g><br />
nati<strong>on</strong>’s inventory of transit assets, again for <str<strong>on</strong>g>the</str<strong>on</strong>g><br />
purpose of more accurate needs assessments and<br />
funding analysis at <str<strong>on</strong>g>the</str<strong>on</strong>g> nati<strong>on</strong>al level.<br />
Investment Prioritizati<strong>on</strong>: The participants<br />
observed that most agencies tend to favor<br />
reinvestment in some asset types versus o<str<strong>on</strong>g>the</str<strong>on</strong>g>rs. For<br />
example, “missi<strong>on</strong> critical” asset types like vehicle<br />
fleets tend to receive <str<strong>on</strong>g>the</str<strong>on</strong>g> highest priority whereas<br />
“less critical” assets such as maintenance facilities<br />
and stati<strong>on</strong> amenities tend to receive lower<br />
prioritizati<strong>on</strong>. Note, however, that few agencies<br />
employed ordinal ranking processes or o<str<strong>on</strong>g>the</str<strong>on</strong>g>r<br />
methods to prioritize <str<strong>on</strong>g>the</str<strong>on</strong>g>ir capital reinvestment needs.<br />
Ra<str<strong>on</strong>g>the</str<strong>on</strong>g>r, most reinvestment activities c<strong>on</strong>tinue to be<br />
prioritized based <strong>on</strong> a meeting and negotiati<strong>on</strong><br />
process between agency departments. Many<br />
agencies do not prioritize <str<strong>on</strong>g>the</str<strong>on</strong>g>ir investments between<br />
expansi<strong>on</strong>, rehabilitati<strong>on</strong> and o<str<strong>on</strong>g>the</str<strong>on</strong>g>r uses. Ra<str<strong>on</strong>g>the</str<strong>on</strong>g>r, <str<strong>on</strong>g>the</str<strong>on</strong>g>y<br />
c<strong>on</strong>tinue to utilize <str<strong>on</strong>g>the</str<strong>on</strong>g> same historical funding<br />
allocati<strong>on</strong>s between <str<strong>on</strong>g>the</str<strong>on</strong>g>se uses from <strong>on</strong>e year to <str<strong>on</strong>g>the</str<strong>on</strong>g><br />
next. Participants also noted that short-term<br />
investment prioritizati<strong>on</strong> depends <strong>on</strong> <str<strong>on</strong>g>the</str<strong>on</strong>g> logical<br />
phasing and scoping of related capital projects (e.g.,<br />
reinvestment activities within a given rail segment),<br />
since this is how an asset management plan<br />
becomes acti<strong>on</strong>able projects.<br />
Decisi<strong>on</strong> Support Tools: Relatively few participants<br />
noted <str<strong>on</strong>g>the</str<strong>on</strong>g> use of decisi<strong>on</strong> support tools as a means of<br />
assessing and prioritizing l<strong>on</strong>g-term <strong>SGR</strong> needs, but<br />
all expressed interest in learning more about <str<strong>on</strong>g>the</str<strong>on</strong>g><br />
development, use, benefits and limitati<strong>on</strong>s of such<br />
tools. Those that do use such tools found <str<strong>on</strong>g>the</str<strong>on</strong>g>m<br />
effective in answering “what-if” questi<strong>on</strong>s regarding<br />
<str<strong>on</strong>g>the</str<strong>on</strong>g> impact of varying funding levels <strong>on</strong> current and<br />
future asset c<strong>on</strong>diti<strong>on</strong>s and service quality. These<br />
participants also reported using <str<strong>on</strong>g>the</str<strong>on</strong>g>ir needs<br />
assessments and decisi<strong>on</strong> support tools to justify and<br />
advocate for a shift in available funds from expansi<strong>on</strong><br />
to <strong>SGR</strong> uses, or to reprioritize funds to assets with<br />
<str<strong>on</strong>g>the</str<strong>on</strong>g> highest reinvestment benefits.
<strong>Transit</strong> Asset Management<br />
r ISSUES REMAINING<br />
Following are some additi<strong>on</strong>al questi<strong>on</strong>s for <str<strong>on</strong>g>the</str<strong>on</strong>g><br />
industry to address with respect to asset<br />
management techniques and <str<strong>on</strong>g>the</str<strong>on</strong>g> attainment of a<br />
state of good repair:<br />
n How are transit agencies currently defining <str<strong>on</strong>g>the</str<strong>on</strong>g><br />
term “asset management”? Are <str<strong>on</strong>g>the</str<strong>on</strong>g>ir working<br />
definiti<strong>on</strong>s based <strong>on</strong> short- or l<strong>on</strong>g-term<br />
objectives? Are <str<strong>on</strong>g>the</str<strong>on</strong>g>y focused <strong>on</strong> strategic or just<br />
tactical issues?<br />
n How many U.S. agencies have implemented<br />
asset management programs? What do <str<strong>on</strong>g>the</str<strong>on</strong>g>se<br />
programs c<strong>on</strong>sist of?<br />
n How many agencies c<strong>on</strong>duct ei<str<strong>on</strong>g>the</str<strong>on</strong>g>r periodic or<br />
c<strong>on</strong>tinuous c<strong>on</strong>diti<strong>on</strong> assessments (if so, which<br />
and how often)?<br />
30<br />
n How many agencies actively maintain an asset<br />
inventory in support of asset management<br />
practices (i.e., distinct from <str<strong>on</strong>g>the</str<strong>on</strong>g>ir fixed asset<br />
ledger)?<br />
n How many agencies use decisi<strong>on</strong> support tools<br />
to support <str<strong>on</strong>g>the</str<strong>on</strong>g>ir capital planning processes and<br />
decisi<strong>on</strong>-making?<br />
n How are agencies determining how capital<br />
reinvestment funds will be allocated between<br />
various asset types/uses? Who participates in<br />
making <str<strong>on</strong>g>the</str<strong>on</strong>g>se decisi<strong>on</strong>s and what processes do<br />
<str<strong>on</strong>g>the</str<strong>on</strong>g>y use?<br />
n How many agencies have specific capital<br />
investment objectives (e.g., to attain a state of<br />
good repair by 2015)?
Preventive Maintenance<br />
r OVERVIEW<br />
The current ec<strong>on</strong>omic climate has had a significant<br />
impact <strong>on</strong> many companies and organizati<strong>on</strong>s in both<br />
<str<strong>on</strong>g>the</str<strong>on</strong>g> public and private sectors throughout <str<strong>on</strong>g>the</str<strong>on</strong>g> country.<br />
<strong>Transit</strong> systems are not immune to <str<strong>on</strong>g>the</str<strong>on</strong>g>se impacts.<br />
The increases in <str<strong>on</strong>g>the</str<strong>on</strong>g> cost of petroleum-based fuels<br />
have c<strong>on</strong>tributed to unprecedented ridership<br />
increases <strong>on</strong> many of our nati<strong>on</strong>’s transit systems<br />
over <str<strong>on</strong>g>the</str<strong>on</strong>g> course of <str<strong>on</strong>g>the</str<strong>on</strong>g> past year. However, <str<strong>on</strong>g>the</str<strong>on</strong>g>se<br />
unexpected increases in fuel costs have also strained<br />
<str<strong>on</strong>g>the</str<strong>on</strong>g> budgets of <str<strong>on</strong>g>the</str<strong>on</strong>g> transit systems. In additi<strong>on</strong>, <str<strong>on</strong>g>the</str<strong>on</strong>g><br />
downturn in c<strong>on</strong>sumer spending has reduced <str<strong>on</strong>g>the</str<strong>on</strong>g><br />
sales tax revenues that many transit systems rely <strong>on</strong><br />
as an essential comp<strong>on</strong>ent of <str<strong>on</strong>g>the</str<strong>on</strong>g>ir budgets. Our<br />
nati<strong>on</strong>’s transit systems are faced with attempting to<br />
satisfy this increased demand with fewer resources.<br />
This ec<strong>on</strong>omic climate is prompting every<strong>on</strong>e,<br />
including public transit agencies, to rethink current<br />
practices and business methods, and it is prompting<br />
public transit agencies to strive for productivity<br />
improvements and efficiency gains to be better,<br />
faster, and cheaper.<br />
The paper will review maintenance and preventive<br />
maintenance (PM) practices from <str<strong>on</strong>g>the</str<strong>on</strong>g> following<br />
perspectives:<br />
n What proporti<strong>on</strong> of agency resources are<br />
devoted to maintenance activities?<br />
n What opti<strong>on</strong>s do agencies have to make more<br />
productive use of <str<strong>on</strong>g>the</str<strong>on</strong>g>se resources?<br />
n How can better preventive maintenance practices<br />
reduce o<str<strong>on</strong>g>the</str<strong>on</strong>g>r maintenance needs as well as o<str<strong>on</strong>g>the</str<strong>on</strong>g>r<br />
agency costs?<br />
n Should <str<strong>on</strong>g>the</str<strong>on</strong>g> industry adopt standardized<br />
requirements for preventive maintenance?<br />
Standards for Preventive Maintenance<br />
FTA State of Good Repair Workshop<br />
31<br />
n How do PM practices impact asset c<strong>on</strong>diti<strong>on</strong>s<br />
and state of good repair needs?<br />
r BACKGROUND<br />
<strong>Transit</strong> agencies typically devote a large proporti<strong>on</strong> of<br />
<str<strong>on</strong>g>the</str<strong>on</strong>g>ir resources to preventive maintenance, which<br />
also makes PM activities a frequent target for cost<br />
reducti<strong>on</strong> exercises. This paper argues that ra<str<strong>on</strong>g>the</str<strong>on</strong>g>r<br />
than increasing or decreasing PM expenditures, a<br />
better approach is to find ways to improve <str<strong>on</strong>g>the</str<strong>on</strong>g><br />
productivity of <str<strong>on</strong>g>the</str<strong>on</strong>g>se resources, most notably by<br />
applying better planned preventive maintenance<br />
activities.<br />
Maintenance department budgets are typically <str<strong>on</strong>g>the</str<strong>on</strong>g><br />
sec<strong>on</strong>d largest comp<strong>on</strong>ent of <str<strong>on</strong>g>the</str<strong>on</strong>g> total operating costs<br />
of a transit system (see chart below based <strong>on</strong><br />
Nati<strong>on</strong>al <strong>Transit</strong> Database data over <str<strong>on</strong>g>the</str<strong>on</strong>g> period 1995<br />
through 2006). Over <str<strong>on</strong>g>the</str<strong>on</strong>g> past decade, roughly 18<br />
percent of agencies’ operating budget resources<br />
have been devoted to vehicle maintenance and an<br />
additi<strong>on</strong>al 9 percent to n<strong>on</strong>-vehicle maintenance<br />
activities – for a total of 27 percent, or more than <strong>on</strong>equarter<br />
of <str<strong>on</strong>g>the</str<strong>on</strong>g> operating budget devoted to<br />
maintenance costs (excluding maintenance costs for<br />
purchased transportati<strong>on</strong>).<br />
<strong>Transit</strong> Agency Operating Budget: By Share<br />
Purchased<br />
Transportati<strong>on</strong><br />
14%<br />
Administrati<strong>on</strong><br />
13%<br />
N<strong>on</strong>-Vehicle<br />
Maintenance<br />
9%<br />
Vehicle<br />
Maintenance<br />
18%<br />
Vehicle<br />
Operati<strong>on</strong>s<br />
46%
Preventive Maintenance<br />
Number of maintenance department employees is<br />
also typically sec<strong>on</strong>d <strong>on</strong>ly to vehicle operati<strong>on</strong>s (see<br />
chart below, again derived from NTD data over <str<strong>on</strong>g>the</str<strong>on</strong>g><br />
period 1995 to 2006). Here again, <str<strong>on</strong>g>the</str<strong>on</strong>g> same<br />
proporti<strong>on</strong>s of agency operati<strong>on</strong>s (as distinct from<br />
capital) resources have been devoted to <str<strong>on</strong>g>the</str<strong>on</strong>g><br />
maintenance of both vehicle and n<strong>on</strong>-vehicle assets<br />
over <str<strong>on</strong>g>the</str<strong>on</strong>g> decade.<br />
Finally, not including fuel, materials and supply costs<br />
represent 11.3% 8 of a transit agency’s budget. Note<br />
that all of <str<strong>on</strong>g>the</str<strong>on</strong>g>se statistics have remained relatively<br />
c<strong>on</strong>sistent for <str<strong>on</strong>g>the</str<strong>on</strong>g> past decade.<br />
<strong>Transit</strong> Agency Operating Staff: By Share<br />
Administrati<strong>on</strong><br />
10%<br />
N<strong>on</strong>-Vehicle<br />
Maintenance<br />
9%<br />
Vehicle<br />
Maintenance<br />
18%<br />
Vehicle<br />
Operati<strong>on</strong>s<br />
63%<br />
The nature of public transit agency operati<strong>on</strong>s<br />
requires that transit agencies c<strong>on</strong>tinually strive to do<br />
more with less. Tight operating budgets force transit<br />
agencies to c<strong>on</strong>tinually look closely at productivity<br />
improvements without compromising safety and<br />
quality. In order to have a meaningful impact <strong>on</strong><br />
reducing expenses, without cutting service, transit<br />
agencies frequently look to realizing greater<br />
efficiencies in maintenance. The maintenance<br />
budget, <str<strong>on</strong>g>the</str<strong>on</strong>g>refore, is a frequent target for cost<br />
reducti<strong>on</strong>s.<br />
The questi<strong>on</strong> remains <str<strong>on</strong>g>the</str<strong>on</strong>g>n as to how increases or<br />
decreases to maintenance budgets and resources<br />
can be expected to impact <str<strong>on</strong>g>the</str<strong>on</strong>g> reliability, safety and<br />
overall quality of transit services. Moreover, as<br />
discussed below, reduced resource availability for<br />
8 2006 Nati<strong>on</strong>al <strong>Transit</strong> Database<br />
32<br />
maintenance activities – in particular those relating to<br />
preventive maintenance – can result in cost<br />
increases for o<str<strong>on</strong>g>the</str<strong>on</strong>g>r agency activities, including<br />
unscheduled maintenance, operating costs (e.g., fuel<br />
c<strong>on</strong>sumpti<strong>on</strong>) and even capital costs (e.g., in <str<strong>on</strong>g>the</str<strong>on</strong>g> form<br />
of reduced asset life expectancy).<br />
r APPROACHES<br />
There are important similarities am<strong>on</strong>g infrastructure<br />
intensive industries. The airlines, trucking, utilities,<br />
etc., industries all share something in comm<strong>on</strong>:<br />
critical extensive assets that must be maintained in a<br />
state of good repair. Maintenance productivity<br />
c<strong>on</strong>cepts, in varying forms, have always been<br />
around. Early <strong>on</strong>, to realize savings and greater<br />
efficiencies <str<strong>on</strong>g>the</str<strong>on</strong>g>se industries were compelled to set<br />
time standards for repetitive maintenance tasks,<br />
preventive maintenance programs, and repair<br />
functi<strong>on</strong>s. Repair times and written procedures for<br />
maintenance tasks were established and provided as<br />
productivity improvement tools.<br />
Maintenance activities can be classified in two<br />
general categories: scheduled or unscheduled.<br />
n Scheduled maintenance c<strong>on</strong>sists of planned<br />
activities including Preventive Maintenance<br />
inspecti<strong>on</strong>s, planned comp<strong>on</strong>ent repair or<br />
replacement, driver defect cards, and o<str<strong>on</strong>g>the</str<strong>on</strong>g>r<br />
planned inspecti<strong>on</strong>s.<br />
n Unscheduled maintenance activities result from<br />
breakdowns caused by comp<strong>on</strong>ent failures and<br />
from defects found during scheduled inspecti<strong>on</strong>s.<br />
Although unscheduled maintenance can never<br />
be eliminated, its frequency and durati<strong>on</strong> can be<br />
c<strong>on</strong>trolled.<br />
Moving maintenance into <str<strong>on</strong>g>the</str<strong>on</strong>g> scheduled category<br />
gives managers greater c<strong>on</strong>trol and improves <str<strong>on</strong>g>the</str<strong>on</strong>g><br />
structure of <str<strong>on</strong>g>the</str<strong>on</strong>g>ir operati<strong>on</strong>s. The key to reducing<br />
unscheduled maintenance activities is having good<br />
data and using it to make decisi<strong>on</strong>s. Reducing<br />
unscheduled maintenance can save m<strong>on</strong>ey.<br />
Replacing comp<strong>on</strong>ents before <str<strong>on</strong>g>the</str<strong>on</strong>g>y fail reduces <str<strong>on</strong>g>the</str<strong>on</strong>g><br />
incidences of unscheduled maintenance; however,
comp<strong>on</strong>ent life must be optimized to reduce costs.<br />
Replacing comp<strong>on</strong>ents at failure increases <str<strong>on</strong>g>the</str<strong>on</strong>g><br />
frequency of unplanned maintenance.<br />
Maintenance Management Systems: The advent of<br />
computerized maintenance record-keeping facilitated<br />
data collecti<strong>on</strong>, analysis, and informati<strong>on</strong><br />
disseminati<strong>on</strong>, and supported faster problem solving.<br />
More reliable data provided <str<strong>on</strong>g>the</str<strong>on</strong>g> tools to better<br />
balance costs and performance. Computerized<br />
maintenance and materials management systems<br />
were first developed and deployed in <str<strong>on</strong>g>the</str<strong>on</strong>g> private<br />
sector. Gradually <str<strong>on</strong>g>the</str<strong>on</strong>g>se programs were modified and<br />
adapted to <str<strong>on</strong>g>the</str<strong>on</strong>g> transit industry. Some were adapted<br />
or developed specifically for transit agencies. Early<br />
adaptors were <str<strong>on</strong>g>the</str<strong>on</strong>g> Chicago <strong>Transit</strong> Authority, and<br />
Sou<str<strong>on</strong>g>the</str<strong>on</strong>g>rn California Regi<strong>on</strong>al <strong>Transit</strong> District.<br />
Typically <str<strong>on</strong>g>the</str<strong>on</strong>g> early software systems were work order<br />
systems, limited and designed primarily to collect<br />
data. They were generally not used to manage<br />
maintenance activities.<br />
Since <str<strong>on</strong>g>the</str<strong>on</strong>g> 1980s and 1990s, when <str<strong>on</strong>g>the</str<strong>on</strong>g>se systems<br />
were first installed, a sec<strong>on</strong>d generati<strong>on</strong> of<br />
computerized maintenance and materials<br />
management systems have been installed at many<br />
transit agencies around <str<strong>on</strong>g>the</str<strong>on</strong>g> country. These systems<br />
have extensive functi<strong>on</strong>ality and have been employed<br />
to realize efficiencies and reduce costs without a<br />
corresp<strong>on</strong>ding increase in unscheduled maintenance.<br />
Successful examples of where data is being used to<br />
better plan maintenance activities, include: UPS and<br />
Ryder, where <str<strong>on</strong>g>the</str<strong>on</strong>g>y are using informati<strong>on</strong> to schedule<br />
all aspects of <str<strong>on</strong>g>the</str<strong>on</strong>g> maintenance operati<strong>on</strong>. During a<br />
recent FTA-funded educati<strong>on</strong>al tour of Europe, it was<br />
found that Berlin <strong>Transit</strong> (BVG) has relied <strong>on</strong> a<br />
computerized maintenance and materials<br />
management system for 9 years to meet its<br />
maintenance tracking needs. The system enables<br />
BVG to capture <str<strong>on</strong>g>the</str<strong>on</strong>g> life cycle cost, reliability,<br />
availability, and safety informati<strong>on</strong> about vehicles and<br />
related transit equipment. Its capabilities for failure<br />
analysis help BVG identify potential problems before<br />
<str<strong>on</strong>g>the</str<strong>on</strong>g>y arise. The system provides BVG pers<strong>on</strong>nel<br />
mean time and distance-between-failures data that<br />
support this effort. Metropolitan <strong>Transit</strong> Authority<br />
33<br />
(MTA) New York City <strong>Transit</strong> has successfully utilized<br />
a computerized maintenance and materials<br />
management system to increase mean distance<br />
between failures of its subway cars to approximately<br />
150,000 miles.<br />
r PREVENTIVE MAINTENANCE<br />
STANDARDS<br />
Should <str<strong>on</strong>g>the</str<strong>on</strong>g> transit industry adopt comm<strong>on</strong> PM<br />
standards and, if so, who should develop <str<strong>on</strong>g>the</str<strong>on</strong>g>se<br />
standards, <strong>on</strong> what basis, and should <str<strong>on</strong>g>the</str<strong>on</strong>g>re be<br />
incentives for agencies to adopt <str<strong>on</strong>g>the</str<strong>on</strong>g>se comm<strong>on</strong><br />
standards?<br />
At present, all U.S. transit providers have basic or<br />
core PM programs for revenue vehicle fleets as well<br />
as for most o<str<strong>on</strong>g>the</str<strong>on</strong>g>r major asset types 9 . Examples of<br />
<str<strong>on</strong>g>the</str<strong>on</strong>g> parameters for <str<strong>on</strong>g>the</str<strong>on</strong>g>se basic programs include:<br />
n Vehicles: Periodic inspecti<strong>on</strong>s and maintenance<br />
activities based <strong>on</strong> mileage.<br />
n Building Comp<strong>on</strong>ents and Systems: Periodic<br />
maintenance based <strong>on</strong> ei<str<strong>on</strong>g>the</str<strong>on</strong>g>r manufacturer<br />
recommended or agency developed PM<br />
programs.<br />
It is important to note, however, that <str<strong>on</strong>g>the</str<strong>on</strong>g>se activities<br />
are far from standardized. Hence both <str<strong>on</strong>g>the</str<strong>on</strong>g> (1) length<br />
between (or frequency of) <str<strong>on</strong>g>the</str<strong>on</strong>g>se inspecti<strong>on</strong> periods<br />
and (2) <str<strong>on</strong>g>the</str<strong>on</strong>g> types of scheduled PM inspecti<strong>on</strong> and<br />
maintenance activities performed during each PM<br />
cycle can and do vary widely between transit<br />
agencies. For example, it is certainly <str<strong>on</strong>g>the</str<strong>on</strong>g> case that<br />
some agencies perform <str<strong>on</strong>g>the</str<strong>on</strong>g>ir PM activities with<br />
relatively low frequency but c<strong>on</strong>duct a relatively high<br />
number of maintenance activities for each cycle,<br />
while o<str<strong>on</strong>g>the</str<strong>on</strong>g>rs c<strong>on</strong>duct <str<strong>on</strong>g>the</str<strong>on</strong>g>ir PM activities more<br />
frequently but include lower maintenance activities<br />
within each cycle.<br />
A good example here is PM inspecti<strong>on</strong> programs for<br />
forty-foot buses (with forty-foot buses being by far <str<strong>on</strong>g>the</str<strong>on</strong>g><br />
9 Note that FTA requires grantees to have established PM programs for assets<br />
purchased using <strong>Federal</strong> funds. However, this requirement says little about <str<strong>on</strong>g>the</str<strong>on</strong>g><br />
specifics of <str<strong>on</strong>g>the</str<strong>on</strong>g> PM program, <strong>on</strong>ly that <str<strong>on</strong>g>the</str<strong>on</strong>g> program must be in place.
Preventive Maintenance<br />
most comm<strong>on</strong> and, perhaps, best understood type of<br />
transit asset and hence best positi<strong>on</strong>ed for PM<br />
standardizati<strong>on</strong>). Over <str<strong>on</strong>g>the</str<strong>on</strong>g> period 1999 to 2002, <str<strong>on</strong>g>the</str<strong>on</strong>g><br />
<strong>Federal</strong> <strong>Transit</strong> Administrati<strong>on</strong> (FTA) collected data<br />
<strong>on</strong> <str<strong>on</strong>g>the</str<strong>on</strong>g> vehicle inspecti<strong>on</strong> and PM programs of a<br />
sample of forty-three U.S. transit bus operators as<br />
part of a bus c<strong>on</strong>diti<strong>on</strong> assessment program. This<br />
analysis documented a wide range of vehicle PM<br />
inspecti<strong>on</strong> frequencies for standard forty-foot transit<br />
buses – ranging from every 2,000 to 8,000 miles<br />
(with every 6,000 miles being <str<strong>on</strong>g>the</str<strong>on</strong>g> most comm<strong>on</strong>). As<br />
expected, <str<strong>on</strong>g>the</str<strong>on</strong>g> thoroughness of <str<strong>on</strong>g>the</str<strong>on</strong>g> inspecti<strong>on</strong>s and<br />
related preventive maintenance activities also varied<br />
widely (with <str<strong>on</strong>g>the</str<strong>on</strong>g> thoroughness of <str<strong>on</strong>g>the</str<strong>on</strong>g>se activities not<br />
well correlated to <str<strong>on</strong>g>the</str<strong>on</strong>g> frequency of <str<strong>on</strong>g>the</str<strong>on</strong>g> inspecti<strong>on</strong>s).<br />
Interestingly, <str<strong>on</strong>g>the</str<strong>on</strong>g>re was no observed relati<strong>on</strong>ship<br />
between <str<strong>on</strong>g>the</str<strong>on</strong>g> physical c<strong>on</strong>diti<strong>on</strong> of <str<strong>on</strong>g>the</str<strong>on</strong>g> vehicles and<br />
<str<strong>on</strong>g>the</str<strong>on</strong>g> frequency of vehicle inspecti<strong>on</strong>s. A similar study<br />
of rail transit vehicles yielded similar results.<br />
Based <strong>on</strong> this research, it is clear that PM<br />
frequencies and activities are far from standardized<br />
across <str<strong>on</strong>g>the</str<strong>on</strong>g> nati<strong>on</strong>’s transit operators (at least for<br />
vehicle fleets). The questi<strong>on</strong> remains <str<strong>on</strong>g>the</str<strong>on</strong>g>n as to<br />
whe<str<strong>on</strong>g>the</str<strong>on</strong>g>r PM practices should be standardized. Here<br />
again, FTA’s c<strong>on</strong>diti<strong>on</strong> research for bus and rail<br />
assets provides a helpful perspective. These<br />
c<strong>on</strong>diti<strong>on</strong> assessments documented how differences<br />
in <str<strong>on</strong>g>the</str<strong>on</strong>g> service and envir<strong>on</strong>mental characteristics of<br />
individual transit operators impacted <str<strong>on</strong>g>the</str<strong>on</strong>g>ir assets’<br />
physical c<strong>on</strong>diti<strong>on</strong>s, life expectancy and maintenance<br />
needs. Specifically, <str<strong>on</strong>g>the</str<strong>on</strong>g>se maintenance needs and<br />
asset c<strong>on</strong>diti<strong>on</strong>s were related to each of <str<strong>on</strong>g>the</str<strong>on</strong>g> following<br />
factors:<br />
n Ridership levels<br />
n Annual hours and miles of service (e.g., per<br />
vehicle)<br />
n Climate/envir<strong>on</strong>ment (e.g., presence of salt)<br />
n Make and Model<br />
The analysis suggested that operators with higher<br />
ridership, higher asset utilizati<strong>on</strong> (e.g., annual miles<br />
per vehicle) or more severe climates should expect<br />
that more frequent or more comprehensive<br />
34<br />
preventive maintenance activities may be required to<br />
ensure <str<strong>on</strong>g>the</str<strong>on</strong>g>ir assets are maintained in good working<br />
order. Similarly, <str<strong>on</strong>g>the</str<strong>on</strong>g>re are also variati<strong>on</strong>s in <str<strong>on</strong>g>the</str<strong>on</strong>g><br />
reliability of differing pieces of transit equipment of<br />
<str<strong>on</strong>g>the</str<strong>on</strong>g> same type – yielding yet ano<str<strong>on</strong>g>the</str<strong>on</strong>g>r variable to<br />
identificati<strong>on</strong> of an optimal PM program. Toge<str<strong>on</strong>g>the</str<strong>on</strong>g>r,<br />
<str<strong>on</strong>g>the</str<strong>on</strong>g>se c<strong>on</strong>siderati<strong>on</strong>s suggest that it may not be<br />
possible or sensible to apply standardized, “<strong>on</strong>e size<br />
fits all” PM programs to assets of <str<strong>on</strong>g>the</str<strong>on</strong>g> same type but<br />
of differing quality and applied in widely different<br />
operating envir<strong>on</strong>ments.<br />
r PREVENTIVE MAINTENANCE AND<br />
STATE OF GOOD REPAIR<br />
What, <str<strong>on</strong>g>the</str<strong>on</strong>g>n, are <str<strong>on</strong>g>the</str<strong>on</strong>g> relati<strong>on</strong>ships between preventive<br />
maintenance and state of good repair (<strong>SGR</strong>)? A<br />
primary c<strong>on</strong>siderati<strong>on</strong> here is whe<str<strong>on</strong>g>the</str<strong>on</strong>g>r <str<strong>on</strong>g>the</str<strong>on</strong>g> c<strong>on</strong>cept of<br />
preventive maintenance should be included within <str<strong>on</strong>g>the</str<strong>on</strong>g><br />
definiti<strong>on</strong> of “state of good repair.” Specifically, can<br />
an asset or transit system be in a state of good repair<br />
if its preventive maintenance requirements are not<br />
met? The positi<strong>on</strong> taken here is that a<br />
comprehensive PM program is a necessary c<strong>on</strong>diti<strong>on</strong><br />
to ensure that <strong>SGR</strong> is maintained but that occasi<strong>on</strong>al<br />
or temporary postp<strong>on</strong>ement of some PM activities<br />
does not imply that a system (or asset) is not in a<br />
state of good repair.<br />
A sec<strong>on</strong>d c<strong>on</strong>siderati<strong>on</strong> here is <str<strong>on</strong>g>the</str<strong>on</strong>g> impact of<br />
differences in <str<strong>on</strong>g>the</str<strong>on</strong>g> comprehensiveness of preventive<br />
maintenance programs <strong>on</strong> asset c<strong>on</strong>diti<strong>on</strong>s, asset life<br />
expectancy and, by extensi<strong>on</strong>, state of good repair.<br />
In o<str<strong>on</strong>g>the</str<strong>on</strong>g>r words, do more comprehensive programs<br />
effectively yield better asset c<strong>on</strong>diti<strong>on</strong>s and l<strong>on</strong>ger<br />
asset life? Here again, FTA’s asset c<strong>on</strong>diti<strong>on</strong><br />
research provides a valuable perspective.<br />
Specifically, this research c<strong>on</strong>sidered how differences<br />
in preventive maintenance practices impacted asset<br />
physical c<strong>on</strong>diti<strong>on</strong> (see chart below for 40-foot transit<br />
buses). This analysis dem<strong>on</strong>strated fairly effectively<br />
that transit assets (again primarily vehicles) subject to<br />
higher levels of preventive maintenance tend to be of<br />
higher physical c<strong>on</strong>diti<strong>on</strong> at all asset ages (implying<br />
l<strong>on</strong>ger asset life) as compared to similar assets<br />
subject to less comprehensive PM programs. These
esults suggest that more comprehensive research,<br />
covering a broader variety of asset types, would be of<br />
value in developing more effective PM programs<br />
across all transit asset types.<br />
Physical C<strong>on</strong>diti<strong>on</strong> Rating<br />
5.0<br />
Observed Physical C<strong>on</strong>diti<strong>on</strong> Versus Age:<br />
40 Foot Buses<br />
Spline - Bus (High PM)<br />
4.5 Spline - Bus (Avg PM)<br />
Spline - Bus (Low PM)<br />
4.0 Bus Inspecti<strong>on</strong><br />
3.5<br />
3.0<br />
2.5<br />
2.0<br />
1.5<br />
1.0<br />
0 2 4 6 8 10 12 14 16 18 20<br />
Vehicle Age (Years)<br />
r OBSERVATIONS FROM <strong>SGR</strong><br />
WORKSHOP<br />
Participants at <str<strong>on</strong>g>the</str<strong>on</strong>g> <strong>SGR</strong> Workshop largely agreed<br />
that a comprehensive PM program can increase<br />
assets’ reliability and c<strong>on</strong>diti<strong>on</strong>, and extend assets’<br />
useful lives, which helps c<strong>on</strong>tribute generally to a<br />
state of good repair. However, <str<strong>on</strong>g>the</str<strong>on</strong>g> group did not<br />
reach a c<strong>on</strong>sensus <strong>on</strong> whe<str<strong>on</strong>g>the</str<strong>on</strong>g>r <strong>SGR</strong> needs<br />
assessments should include <str<strong>on</strong>g>the</str<strong>on</strong>g> costs of PM.<br />
Workshop participants also felt <str<strong>on</strong>g>the</str<strong>on</strong>g> industry should<br />
not set nati<strong>on</strong>al standards for PM, given that PM<br />
practices (and PM needs) vary widely from agency to<br />
agency. Specifically, both PM and <strong>SGR</strong> replacement<br />
activities can and do depend <strong>on</strong> <str<strong>on</strong>g>the</str<strong>on</strong>g> following factors:<br />
n Operating envir<strong>on</strong>ment/asset utilizati<strong>on</strong><br />
n Prior asset maintenance history<br />
n Quality of manufacture<br />
Proper use of a maintenance management system<br />
can be a crucial step to enable PM to help <strong>SGR</strong>.<br />
However, some participants reported difficulty getting<br />
maintenance staff to incorporate such systems into<br />
35<br />
daily practices. On <str<strong>on</strong>g>the</str<strong>on</strong>g> management side, some<br />
agencies have not yet managed to utilize <str<strong>on</strong>g>the</str<strong>on</strong>g> data<br />
collected by <str<strong>on</strong>g>the</str<strong>on</strong>g>se systems to c<strong>on</strong>duct analyses of<br />
<str<strong>on</strong>g>the</str<strong>on</strong>g> effectiveness of PM practices in minimizing<br />
corrective maintenance needs and in improving<br />
overall quality of service.<br />
Most agencies at <str<strong>on</strong>g>the</str<strong>on</strong>g> workshop felt <str<strong>on</strong>g>the</str<strong>on</strong>g>y could<br />
achieve ec<strong>on</strong>omies of scale in vehicle maintenance if<br />
FTA rules permitted <str<strong>on</strong>g>the</str<strong>on</strong>g>m to extend fleet procurement<br />
c<strong>on</strong>tracts over multiple years (allowing larger<br />
purchase orders with opti<strong>on</strong>s). A single vehicle fleet<br />
would generally reduce parts inventories and lower<br />
design, procurement, and maintenance costs.<br />
r ISSUES REMAINING<br />
Following are additi<strong>on</strong>al questi<strong>on</strong>s for <str<strong>on</strong>g>the</str<strong>on</strong>g> industry to<br />
address with respect to preventive maintenance<br />
practices and <str<strong>on</strong>g>the</str<strong>on</strong>g> attainment of state of good repair:<br />
n Are transit agencies managing to c<strong>on</strong>duct <str<strong>on</strong>g>the</str<strong>on</strong>g><br />
right (or optimal?) levels of preventive<br />
maintenance?<br />
n Is it realistic to expect transit agencies to<br />
significantly increase planned maintenance<br />
activities and reduce unplanned maintenance?<br />
§ How can it be accomplished?<br />
§ What are some of <str<strong>on</strong>g>the</str<strong>on</strong>g> potential obstacles?<br />
n In additi<strong>on</strong> to more effective use of available<br />
tools, what else can be d<strong>on</strong>e to reduce <str<strong>on</strong>g>the</str<strong>on</strong>g><br />
incidents of unplanned maintenance?<br />
n How close are <str<strong>on</strong>g>the</str<strong>on</strong>g> ties between preventive<br />
maintenance and <strong>SGR</strong>?<br />
§ Should PM be included in <str<strong>on</strong>g>the</str<strong>on</strong>g> definiti<strong>on</strong> of<br />
<strong>SGR</strong>?<br />
§ How do PM expenditures/practices impact<br />
asset c<strong>on</strong>diti<strong>on</strong>s and <strong>SGR</strong> needs?<br />
n How can FTA help <str<strong>on</strong>g>the</str<strong>on</strong>g> transit operators improve<br />
maintenance and reduce costs?
Core Capacity<br />
r OVERVIEW<br />
Rising public transportati<strong>on</strong> ridership coupled with<br />
expanding transit networks across <str<strong>on</strong>g>the</str<strong>on</strong>g> country are<br />
putting pressure <strong>on</strong> <str<strong>on</strong>g>the</str<strong>on</strong>g> core capacity of many mass<br />
transit systems. As new fixed guideway transit<br />
systems are c<strong>on</strong>structed and existing systems<br />
leng<str<strong>on</strong>g>the</str<strong>on</strong>g>ned, many U.S. transit agencies are reaching<br />
<str<strong>on</strong>g>the</str<strong>on</strong>g> upper limits of <str<strong>on</strong>g>the</str<strong>on</strong>g>ir infrastructure to<br />
accommodate more passengers at chokepoints and<br />
core areas.<br />
The core capacity of a transit system represents <str<strong>on</strong>g>the</str<strong>on</strong>g><br />
maximum number of passengers or trips that can be<br />
accommodated without having to widen or build<br />
additi<strong>on</strong>al guideway or route infrastructure. Since<br />
most transit systems tend to have c<strong>on</strong>centrated areas<br />
of destinati<strong>on</strong>s (such as central business districts or<br />
transfer points), <str<strong>on</strong>g>the</str<strong>on</strong>g> core capacity of <str<strong>on</strong>g>the</str<strong>on</strong>g> system may<br />
be c<strong>on</strong>strained at a level below <str<strong>on</strong>g>the</str<strong>on</strong>g> maximum<br />
capacity of individual comp<strong>on</strong>ents or segments (such<br />
as outlying branches). Similarly, since transit trips<br />
are not evenly distributed throughout <str<strong>on</strong>g>the</str<strong>on</strong>g> day, <str<strong>on</strong>g>the</str<strong>on</strong>g><br />
core capacity will be reached during periods of peak<br />
usage. Because of <str<strong>on</strong>g>the</str<strong>on</strong>g> difficulty of funding <str<strong>on</strong>g>the</str<strong>on</strong>g> very<br />
high cost of new guideway or route infrastructure,<br />
and <str<strong>on</strong>g>the</str<strong>on</strong>g> time required to implement such expansi<strong>on</strong>, it<br />
is necessary to first explore all opti<strong>on</strong>s for maximizing<br />
<str<strong>on</strong>g>the</str<strong>on</strong>g> core capacity of <str<strong>on</strong>g>the</str<strong>on</strong>g> system.<br />
r DETERMINING CORE CAPACITY<br />
The following presents <str<strong>on</strong>g>the</str<strong>on</strong>g> issues and elements that<br />
should be c<strong>on</strong>sidered to maximize <str<strong>on</strong>g>the</str<strong>on</strong>g> core capacity<br />
of a transit system without widening or building new<br />
guideway. For c<strong>on</strong>venience <str<strong>on</strong>g>the</str<strong>on</strong>g>se elements can be<br />
grouped under <str<strong>on</strong>g>the</str<strong>on</strong>g> following categories:<br />
n Network Strategies<br />
n Line Capacity<br />
n Vehicle Capacity<br />
Core Capacity of a <strong>Transit</strong> System<br />
FTA State of Good Repair Workshop<br />
36<br />
n Stati<strong>on</strong> Capacity<br />
n Support Capacity<br />
n O<str<strong>on</strong>g>the</str<strong>on</strong>g>r Strategies<br />
It should be noted that <str<strong>on</strong>g>the</str<strong>on</strong>g>se categories, and <str<strong>on</strong>g>the</str<strong>on</strong>g><br />
individual elements included in each, are not<br />
necessarily independent variables but may be closely<br />
related and have complementary or counteracting<br />
impacts <strong>on</strong> capacity.<br />
r NETWORK STRATEGIES<br />
On systems with multiple routes and feeder services,<br />
network strategies c<strong>on</strong>sider changes in <str<strong>on</strong>g>the</str<strong>on</strong>g><br />
c<strong>on</strong>figurati<strong>on</strong> or operati<strong>on</strong> of <str<strong>on</strong>g>the</str<strong>on</strong>g> system to make use<br />
of available capacity. These strategies are discussed<br />
here.<br />
n Feeder Bus Modificati<strong>on</strong>s: Restructuring of<br />
feeder bus routes to direct flows to alternative<br />
lines or stati<strong>on</strong>s which have additi<strong>on</strong>al capacity to<br />
absorb demand.<br />
n Service Improvements <strong>on</strong> Alternate Lines:<br />
Where ano<str<strong>on</strong>g>the</str<strong>on</strong>g>r line has excess capacity and <str<strong>on</strong>g>the</str<strong>on</strong>g><br />
potential to serve as an alternative route for<br />
pers<strong>on</strong>s who are using a line experiencing<br />
c<strong>on</strong>gesti<strong>on</strong> and approaching core capacity,<br />
increased frequency or o<str<strong>on</strong>g>the</str<strong>on</strong>g>r service<br />
improvements <strong>on</strong> <str<strong>on</strong>g>the</str<strong>on</strong>g> alternative route could<br />
induce some riders to switch to <str<strong>on</strong>g>the</str<strong>on</strong>g> less<br />
c<strong>on</strong>gested line.<br />
n Line C<strong>on</strong>necti<strong>on</strong>s: On multiple-line systems<br />
that intersect, c<strong>on</strong>sider building guideway<br />
c<strong>on</strong>necti<strong>on</strong>s to reroute some services over less<br />
c<strong>on</strong>gested parts of <str<strong>on</strong>g>the</str<strong>on</strong>g> system and to provide<br />
greater flexibility in working around disrupti<strong>on</strong>s.<br />
n Vehicle C<strong>on</strong>solidati<strong>on</strong>: On multiple-line<br />
systems that c<strong>on</strong>verge <strong>on</strong> a trunk, c<strong>on</strong>sider<br />
merging and coupling single vehicles such as<br />
light rail cars into trains, or leng<str<strong>on</strong>g>the</str<strong>on</strong>g>ning trains to
<str<strong>on</strong>g>the</str<strong>on</strong>g> maximum that can be accommodated, to<br />
reduce <str<strong>on</strong>g>the</str<strong>on</strong>g> number of movements <strong>on</strong> <str<strong>on</strong>g>the</str<strong>on</strong>g> trunk<br />
where capacity is c<strong>on</strong>strained and <str<strong>on</strong>g>the</str<strong>on</strong>g> service is<br />
at minimum headways. This may require some<br />
investment in infrastructure, such as sidings, at<br />
<str<strong>on</strong>g>the</str<strong>on</strong>g> c<strong>on</strong>vergence locati<strong>on</strong> to accommodate <str<strong>on</strong>g>the</str<strong>on</strong>g><br />
coupling procedure without interfering with main<br />
line movements and capacity.<br />
n System Schedule Coordinati<strong>on</strong>: On multipleline<br />
systems that c<strong>on</strong>verge as ultimate train<br />
capacity <strong>on</strong> <str<strong>on</strong>g>the</str<strong>on</strong>g> trunk is approached, timing of<br />
arrivals becomes critical to using every schedule<br />
slot without delays to o<str<strong>on</strong>g>the</str<strong>on</strong>g>r trains. A missed<br />
schedule slot wastes capacity and causes<br />
cascading delays. C<strong>on</strong>sider upgrades to <str<strong>on</strong>g>the</str<strong>on</strong>g><br />
network c<strong>on</strong>trol system to coordinate and adjust<br />
train movements to optimize arrivals <strong>on</strong> <str<strong>on</strong>g>the</str<strong>on</strong>g> trunk<br />
porti<strong>on</strong> of <str<strong>on</strong>g>the</str<strong>on</strong>g> system.<br />
r LINE CAPACITY<br />
Line capacity refers to <str<strong>on</strong>g>the</str<strong>on</strong>g><br />
maximum number of<br />
vehicles or trains per<br />
hour, or o<str<strong>on</strong>g>the</str<strong>on</strong>g>r unit of time,<br />
but not necessarily <str<strong>on</strong>g>the</str<strong>on</strong>g><br />
number of passengers<br />
that a line can<br />
accommodate. The<br />
capacity in terms of passengers per hour is also<br />
impacted by vehicle seating and standing capacity<br />
and stati<strong>on</strong> platform length available to access<br />
vehicle doors, which are discussed separately below.<br />
n Train C<strong>on</strong>trol: The minimum spacing of trains<br />
for safe operati<strong>on</strong> is governed by <str<strong>on</strong>g>the</str<strong>on</strong>g> signal/train<br />
c<strong>on</strong>trol system. In less sophisticated systems it<br />
is governed primarily by maximum line speeds<br />
and train braking distances, which in turn govern<br />
signal locati<strong>on</strong>s and block lengths. Automatic<br />
train c<strong>on</strong>trol can eliminate variables in driver<br />
resp<strong>on</strong>se and performance, allowing schedules<br />
to be built with less c<strong>on</strong>tingency for driver<br />
reacti<strong>on</strong>. Communicati<strong>on</strong>s-based train c<strong>on</strong>trol,<br />
based <strong>on</strong> <str<strong>on</strong>g>the</str<strong>on</strong>g> actual distance between trains<br />
taking into account <str<strong>on</strong>g>the</str<strong>on</strong>g>ir actual speeds and<br />
37<br />
distances with fixed blocks, can fur<str<strong>on</strong>g>the</str<strong>on</strong>g>r increase<br />
capacity.<br />
n Line Speeds: A line may have physical<br />
characteristics such as degree of curvature that<br />
require trains to slow or run at less than optimum<br />
route speed at particular locati<strong>on</strong>s. Reducing<br />
curvature, increasing banking (superelevati<strong>on</strong>),<br />
or rec<strong>on</strong>figuring turnouts, can allow trains to run<br />
at higher speeds<br />
r STATION DWELL<br />
Stati<strong>on</strong> dwell times are often <str<strong>on</strong>g>the</str<strong>on</strong>g> c<strong>on</strong>trolling element<br />
in limiting <str<strong>on</strong>g>the</str<strong>on</strong>g> number of trains that a line can<br />
accommodate per hour and are affected by<br />
numerous factors. Minimizing stati<strong>on</strong> dwell should be<br />
a key goal in maximizing line capacity. There are<br />
several factors to be c<strong>on</strong>sidered.<br />
n C<strong>on</strong>figurati<strong>on</strong> of Routes at a Juncti<strong>on</strong>:<br />
Systems with lines that c<strong>on</strong>verge at flat juncti<strong>on</strong>s<br />
can improve capacity by c<strong>on</strong>structing flyovers to<br />
eliminate c<strong>on</strong>flicts between opposing<br />
movements.<br />
n Train Accelerati<strong>on</strong> and Braking: Accelerati<strong>on</strong><br />
and braking are important to capacity, particularly<br />
as <str<strong>on</strong>g>the</str<strong>on</strong>g>y help to reduce <str<strong>on</strong>g>the</str<strong>on</strong>g> impacts of stati<strong>on</strong><br />
dwell times by allowing trains to move into and<br />
out of stati<strong>on</strong>s quickly.<br />
n Terminal Reversing Procedures: At locati<strong>on</strong>s<br />
where trains must reverse at a terminal stati<strong>on</strong>,<br />
<str<strong>on</strong>g>the</str<strong>on</strong>g>re are potential improvements to reduce or<br />
eliminate capacity c<strong>on</strong>straints.<br />
r VEHICLE CAPACITY<br />
Several opti<strong>on</strong>s may be c<strong>on</strong>sidered to increase <str<strong>on</strong>g>the</str<strong>on</strong>g><br />
passenger carrying capacity of trains. Each of <str<strong>on</strong>g>the</str<strong>on</strong>g>se<br />
may have an impact <strong>on</strong> stati<strong>on</strong> capacity, which will<br />
need to be taken into c<strong>on</strong>siderati<strong>on</strong> as discussed<br />
under stati<strong>on</strong>s below.<br />
n L<strong>on</strong>ger Trains: Increasing <str<strong>on</strong>g>the</str<strong>on</strong>g> length of trains<br />
can add to core passenger carrying capacity.
Core Capacity<br />
n Higher Capacity Cars: Several strategies exist<br />
to increase <str<strong>on</strong>g>the</str<strong>on</strong>g> capacity of vehicles. Some of<br />
<str<strong>on</strong>g>the</str<strong>on</strong>g>se, such as favoring more standee room over<br />
seats, need to be carefully c<strong>on</strong>sidered against<br />
<str<strong>on</strong>g>the</str<strong>on</strong>g> grantee’s standards of comfort and <str<strong>on</strong>g>the</str<strong>on</strong>g><br />
service quality goals of <str<strong>on</strong>g>the</str<strong>on</strong>g> system.<br />
r STATION CAPACITY<br />
Stati<strong>on</strong> capacity will<br />
impact, or be impacted<br />
by, many of <str<strong>on</strong>g>the</str<strong>on</strong>g> o<str<strong>on</strong>g>the</str<strong>on</strong>g>r<br />
core capacity elements<br />
discussed above. Any<br />
changes that increase<br />
<str<strong>on</strong>g>the</str<strong>on</strong>g> density of<br />
passengers using <str<strong>on</strong>g>the</str<strong>on</strong>g><br />
stati<strong>on</strong>, particularly<br />
platform volumes, will have to take into c<strong>on</strong>siderati<strong>on</strong><br />
<str<strong>on</strong>g>the</str<strong>on</strong>g> basic design parameters for <str<strong>on</strong>g>the</str<strong>on</strong>g> stati<strong>on</strong>, including<br />
passenger flow, ingress and egress, emergency<br />
evacuati<strong>on</strong> requirements, fare collecti<strong>on</strong>, and HVAC<br />
loadings. Aside from basic life safety and code<br />
requirements, <str<strong>on</strong>g>the</str<strong>on</strong>g> primary core capacity issue with<br />
stati<strong>on</strong>s is dwell time to offload arriving passengers<br />
and board departing passengers, which quite often is<br />
<str<strong>on</strong>g>the</str<strong>on</strong>g> c<strong>on</strong>trolling limitati<strong>on</strong> <strong>on</strong> core line capacity.<br />
n Vehicle Design Impacts <strong>on</strong> Capacity: Systems<br />
using a step-up platform can reduce dwell time<br />
by c<strong>on</strong>verting to level boarding platforms, which<br />
may require new vehicles. Systems that must<br />
accommodate boarding and alighting at street<br />
level can adopt low-flow designs that match curb<br />
height platforms for level boarding. Additi<strong>on</strong>al or<br />
double-width doors and revised seating/standing<br />
interior arrangements can improve <str<strong>on</strong>g>the</str<strong>on</strong>g> flow of<br />
boarding and alighting and reduce dwell time.<br />
n Platform Crowding and Circulati<strong>on</strong>: Any<br />
strategies that increase <str<strong>on</strong>g>the</str<strong>on</strong>g> frequency of trains or<br />
passenger capacity of trains can increase <str<strong>on</strong>g>the</str<strong>on</strong>g><br />
density of passengers <strong>on</strong> <str<strong>on</strong>g>the</str<strong>on</strong>g> platforms, with<br />
potential crowding and restricti<strong>on</strong>s <strong>on</strong> flow, thus<br />
increasing dwell times.<br />
38<br />
n Modificati<strong>on</strong> of Stati<strong>on</strong> Tracks and Platforms:<br />
Major modificati<strong>on</strong> of tracks or platforms at<br />
stati<strong>on</strong>s can be costly and disruptive, but where<br />
feasible <str<strong>on</strong>g>the</str<strong>on</strong>g>y can reduce or eliminate dwell time<br />
c<strong>on</strong>straints <strong>on</strong> core capacity at critical stati<strong>on</strong>s.<br />
n Stati<strong>on</strong> Access: To effectively make use of <str<strong>on</strong>g>the</str<strong>on</strong>g><br />
maximum core passenger carrying capacity of<br />
<str<strong>on</strong>g>the</str<strong>on</strong>g> system an equivalent number of passengers<br />
must be able to access <str<strong>on</strong>g>the</str<strong>on</strong>g> system. Depending<br />
<strong>on</strong> <str<strong>on</strong>g>the</str<strong>on</strong>g> nature of <str<strong>on</strong>g>the</str<strong>on</strong>g> immediate stati<strong>on</strong> area as<br />
well as its catchment area, access capacity<br />
enhancements to c<strong>on</strong>sider include feeder bus<br />
schedules, parking, pedestrian/bicycle access,<br />
and traffic c<strong>on</strong>trols.<br />
r SUPPORT CAPACITY<br />
Some capacity enhancements may require<br />
improvements or modificati<strong>on</strong>s to support<br />
infrastructure.<br />
n Tracti<strong>on</strong> Power Systems: The capacity of <str<strong>on</strong>g>the</str<strong>on</strong>g><br />
tracti<strong>on</strong> power system to accommodate l<strong>on</strong>ger<br />
trains and shorter headways ei<str<strong>on</strong>g>the</str<strong>on</strong>g>r al<strong>on</strong>e or in<br />
combinati<strong>on</strong> must be c<strong>on</strong>sidered.<br />
n Shops and Yards: L<strong>on</strong>ger or more frequent<br />
trains will increase fleet demands <strong>on</strong> shops and<br />
storage yards.<br />
r OTHER STRATEGIES<br />
Because <str<strong>on</strong>g>the</str<strong>on</strong>g> usage of a transit system is not evenly<br />
distributed throughout <str<strong>on</strong>g>the</str<strong>on</strong>g> day or by locati<strong>on</strong> across<br />
<str<strong>on</strong>g>the</str<strong>on</strong>g> system, core capacity is typically reached during<br />
peak periods of demand or at choke points and<br />
locati<strong>on</strong>s of maximum loading <strong>on</strong> <str<strong>on</strong>g>the</str<strong>on</strong>g> system.<br />
Techniques to redistribute <str<strong>on</strong>g>the</str<strong>on</strong>g> demand, or <str<strong>on</strong>g>the</str<strong>on</strong>g> growth<br />
in demand, by time of day or by locati<strong>on</strong> of excess<br />
capacity, while not directly under <str<strong>on</strong>g>the</str<strong>on</strong>g> c<strong>on</strong>trol of <str<strong>on</strong>g>the</str<strong>on</strong>g><br />
transit operator, should be explored as a matter of<br />
public policy to maximize <str<strong>on</strong>g>the</str<strong>on</strong>g> capacity of <str<strong>on</strong>g>the</str<strong>on</strong>g> system<br />
for moving people.<br />
n Staggered Work Hours: Policies of staggering<br />
<str<strong>on</strong>g>the</str<strong>on</strong>g> start and finish times of workplaces can<br />
reduce peak demand and make more use of
excess capacity <strong>on</strong> <str<strong>on</strong>g>the</str<strong>on</strong>g> shoulders of <str<strong>on</strong>g>the</str<strong>on</strong>g> peak<br />
hours.<br />
n C<strong>on</strong>gesti<strong>on</strong> Pricing: Charging higher fares<br />
during periods of peak c<strong>on</strong>gesti<strong>on</strong> can shift<br />
demand, particularly n<strong>on</strong>-time-critical trips, to<br />
periods of excess capacity. The ability to do this<br />
will depend <strong>on</strong> <str<strong>on</strong>g>the</str<strong>on</strong>g> method of fare collecti<strong>on</strong>, and<br />
<strong>on</strong> some systems this may require a major<br />
investment in upgrading or replacing <str<strong>on</strong>g>the</str<strong>on</strong>g> fare<br />
collecti<strong>on</strong> system.<br />
n Redirected Development: Land use and z<strong>on</strong>ing<br />
policies could encourage additi<strong>on</strong>al development<br />
at locati<strong>on</strong>s where <str<strong>on</strong>g>the</str<strong>on</strong>g> increased transit demand<br />
should occur. This would require origin and<br />
destinati<strong>on</strong> demand modeling of <str<strong>on</strong>g>the</str<strong>on</strong>g> network to<br />
determine <str<strong>on</strong>g>the</str<strong>on</strong>g> impact of <str<strong>on</strong>g>the</str<strong>on</strong>g> redirected growth in<br />
demand <strong>on</strong> o<str<strong>on</strong>g>the</str<strong>on</strong>g>r parts of <str<strong>on</strong>g>the</str<strong>on</strong>g> system that may be<br />
at or near core capacity.<br />
r OBSERVATIONS FROM <strong>SGR</strong><br />
WORKSHOP<br />
The <strong>SGR</strong> Workshop yielded a number of<br />
observati<strong>on</strong>s and valuable perspectives with respect<br />
to core capacity needs and <str<strong>on</strong>g>the</str<strong>on</strong>g> issue of state of good<br />
repair.<br />
Core Capacity Needs: Workshop participants<br />
generally acknowledged that <str<strong>on</strong>g>the</str<strong>on</strong>g>ir rail and bus<br />
systems have significant unmet core capacity needs,<br />
with <str<strong>on</strong>g>the</str<strong>on</strong>g> level of need depending <strong>on</strong> local/regi<strong>on</strong>al<br />
circumstances. The size of <str<strong>on</strong>g>the</str<strong>on</strong>g> vehicle fleet, <str<strong>on</strong>g>the</str<strong>on</strong>g><br />
capacity of <str<strong>on</strong>g>the</str<strong>on</strong>g> tracti<strong>on</strong> power system, and <str<strong>on</strong>g>the</str<strong>on</strong>g><br />
c<strong>on</strong>diti<strong>on</strong> and capacity of signal systems were<br />
frequently cited as <str<strong>on</strong>g>the</str<strong>on</strong>g> primary infrastructure<br />
c<strong>on</strong>straints to expanding system throughput. All<br />
observers expressed <str<strong>on</strong>g>the</str<strong>on</strong>g> need to balance <str<strong>on</strong>g>the</str<strong>on</strong>g>ir <strong>SGR</strong><br />
reinvestment needs with <str<strong>on</strong>g>the</str<strong>on</strong>g> need to accommodate<br />
<strong>on</strong>going ridership growth (with <str<strong>on</strong>g>the</str<strong>on</strong>g> later need<br />
exacerbated by <str<strong>on</strong>g>the</str<strong>on</strong>g> recent increase in fuel prices and<br />
c<strong>on</strong>sequent increase in transit ridership).<br />
Core Capacity and <strong>SGR</strong>: At <str<strong>on</strong>g>the</str<strong>on</strong>g> same time, because<br />
capacity-c<strong>on</strong>strained systems also have <strong>SGR</strong><br />
reinvestment needs, many agencies reported that<br />
39<br />
<str<strong>on</strong>g>the</str<strong>on</strong>g>ir existing <strong>SGR</strong> reinvestment plans also include<br />
some (often minor) core capacity improvement<br />
elements. For example, <str<strong>on</strong>g>the</str<strong>on</strong>g> aging signal and tracti<strong>on</strong><br />
power systems are typically replaced with new<br />
technology equipment capable of supporting higher<br />
passenger throughput. As noted in o<str<strong>on</strong>g>the</str<strong>on</strong>g>r sessi<strong>on</strong>s,<br />
few asset replacements are made <strong>on</strong> an “in-kind”<br />
basis. Ra<str<strong>on</strong>g>the</str<strong>on</strong>g>r, asset replacement typically involves<br />
replacement with assets of larger size, newer<br />
technologies and better materials that support higher<br />
throughput, improved service quality, and sometimes<br />
greater core capacity.<br />
Increased Funding Flexibility: The participants’<br />
reacti<strong>on</strong>s to <str<strong>on</strong>g>the</str<strong>on</strong>g> questi<strong>on</strong> of whe<str<strong>on</strong>g>the</str<strong>on</strong>g>r agencies would<br />
benefit from more flexible <strong>Federal</strong> funding (e.g., more<br />
flexible between <strong>SGR</strong> and capacity improvement<br />
uses) was mixed. Some participants felt that<br />
increased flexibility would permit better resource<br />
allocati<strong>on</strong> towards <str<strong>on</strong>g>the</str<strong>on</strong>g> highest priority needs.<br />
However, o<str<strong>on</strong>g>the</str<strong>on</strong>g>rs expressed c<strong>on</strong>cern that this change<br />
may result in a loss of <strong>SGR</strong> funding for agencies that<br />
receive <str<strong>on</strong>g>the</str<strong>on</strong>g>ir <strong>Federal</strong> funding through a regi<strong>on</strong>al<br />
reallocati<strong>on</strong> process (i.e., where federal funds do not<br />
flow directly to <str<strong>on</strong>g>the</str<strong>on</strong>g> final recipient agencies).<br />
Limited Funding Availability: As with <strong>SGR</strong> needs,<br />
workshop participants cited a lack of sufficient<br />
funding as <str<strong>on</strong>g>the</str<strong>on</strong>g> largest obstacle to meeting core<br />
capacity investment needs. Once again, this limited<br />
funding and significant needs for both core capacity<br />
and <strong>SGR</strong> investments have resulted in <str<strong>on</strong>g>the</str<strong>on</strong>g> need for<br />
agencies to prioritize between <str<strong>on</strong>g>the</str<strong>on</strong>g>se two investment<br />
types. However, few agencies cited make use of a<br />
clear, objective process (e.g., benefit-cost<br />
comparis<strong>on</strong>s) to prioritize between <str<strong>on</strong>g>the</str<strong>on</strong>g>se differing<br />
investment types.<br />
r ISSUES REMAINING<br />
Following are additi<strong>on</strong>al questi<strong>on</strong>s for <str<strong>on</strong>g>the</str<strong>on</strong>g> industry to<br />
c<strong>on</strong>sider with respect to core capacity needs and<br />
<str<strong>on</strong>g>the</str<strong>on</strong>g>ir relati<strong>on</strong> to <str<strong>on</strong>g>the</str<strong>on</strong>g> attainment of state of good repair:<br />
n Is it useful to determine <str<strong>on</strong>g>the</str<strong>on</strong>g> difference between<br />
meeting increased demand and state of good
Core Capacity<br />
repair? What are <str<strong>on</strong>g>the</str<strong>on</strong>g> ramificati<strong>on</strong>s of treating n How do systems balance/prioritize <str<strong>on</strong>g>the</str<strong>on</strong>g>se core<br />
<str<strong>on</strong>g>the</str<strong>on</strong>g>m differently? capacity issues with o<str<strong>on</strong>g>the</str<strong>on</strong>g>r recapitalizati<strong>on</strong><br />
n How should <strong>Federal</strong> funding be provided to issues?<br />
maximize existing infrastructure capacity? n How can capital investment in core capacity<br />
enhancements be balanced with maintenance of<br />
<str<strong>on</strong>g>the</str<strong>on</strong>g> system?<br />
40
Approaches to Financing<br />
r OVERVIEW<br />
Recent estimates place <str<strong>on</strong>g>the</str<strong>on</strong>g> amount of capital<br />
investment needed to overcome deferred<br />
maintenance and replacement backlogs at <str<strong>on</strong>g>the</str<strong>on</strong>g><br />
Nati<strong>on</strong>’s largest transit rail systems at more than $35<br />
billi<strong>on</strong>. With <str<strong>on</strong>g>the</str<strong>on</strong>g> recent decline in highway vehicle<br />
miles traveled (VMT) due to higher gas prices, gas<br />
tax revenues have decreased, as has <str<strong>on</strong>g>the</str<strong>on</strong>g> balance in<br />
<str<strong>on</strong>g>the</str<strong>on</strong>g> Nati<strong>on</strong>’s Highway Trust Fund. This will make it<br />
difficult for <str<strong>on</strong>g>the</str<strong>on</strong>g> <strong>Federal</strong> government to c<strong>on</strong>tinue to<br />
provide a significant share of <str<strong>on</strong>g>the</str<strong>on</strong>g> needed funds. The<br />
same problem exists at State and local government<br />
levels. Alternative financing sources will be needed<br />
to fill <str<strong>on</strong>g>the</str<strong>on</strong>g> gap where <str<strong>on</strong>g>the</str<strong>on</strong>g>re are shortfalls in funding.<br />
C<strong>on</strong>tinuing to defer maintenance and replacement of<br />
substandard assets is not an opti<strong>on</strong> as <str<strong>on</strong>g>the</str<strong>on</strong>g> cost to our<br />
ec<strong>on</strong>omy and standard of living of not maintaining<br />
transit services is unacceptable. Our urban quality of<br />
life depends <strong>on</strong> reliable transit.<br />
In 2006 total public transit agency expenditures for<br />
capital investment were $13 billi<strong>on</strong>, of which 44%<br />
were funded by <str<strong>on</strong>g>the</str<strong>on</strong>g> <strong>Federal</strong> government. The<br />
remaining funds came from State and local sources,<br />
including operating revenues. These are substantial<br />
resources, but finding funds to address capital<br />
investment backlogs, much less provide for new<br />
capacity, is increasingly difficult. This paper explores<br />
some alternative approaches to leveraging public<br />
funding with resources from private sector investors.<br />
r PUBLIC PRIVATE PARTNERSHIPS<br />
The <strong>Federal</strong> <strong>Transit</strong> Administrati<strong>on</strong> is following <str<strong>on</strong>g>the</str<strong>on</strong>g><br />
lead of o<str<strong>on</strong>g>the</str<strong>on</strong>g>r infrastructure agencies in promoting <str<strong>on</strong>g>the</str<strong>on</strong>g><br />
use of public-private partnership (PPP)<br />
arrangements. These partnerships can be set up in<br />
many ways. There seems to be no standard model,<br />
as each partnership must be tailor-made to suit local<br />
c<strong>on</strong>diti<strong>on</strong>s and requirements. PPPs are already fairly<br />
comm<strong>on</strong> for highway projects, and we are starting to<br />
Alternative Approaches to Financing<br />
FTA State of Good Repair Workshop<br />
41<br />
see PPPs in <str<strong>on</strong>g>the</str<strong>on</strong>g> transit industry as well. FTA has<br />
initiated a program to teach transit managers,<br />
investors, and its staff about <str<strong>on</strong>g>the</str<strong>on</strong>g> advantages of this<br />
type of financing. FTA has also initiated a pilot<br />
program to gain experience with incorporating this<br />
type of financing into its New Starts Program<br />
procedures.<br />
There is an industry-wide need for developing<br />
expertise in this type of c<strong>on</strong>tracting. FTA seeks input<br />
from transit providers and investors <strong>on</strong> best practices<br />
to emulate and <strong>on</strong> barriers that still need to be<br />
overcome.<br />
Although PPPs are not widely used in <str<strong>on</strong>g>the</str<strong>on</strong>g> U.S. for<br />
transit projects, <str<strong>on</strong>g>the</str<strong>on</strong>g> industry can learn from <str<strong>on</strong>g>the</str<strong>on</strong>g><br />
experience of transit operators in Europe and<br />
Australia, where PPPs have been comm<strong>on</strong> for some<br />
time. This experience has identified two potential<br />
advantages for PPPs: reduced direct public costs due<br />
to <str<strong>on</strong>g>the</str<strong>on</strong>g> use of private capital, and reduced public<br />
indirect costs due to expedited project delivery.<br />
Just like public sector debt financing, private<br />
financing may be more expensive than <str<strong>on</strong>g>the</str<strong>on</strong>g> traditi<strong>on</strong>al<br />
“pay as you go” method of funding. For example, <str<strong>on</strong>g>the</str<strong>on</strong>g><br />
BART Oakland Airport C<strong>on</strong>nector project will include<br />
costs related to private sector financing of <str<strong>on</strong>g>the</str<strong>on</strong>g> project.<br />
This will add an estimated $30-to-$40 milli<strong>on</strong> to <str<strong>on</strong>g>the</str<strong>on</strong>g><br />
cost of <str<strong>on</strong>g>the</str<strong>on</strong>g> c<strong>on</strong>cessi<strong>on</strong> over a 30-to-40-year term<br />
versus an approach in which <str<strong>on</strong>g>the</str<strong>on</strong>g> project’s capital<br />
costs were entirely funded with public sector m<strong>on</strong>ies.<br />
However, given <str<strong>on</strong>g>the</str<strong>on</strong>g> scarcity of State funds, <str<strong>on</strong>g>the</str<strong>on</strong>g><br />
project would not be possible without private<br />
financing, and BART has estimated that <str<strong>on</strong>g>the</str<strong>on</strong>g> cost for<br />
<str<strong>on</strong>g>the</str<strong>on</strong>g> agency to borrow directly would be similar to <str<strong>on</strong>g>the</str<strong>on</strong>g><br />
cost of private financing.<br />
Although it can take l<strong>on</strong>ger to negotiate PPP<br />
c<strong>on</strong>tracts, <str<strong>on</strong>g>the</str<strong>on</strong>g> c<strong>on</strong>tractor’s financial interest in <str<strong>on</strong>g>the</str<strong>on</strong>g><br />
project often expedites project delivery and quality.
Approaches to Financing<br />
The overhead costs of Minnesota Department of<br />
Transportati<strong>on</strong> and Metro <strong>Transit</strong> associated with <str<strong>on</strong>g>the</str<strong>on</strong>g><br />
Hiawatha Corridor light rail project were trimmed by<br />
an estimated $25-to-$38 milli<strong>on</strong> due to <str<strong>on</strong>g>the</str<strong>on</strong>g> project’s<br />
completi<strong>on</strong> <strong>on</strong>e year earlier than expected with a<br />
design-bid-build project delivery approach.<br />
Indirect cost savings also result from <str<strong>on</strong>g>the</str<strong>on</strong>g> transfer of<br />
risk of operating and maintenance cost increases to a<br />
private c<strong>on</strong>sortium. New Jersey <strong>Transit</strong> will pay <str<strong>on</strong>g>the</str<strong>on</strong>g><br />
Huds<strong>on</strong>-Bergen Light Rail project’s c<strong>on</strong>sortium a<br />
guaranteed price in 1996 dollars for operati<strong>on</strong> and<br />
maintenance of <str<strong>on</strong>g>the</str<strong>on</strong>g> line, subject to increases in <str<strong>on</strong>g>the</str<strong>on</strong>g><br />
c<strong>on</strong>sumer price index (CPI) and o<str<strong>on</strong>g>the</str<strong>on</strong>g>r inflati<strong>on</strong> indices<br />
for selected operating costs, including electricity.<br />
This insulates <str<strong>on</strong>g>the</str<strong>on</strong>g> agency from growth in operating<br />
costs for reas<strong>on</strong>s o<str<strong>on</strong>g>the</str<strong>on</strong>g>r than inflati<strong>on</strong>, and provides<br />
<str<strong>on</strong>g>the</str<strong>on</strong>g> operating c<strong>on</strong>sortium incentive to keep a lid <strong>on</strong><br />
operati<strong>on</strong>s and maintenance cost escalati<strong>on</strong>.<br />
One of <str<strong>on</strong>g>the</str<strong>on</strong>g> primary reas<strong>on</strong>s <str<strong>on</strong>g>the</str<strong>on</strong>g> public sector is<br />
interested in using PPPs is to save time in <str<strong>on</strong>g>the</str<strong>on</strong>g> total<br />
development process by c<strong>on</strong>currently performing<br />
certain activities whose results are not mutually<br />
dependent, and by using resources more efficiently.<br />
PPPs can also expedite <str<strong>on</strong>g>the</str<strong>on</strong>g> applicati<strong>on</strong> of advanced<br />
technology. Thus, private developers seek to “fasttrack”<br />
design and c<strong>on</strong>structi<strong>on</strong>, proceeding with<br />
certain elements of <str<strong>on</strong>g>the</str<strong>on</strong>g> c<strong>on</strong>structi<strong>on</strong> work while<br />
design is still <strong>on</strong>going <strong>on</strong> o<str<strong>on</strong>g>the</str<strong>on</strong>g>rs. They also involve<br />
<str<strong>on</strong>g>the</str<strong>on</strong>g> c<strong>on</strong>structi<strong>on</strong> firm in design reviews to avoid<br />
delays associated with design defects affecting<br />
project c<strong>on</strong>structi<strong>on</strong>. Time savings can also lower <str<strong>on</strong>g>the</str<strong>on</strong>g><br />
cost of <str<strong>on</strong>g>the</str<strong>on</strong>g> project by avoiding large increases in<br />
material costs due to price inflati<strong>on</strong>.<br />
Delivery of many of <str<strong>on</strong>g>the</str<strong>on</strong>g> projects identified in FTA’s<br />
December, 2007 <str<strong>on</strong>g>Report</str<strong>on</strong>g> to C<strong>on</strong>gress <strong>on</strong> <str<strong>on</strong>g>the</str<strong>on</strong>g> Costs,<br />
Benefits, and Efficiencies of Public-Private<br />
Partnerships for Fixed Guideway Capital Projects<br />
was advanced by a year or more, in part as a result<br />
of <str<strong>on</strong>g>the</str<strong>on</strong>g> PPP delivery approach.<br />
42<br />
r PPP CASE STUDY: LONDON<br />
UNDERGROUND<br />
Although <str<strong>on</strong>g>the</str<strong>on</strong>g>re are several U.S. design-build-operatefinance<br />
agreements between private investors and<br />
public transit agencies for system expansi<strong>on</strong>, <str<strong>on</strong>g>the</str<strong>on</strong>g>re<br />
have not been any similar agreements designed to<br />
bring a transit system to a state of good repair. We<br />
must look overseas for examples of how this could be<br />
implemented. A particularly relevant example is<br />
found in Great Britain, where operati<strong>on</strong> of L<strong>on</strong>d<strong>on</strong>’s<br />
famous subway system was jeopardized by a<br />
decades-old maintenance backlog.<br />
In 1998 L<strong>on</strong>d<strong>on</strong> announced its proposal for<br />
modernizing <str<strong>on</strong>g>the</str<strong>on</strong>g> Underground network by means of<br />
PPP agreements to reduce <str<strong>on</strong>g>the</str<strong>on</strong>g> Government’s<br />
financial burden in bringing <str<strong>on</strong>g>the</str<strong>on</strong>g> system to a state of<br />
good repair. The objective of <str<strong>on</strong>g>the</str<strong>on</strong>g> PPP was to<br />
optimize cost and performance over <str<strong>on</strong>g>the</str<strong>on</strong>g> whole<br />
lifecycle of <str<strong>on</strong>g>the</str<strong>on</strong>g> assets from design, c<strong>on</strong>structi<strong>on</strong>,<br />
maintenance, and refurbishment to replacement.<br />
The PPPs split <str<strong>on</strong>g>the</str<strong>on</strong>g> resp<strong>on</strong>sibility for delivering <str<strong>on</strong>g>the</str<strong>on</strong>g><br />
Underground’s services as follows:<br />
n Public Sector - ownership of <str<strong>on</strong>g>the</str<strong>on</strong>g> assets remains<br />
in <str<strong>on</strong>g>the</str<strong>on</strong>g> public sector. The L<strong>on</strong>d<strong>on</strong> Underground<br />
(LU) is resp<strong>on</strong>sible for operating trains, stati<strong>on</strong>s<br />
and signals, and for managing <str<strong>on</strong>g>the</str<strong>on</strong>g> customer<br />
interface. Ultimate resp<strong>on</strong>sibility for system<br />
safety lies with LU.<br />
n Private Sector - resp<strong>on</strong>sible for putting <str<strong>on</strong>g>the</str<strong>on</strong>g><br />
assets into service each day. Infrastructure<br />
companies (Infracos) maintain, renew and<br />
upgrade <str<strong>on</strong>g>the</str<strong>on</strong>g> Underground’s infrastructure under<br />
30-year c<strong>on</strong>tracts.
LU entered into three agreements with <str<strong>on</strong>g>the</str<strong>on</strong>g> following<br />
infrastructure companies for <str<strong>on</strong>g>the</str<strong>on</strong>g> following rail lines<br />
between December 2002 and April 2003:<br />
n Tube Lines – Jubilee, Nor<str<strong>on</strong>g>the</str<strong>on</strong>g>rn and Piccadilly<br />
n Metr<strong>on</strong>et BCV – Bakerloo, Central, Victoria,<br />
Waterloo and City<br />
n Metr<strong>on</strong>et SSL – District, Circle, Metropolitan,<br />
Hammersmith and City, East L<strong>on</strong>d<strong>on</strong><br />
The c<strong>on</strong>tracts included <str<strong>on</strong>g>the</str<strong>on</strong>g> following c<strong>on</strong>diti<strong>on</strong>s and<br />
terms:<br />
n Performance-related incentives and penalties to<br />
remunerate <str<strong>on</strong>g>the</str<strong>on</strong>g> Infracos for <str<strong>on</strong>g>the</str<strong>on</strong>g> improvements<br />
<str<strong>on</strong>g>the</str<strong>on</strong>g>y make to <str<strong>on</strong>g>the</str<strong>on</strong>g> network.<br />
n Infracos decide what maintenance and<br />
investment projects <str<strong>on</strong>g>the</str<strong>on</strong>g>y carry out to deliver <str<strong>on</strong>g>the</str<strong>on</strong>g><br />
required performance.<br />
n LU specifies target dates for a number of<br />
projects, such as stati<strong>on</strong> refurbishments, track<br />
replacement and fleet replacement.<br />
n Infracos are paid a fee-for-service every four<br />
weeks with performance-related b<strong>on</strong>uses and<br />
abatements.<br />
n Review of <str<strong>on</strong>g>the</str<strong>on</strong>g> c<strong>on</strong>tractual obligati<strong>on</strong>s and<br />
remunerati<strong>on</strong> every 7.5 years carried out by <str<strong>on</strong>g>the</str<strong>on</strong>g><br />
PPP Arbiter, an independent office-holder<br />
appointed by <str<strong>on</strong>g>the</str<strong>on</strong>g> Greater L<strong>on</strong>d<strong>on</strong> Authority.<br />
n C<strong>on</strong>tains provisi<strong>on</strong>s for an Extraordinary Review<br />
where an Infraco c<strong>on</strong>siders that it is incurring<br />
additi<strong>on</strong>al costs above <str<strong>on</strong>g>the</str<strong>on</strong>g> level allowed for in its<br />
bid.<br />
n Additi<strong>on</strong>al costs are calculated by reference to a<br />
noti<strong>on</strong>al Infraco operating in accordance with<br />
Good Industry practice.<br />
n If net adverse effects in a 7.5-year review period<br />
exceed a c<strong>on</strong>tractual threshold, <str<strong>on</strong>g>the</str<strong>on</strong>g> Arbiter can<br />
direct that <str<strong>on</strong>g>the</str<strong>on</strong>g> payment by LU is increased.<br />
The PPP is funded by a combinati<strong>on</strong> of farebox<br />
revenues, private sector capital and government<br />
43<br />
grants. The Infracos each borrowed around $600<br />
milli<strong>on</strong> to pay for refurbishment of <str<strong>on</strong>g>the</str<strong>on</strong>g> Underground.<br />
It is intended that over <str<strong>on</strong>g>the</str<strong>on</strong>g> first 15 years of PPP<br />
c<strong>on</strong>tracts, <str<strong>on</strong>g>the</str<strong>on</strong>g> partnership will provide infrastructure<br />
improvements of $16 billi<strong>on</strong>, and up to $10 billi<strong>on</strong><br />
worth of maintenance work.<br />
The PPP is predominantly a performance-based<br />
c<strong>on</strong>tract, and <str<strong>on</strong>g>the</str<strong>on</strong>g> Infracos are paid to deliver a<br />
required level of service and to maintain <str<strong>on</strong>g>the</str<strong>on</strong>g> assets in<br />
a state of good repair as follows:<br />
Availability (reliability)<br />
n Day-to-day service reliability, measured by<br />
recording any disrupti<strong>on</strong> >=2 minutes;<br />
n Lost customer hours, measured by <str<strong>on</strong>g>the</str<strong>on</strong>g> length of<br />
incidents multiplied by a locati<strong>on</strong> and time of day<br />
factor; and<br />
n B<strong>on</strong>us payments at $6 an hour if better than<br />
benchmark. Abatements at $6 an hour if worse<br />
than benchmark and above unacceptable, and<br />
$9 an hour if worse than unacceptable.<br />
Capability (capacity)<br />
n Practical capacity of each line measured by a<br />
journey time capability score;<br />
n Infracos can improve <str<strong>on</strong>g>the</str<strong>on</strong>g> score by adding<br />
capacity (more trains for service); and<br />
n Infracos are paid for additi<strong>on</strong>al capability based<br />
<strong>on</strong> a capability score for each period compared to<br />
<str<strong>on</strong>g>the</str<strong>on</strong>g> pre-defined benchmark and unacceptable<br />
scores.<br />
Ambience (quality)<br />
n The quality of <str<strong>on</strong>g>the</str<strong>on</strong>g> traveling envir<strong>on</strong>ment (e.g.,<br />
cleanliness, ride quality, PA audibility, and levels<br />
of litter) is measured through a quarterly Mystery<br />
Shopping Survey (MSS); and<br />
n Payment is based <strong>on</strong> <str<strong>on</strong>g>the</str<strong>on</strong>g> MSS score for each<br />
period compared to <str<strong>on</strong>g>the</str<strong>on</strong>g> pre-defined benchmark<br />
and unacceptable scores.
Approaches to Financing<br />
C<strong>on</strong>diti<strong>on</strong> (state of good repair)<br />
n Infracos must maintain, renew and manage <str<strong>on</strong>g>the</str<strong>on</strong>g><br />
assets so as to ensure reas<strong>on</strong>able life<br />
expectancy (defined as assets in c<strong>on</strong>diti<strong>on</strong> A-C)<br />
no later than <str<strong>on</strong>g>the</str<strong>on</strong>g> third review period;<br />
n Infracos must also achieve specified c<strong>on</strong>diti<strong>on</strong> or<br />
residual life benchmarks by <str<strong>on</strong>g>the</str<strong>on</strong>g> end of <str<strong>on</strong>g>the</str<strong>on</strong>g><br />
c<strong>on</strong>tract; and<br />
n During <str<strong>on</strong>g>the</str<strong>on</strong>g> first review period (7.5 years), all grey<br />
assets (c<strong>on</strong>diti<strong>on</strong> unknown) must be assessed.<br />
Fault <str<strong>on</strong>g>Report</str<strong>on</strong>g>ing (repairs)<br />
n Infraco must rectify all asset related faults<br />
reported by LU staff.<br />
n Service points are allocated to certain failures if<br />
Infracos do not meet c<strong>on</strong>tractual obligati<strong>on</strong>s.<br />
Major Projects (line upgrades)<br />
n Major projects involving replacement of trains<br />
and signals which increase <str<strong>on</strong>g>the</str<strong>on</strong>g> capability to<br />
deliver improvements in trip times.<br />
Stati<strong>on</strong> Refurbishment and Modernizati<strong>on</strong><br />
n Infracos must implement a program of stati<strong>on</strong><br />
modernizati<strong>on</strong> and refurbishment as specified in<br />
<str<strong>on</strong>g>the</str<strong>on</strong>g> c<strong>on</strong>tract.<br />
n Any project not delivered by <str<strong>on</strong>g>the</str<strong>on</strong>g> latest completi<strong>on</strong><br />
date will incur abatements. Abatement is levied<br />
until <str<strong>on</strong>g>the</str<strong>on</strong>g> project is completed and varies<br />
according to <str<strong>on</strong>g>the</str<strong>on</strong>g> scale of <str<strong>on</strong>g>the</str<strong>on</strong>g> project.<br />
After five years of operating with <str<strong>on</strong>g>the</str<strong>on</strong>g> PPP, <str<strong>on</strong>g>the</str<strong>on</strong>g><br />
L<strong>on</strong>d<strong>on</strong> Transport Assembly, in its January 2007<br />
Review, stated: “There have been some very<br />
worthwhile gains from <str<strong>on</strong>g>the</str<strong>on</strong>g> PPP. When we have seen<br />
<str<strong>on</strong>g>the</str<strong>on</strong>g> private sector at its best, <str<strong>on</strong>g>the</str<strong>on</strong>g> results have been<br />
impressive. They have had much better relati<strong>on</strong>ships<br />
with <str<strong>on</strong>g>the</str<strong>on</strong>g>ir workforce, and have been inventive and<br />
resourceful in using innovative engineering soluti<strong>on</strong>s<br />
to overcome challenges <strong>on</strong> <str<strong>on</strong>g>the</str<strong>on</strong>g> Tube network that<br />
should have been tackled decades ago.”<br />
44<br />
However, <strong>on</strong> July 18, 2007, <str<strong>on</strong>g>the</str<strong>on</strong>g> Metr<strong>on</strong>et Infracos<br />
collapsed after a $4-billi<strong>on</strong> cost overrun <strong>on</strong> <str<strong>on</strong>g>the</str<strong>on</strong>g>ir PPP<br />
c<strong>on</strong>tracts. The Transport Committee's report <strong>on</strong> <str<strong>on</strong>g>the</str<strong>on</strong>g><br />
failure laid much of <str<strong>on</strong>g>the</str<strong>on</strong>g> blame for <str<strong>on</strong>g>the</str<strong>on</strong>g> problems<br />
surrounding <str<strong>on</strong>g>the</str<strong>on</strong>g> c<strong>on</strong>sortium of private sector<br />
companies with <str<strong>on</strong>g>the</str<strong>on</strong>g> UK Department for Transport,<br />
which it said should have been seen that <str<strong>on</strong>g>the</str<strong>on</strong>g><br />
proposed management structure of <str<strong>on</strong>g>the</str<strong>on</strong>g> c<strong>on</strong>tracts<br />
would be incapable of efficient delivery. Thus, this<br />
PPP cannot be c<strong>on</strong>sidered an unmitigated success.<br />
If we are willing to learn from <str<strong>on</strong>g>the</str<strong>on</strong>g>ir successes and<br />
mistakes <str<strong>on</strong>g>the</str<strong>on</strong>g>n <str<strong>on</strong>g>the</str<strong>on</strong>g>re is much positive knowledge we<br />
can take from this example.<br />
The L<strong>on</strong>d<strong>on</strong> Underground experience is intriguing in<br />
that it provides experience <strong>on</strong> how private sector<br />
investors can, or cannot, make a profit operating a<br />
public enterprise while protecting <str<strong>on</strong>g>the</str<strong>on</strong>g> public interest.<br />
It shows how a guaranteed public funding stream can<br />
be leveraged to provide very substantial up-fr<strong>on</strong>t<br />
investment in infrastructure renewal and also realize<br />
<str<strong>on</strong>g>the</str<strong>on</strong>g> benefits of private sector management. This can<br />
be d<strong>on</strong>e at a cost comparable to <str<strong>on</strong>g>the</str<strong>on</strong>g> cost of issuing<br />
public b<strong>on</strong>ds. Private sector management has <str<strong>on</strong>g>the</str<strong>on</strong>g><br />
advantage of not being tied to <str<strong>on</strong>g>the</str<strong>on</strong>g> annual budgeting<br />
c<strong>on</strong>straints that make strategic asset management<br />
difficult for public agencies.<br />
r CAPITAL LEASING<br />
Capital leasing is a routine way of financing capital<br />
equipment in <str<strong>on</strong>g>the</str<strong>on</strong>g> U.S. In 1987 <str<strong>on</strong>g>the</str<strong>on</strong>g> Surface<br />
Transportati<strong>on</strong> and Uniform Relocati<strong>on</strong> Assistance<br />
Act (STURAA) started <strong>Federal</strong> support for capital<br />
leasing. This was codified into law by TEA-21 and<br />
remained unchanged in SAFETEA-LU.<br />
Grantees may use <strong>Federal</strong> funds for capital<br />
assistance for up to 80 percent of <str<strong>on</strong>g>the</str<strong>on</strong>g> cost of<br />
acquiring transit assets by lease. A capital lease can<br />
be used to purchase capital equipment such as<br />
vehicles, or it can be used to purchase a combinati<strong>on</strong><br />
of capital and maintenance services such as chassis<br />
rebuilding and engine/drive train replacement.
Capital leases can not be l<strong>on</strong>ger than <str<strong>on</strong>g>the</str<strong>on</strong>g> useful life<br />
of <str<strong>on</strong>g>the</str<strong>on</strong>g> asset, nor less than 75% of <str<strong>on</strong>g>the</str<strong>on</strong>g> useful life of<br />
<str<strong>on</strong>g>the</str<strong>on</strong>g> leased asset. They may include financing<br />
charges and ancillary costs such as delivery and<br />
installati<strong>on</strong>. <strong>Transit</strong> agencies should use cost-benefit<br />
analysis to decide whe<str<strong>on</strong>g>the</str<strong>on</strong>g>r to lease or to buy.<br />
Capital leases can help agencies with insufficient<br />
revenues meet project requirements; it increases<br />
<str<strong>on</strong>g>the</str<strong>on</strong>g>ir cash flow to match outlays. They are usually<br />
used to facilitate fleet replacement or to accelerate<br />
capital rehabilitati<strong>on</strong> and replacement programs,<br />
which can lead to reducti<strong>on</strong>s in operating and<br />
maintenance costs. This helps reduce capital<br />
acquisiti<strong>on</strong> costs by moving forward purchases of<br />
expensive capital assets when capital costs are rising<br />
faster than <str<strong>on</strong>g>the</str<strong>on</strong>g> general level of inflati<strong>on</strong>.<br />
Capital leasing is not without risks. Troubles may<br />
arise if an agency is unable to secure future<br />
appropriati<strong>on</strong>s to pay off <str<strong>on</strong>g>the</str<strong>on</strong>g>ir leases. An agency<br />
may also run into problems if it overextends its lease<br />
commitments, leaving it with insufficient future<br />
funding to meet its c<strong>on</strong>tractual obligati<strong>on</strong>s.<br />
r REVENUE BONDS<br />
Revenue b<strong>on</strong>ds are ano<str<strong>on</strong>g>the</str<strong>on</strong>g>r source of funds for<br />
transit systems. Revenue b<strong>on</strong>ds may be issued<br />
directly by a transit agency or by a state or local<br />
government and secured by repayment from <str<strong>on</strong>g>the</str<strong>on</strong>g><br />
transit agency. A public referendum may be required<br />
before a revenue b<strong>on</strong>d can be issued.<br />
In most jurisdicti<strong>on</strong>s, public transit systems are<br />
authorized by statute or ordinance to issue debt<br />
secured with a variety of revenue sources, such as<br />
motor vehicle registrati<strong>on</strong>s, sales taxes, and property<br />
taxes. TEA-21 authorized <str<strong>on</strong>g>the</str<strong>on</strong>g> use of farebox<br />
revenues and anticipated grant receipts as additi<strong>on</strong>al<br />
sources of collateral for revenue b<strong>on</strong>ds.<br />
Revenue b<strong>on</strong>ds can <strong>on</strong>ly be backed by farebox<br />
revenues if <str<strong>on</strong>g>the</str<strong>on</strong>g> level of State and local funding<br />
committed to transit for <str<strong>on</strong>g>the</str<strong>on</strong>g> 3 years following <str<strong>on</strong>g>the</str<strong>on</strong>g> b<strong>on</strong>d<br />
45<br />
issue are higher than <str<strong>on</strong>g>the</str<strong>on</strong>g> funds that were committed<br />
in <str<strong>on</strong>g>the</str<strong>on</strong>g> 3 years prior to <str<strong>on</strong>g>the</str<strong>on</strong>g> b<strong>on</strong>d issue. Agencies must<br />
identify ano<str<strong>on</strong>g>the</str<strong>on</strong>g>r source of funds for <str<strong>on</strong>g>the</str<strong>on</strong>g>ir operating<br />
expenses before issuing a revenue b<strong>on</strong>d.<br />
NY MTA has been <str<strong>on</strong>g>the</str<strong>on</strong>g> <strong>on</strong>ly agency to issue b<strong>on</strong>ds<br />
backed by farebox revenues, although <str<strong>on</strong>g>the</str<strong>on</strong>g>se b<strong>on</strong>ds<br />
were also backed by o<str<strong>on</strong>g>the</str<strong>on</strong>g>r revenues and are much<br />
closer to <str<strong>on</strong>g>the</str<strong>on</strong>g> traditi<strong>on</strong>al c<strong>on</strong>cept of a revenue b<strong>on</strong>d.<br />
r GRANT ANTICIPATION NOTES<br />
Revenue b<strong>on</strong>ds that<br />
are backed by<br />
anticipated grant<br />
receipts are called<br />
grant anticipati<strong>on</strong><br />
notes (GANs).<br />
GANs were made<br />
possible by funding firewalls in TEA-21, which allow<br />
principal and interest <strong>on</strong> GANs to be repaid with FTA<br />
capital funding. Prior to TEA-21, future <strong>Federal</strong><br />
funding had been used as <strong>on</strong>e, but not as a sole,<br />
source of funds for repayment of revenue b<strong>on</strong>ds.<br />
The proceeds raised by a GAN can be used for <str<strong>on</strong>g>the</str<strong>on</strong>g><br />
local match for a transit project. In 1997 New Jersey<br />
<strong>Transit</strong> was <str<strong>on</strong>g>the</str<strong>on</strong>g> first agency to issue b<strong>on</strong>ds backed<br />
solely or primarily by anticipated <strong>Federal</strong> formula<br />
funding. Since <str<strong>on</strong>g>the</str<strong>on</strong>g>n over $3.2 billi<strong>on</strong> in GANs have<br />
been issued. Terms have ranged from 3-to-15 years<br />
for principal ranging from $18-to-$450 milli<strong>on</strong>.<br />
GANs secured by Secti<strong>on</strong> 5307 and 5309 program<br />
funds are c<strong>on</strong>sidered to have lower levels of risk than<br />
GANs that are backed by a New Starts full-funding<br />
grant agreement.<br />
The most recent GAN was made in July 2006. It<br />
authorized <str<strong>on</strong>g>the</str<strong>on</strong>g> Alaska Railroad to issue up to $165<br />
milli<strong>on</strong> in tax exempt b<strong>on</strong>ds backed by FTA Secti<strong>on</strong><br />
urbanized area formula funds and fixed guideway<br />
modernizati<strong>on</strong> funds. Proceeds will be used to<br />
accelerate <str<strong>on</strong>g>the</str<strong>on</strong>g> railroad's mainline track and bridge<br />
rehabilitati<strong>on</strong> program by as much as ten years.
Approaches to Financing<br />
The Chicago <strong>Transit</strong> Authority (CTA) used a GAN in<br />
October 2004 to issue $250 milli<strong>on</strong> in notes backed<br />
by FTA urbanized area formula funds. This now<br />
supports renovati<strong>on</strong> of <str<strong>on</strong>g>the</str<strong>on</strong>g> Dan Ryan branch of <str<strong>on</strong>g>the</str<strong>on</strong>g><br />
Red Line, expansi<strong>on</strong> of <str<strong>on</strong>g>the</str<strong>on</strong>g> Brown Line, stati<strong>on</strong> and<br />
bus garage rec<strong>on</strong>structi<strong>on</strong>, new rail car procurement,<br />
and bus farebox replacement.<br />
r DEBT SERVICE RESERVE<br />
Debt service reserves are cash reserves set aside by<br />
a borrower to ensure full and timely payments to<br />
b<strong>on</strong>d holders. They have been used for many years<br />
by private business and public entities to support<br />
debt issues. SAFETEA-LU authorized transit<br />
grantees to be reimbursed for up to 80 percent of <str<strong>on</strong>g>the</str<strong>on</strong>g><br />
deposits in a debt service reserve established for <str<strong>on</strong>g>the</str<strong>on</strong>g><br />
purpose of financing transit capital projects from 5307<br />
and 5309 funds.<br />
It is hoped that transit agencies will benefit from cost<br />
savings from a higher initial b<strong>on</strong>d rating resulting from<br />
<str<strong>on</strong>g>the</str<strong>on</strong>g> establishment of a reserve fund. To create a debt<br />
service fund an agency must first issue b<strong>on</strong>ds, equal<br />
to about <strong>on</strong>e year’s worth of debt service payments,<br />
to support an eligible transit capital project. The<br />
agency can <str<strong>on</strong>g>the</str<strong>on</strong>g>n apply for 80% reimbursement.<br />
To date, no transit agency has applied for<br />
reimbursement of a debt service reserve.<br />
r TIFIA<br />
The Transportati<strong>on</strong> Infrastructure Finance and<br />
Innovati<strong>on</strong> Act (TIFIA) was created under TEA-21<br />
and reauthorized under SAFETEA-LU. It is<br />
administered by <str<strong>on</strong>g>the</str<strong>on</strong>g> U.S. Department of<br />
Transportati<strong>on</strong> and offers eligible applicants, with<br />
eligible projects, <str<strong>on</strong>g>the</str<strong>on</strong>g> opportunity to compete for<br />
secured loans, loan guarantees and standby lines of<br />
credit. Credit assistance is based <strong>on</strong> a variety of<br />
factors, including <str<strong>on</strong>g>the</str<strong>on</strong>g> repayment potential of <str<strong>on</strong>g>the</str<strong>on</strong>g><br />
project; recent applicati<strong>on</strong>s have included c<strong>on</strong>cessi<strong>on</strong><br />
fees for this purpose.<br />
46<br />
Three transit projects have used TIFIA assistance;<br />
two have been public-private partnerships. One of<br />
<str<strong>on</strong>g>the</str<strong>on</strong>g>se was <str<strong>on</strong>g>the</str<strong>on</strong>g> Washingt<strong>on</strong> Metropolitan Area <strong>Transit</strong><br />
Authority (WMATA) Infrastructure Renewal Program<br />
which received a $600 milli<strong>on</strong> guarantee.<br />
r OBSERVATIONS FROM <strong>SGR</strong><br />
WORKSHOP<br />
At <str<strong>on</strong>g>the</str<strong>on</strong>g> FTA <strong>SGR</strong> Workshop, agency participants<br />
shared <str<strong>on</strong>g>the</str<strong>on</strong>g>ir experiences using a variety of alternative<br />
financing mechanisms – including Grant Anticipati<strong>on</strong><br />
Notes, lease-leaseback arrangements, public-private<br />
partnerships, and TIFIA as a means of financing <str<strong>on</strong>g>the</str<strong>on</strong>g>ir<br />
capital needs (primarily for expansi<strong>on</strong> needs). A<br />
number of agencies reported using b<strong>on</strong>d<br />
mechanisms to help meet <str<strong>on</strong>g>the</str<strong>on</strong>g>ir <strong>SGR</strong> investment<br />
needs, but cauti<strong>on</strong>ed that <str<strong>on</strong>g>the</str<strong>on</strong>g>ir current debt service<br />
expenses were now an obstacle to fur<str<strong>on</strong>g>the</str<strong>on</strong>g>r use of this<br />
mechanism.<br />
All participants agreed that alternative financing<br />
mechanisms can help agencies achieve <strong>SGR</strong> in <str<strong>on</strong>g>the</str<strong>on</strong>g><br />
short-term, with some l<strong>on</strong>g-term costs such as debt<br />
service. Participants also agreed that agencies<br />
should weigh <str<strong>on</strong>g>the</str<strong>on</strong>g> higher operating costs of not being<br />
at <strong>SGR</strong> against any financing costs before utilizing<br />
<str<strong>on</strong>g>the</str<strong>on</strong>g> debt financing opti<strong>on</strong> for asset replacement.<br />
r ISSUES REMAINING<br />
Following are additi<strong>on</strong>al questi<strong>on</strong>s for <str<strong>on</strong>g>the</str<strong>on</strong>g> industry to<br />
address with respect to <str<strong>on</strong>g>the</str<strong>on</strong>g> use of alternative funding<br />
mechanisms to help attain an overall state of good<br />
repair:<br />
n <strong>Transit</strong> agencies have a resp<strong>on</strong>sibility to serve<br />
<str<strong>on</strong>g>the</str<strong>on</strong>g> public interest in many ways. Private<br />
partners are necessarily motivated primarily by<br />
profit. How can an agency retain enough c<strong>on</strong>trol<br />
to meet a diverse set of objectives while<br />
c<strong>on</strong>tracting out large porti<strong>on</strong>s of its activities?<br />
n One of <str<strong>on</strong>g>the</str<strong>on</strong>g> L<strong>on</strong>d<strong>on</strong> Underground Infracos went<br />
into receivership and cost <str<strong>on</strong>g>the</str<strong>on</strong>g> government a
eported $4 billi<strong>on</strong>. How can PPP c<strong>on</strong>tracts be<br />
written to protect <str<strong>on</strong>g>the</str<strong>on</strong>g> public interest?<br />
n PPP c<strong>on</strong>tracts are complex and can take a l<strong>on</strong>g<br />
time to negotiate. Most transit agencies have<br />
little experience with this kind of c<strong>on</strong>tracting,<br />
whereas private investors often have a great<br />
deal. How can we protect our interests when<br />
dealing with a far more sophisticated private<br />
partner?<br />
47<br />
n Which of <str<strong>on</strong>g>the</str<strong>on</strong>g>se funding models can be used to<br />
address maintenance and replacement backlogs<br />
while minimizing <str<strong>on</strong>g>the</str<strong>on</strong>g> need for up-fr<strong>on</strong>t funding?<br />
n Should <str<strong>on</strong>g>the</str<strong>on</strong>g> <strong>Federal</strong> Government act as an<br />
investor to provide incentive-based funding that<br />
could be paid back as it is in PPPs, or in<br />
infrastructure b<strong>on</strong>ds?
Research Needs<br />
r OVERVIEW<br />
What kinds of research would help <str<strong>on</strong>g>the</str<strong>on</strong>g> transit industry<br />
pursue a state of good repair for <str<strong>on</strong>g>the</str<strong>on</strong>g> nati<strong>on</strong>’s bus and rail<br />
transit rolling stock and infrastructure? This paper formed<br />
<str<strong>on</strong>g>the</str<strong>on</strong>g> basis of a discussi<strong>on</strong> <strong>on</strong> research needs at <str<strong>on</strong>g>the</str<strong>on</strong>g><br />
workshop. The key questi<strong>on</strong>s we hope <str<strong>on</strong>g>the</str<strong>on</strong>g> industry will<br />
help to answer during that discussi<strong>on</strong> are:<br />
n What are some of <str<strong>on</strong>g>the</str<strong>on</strong>g> resources for funding federal<br />
research?<br />
n What have we learned from previous research <strong>on</strong><br />
maintaining <str<strong>on</strong>g>the</str<strong>on</strong>g> transit capital assets?<br />
n What are some specific safety research topics that<br />
may help a transit agency achieve <strong>SGR</strong>?<br />
n What are some of <str<strong>on</strong>g>the</str<strong>on</strong>g> technology advances that<br />
might help better maintain <str<strong>on</strong>g>the</str<strong>on</strong>g> nati<strong>on</strong>’s transit capital<br />
assets?<br />
n What are some of <str<strong>on</strong>g>the</str<strong>on</strong>g> <strong>SGR</strong> research gaps that<br />
should be addressed by transit research?<br />
About half of all passenger miles traveled and 37% of<br />
passenger trips are taken <strong>on</strong> rail systems, yet a small<br />
percentage of FTA’s Research and Technology funding is<br />
allocated to rail. So, while this <strong>SGR</strong> industry workshop<br />
will focus <strong>on</strong> rail and bus systems, a large gap exists with<br />
regard to rail transit infrastructure research.<br />
r BACKGROUND<br />
FTA uses industry input to prioritize and shape our<br />
research programs. Most suggesti<strong>on</strong>s come from<br />
dialogue with <str<strong>on</strong>g>the</str<strong>on</strong>g> industry. The <strong>Transit</strong> Research Analysis<br />
Committee (TRAC) meets twice each year and advises<br />
FTA <strong>on</strong> research strategy. While C<strong>on</strong>gressi<strong>on</strong>al<br />
earmarks make up <str<strong>on</strong>g>the</str<strong>on</strong>g> majority of research expenditures,<br />
FTA works closely with grantees to ensure <str<strong>on</strong>g>the</str<strong>on</strong>g>se<br />
earmarks address goals and objectives found in <str<strong>on</strong>g>the</str<strong>on</strong>g><br />
agency’s Strategic Research Plan.<br />
Research Needs<br />
FTA State of Good Repair Workshop<br />
48<br />
Besides <str<strong>on</strong>g>the</str<strong>on</strong>g> Nati<strong>on</strong>al Research and Technology Program,<br />
FTA’s two o<str<strong>on</strong>g>the</str<strong>on</strong>g>r transit research programs are <str<strong>on</strong>g>the</str<strong>on</strong>g><br />
University Transportati<strong>on</strong> Centers (UTC) Program<br />
(funded by FHWA) and <str<strong>on</strong>g>the</str<strong>on</strong>g> <strong>Transit</strong> Cooperative Research<br />
Program (TCRP). There are opportunities to utilize <str<strong>on</strong>g>the</str<strong>on</strong>g><br />
talents at UTCs, and those in <str<strong>on</strong>g>the</str<strong>on</strong>g> transit industry, as<br />
TCRP panelists to shape our research program. Their<br />
assistance in identifying and prioritizing research<br />
objectives, questi<strong>on</strong>s and projects will help FTA provide<br />
research leadership to improve <str<strong>on</strong>g>the</str<strong>on</strong>g> industry.<br />
r LITERATURE REVIEW<br />
Some literature related to <str<strong>on</strong>g>the</str<strong>on</strong>g> state of good repair exists<br />
already. Listed below are some <strong>on</strong>line resources for<br />
researching topics related to <str<strong>on</strong>g>the</str<strong>on</strong>g> state of good repair.
<str<strong>on</strong>g>Report</str<strong>on</strong>g>s developed by <str<strong>on</strong>g>the</str<strong>on</strong>g> University Transportati<strong>on</strong><br />
Centers (UTC) program can be found at:<br />
http://utc.dot.gov/utc_results.html<br />
The <strong>Transit</strong> Cooperative Research Program (TCRP) has<br />
developed reports that include resource materials <strong>on</strong><br />
maintenance. TCRP “Research Field E: Maintenance”<br />
c<strong>on</strong>tains informati<strong>on</strong> <strong>on</strong>:<br />
n Bus maintenance practices<br />
n <strong>Transit</strong> railcar diagnostics<br />
n Inventory management<br />
n Maintenance training standards<br />
No single TCRP report appears to be a comprehensive<br />
examinati<strong>on</strong> of <str<strong>on</strong>g>the</str<strong>on</strong>g> issues <strong>on</strong> how to maintain <str<strong>on</strong>g>the</str<strong>on</strong>g> nati<strong>on</strong>’s<br />
aging transit capital assets. More informati<strong>on</strong> can be<br />
found at: http://www.tcrp<strong>on</strong>line.org/<br />
The Nati<strong>on</strong>al Technical Informati<strong>on</strong> Service is<br />
administered by <str<strong>on</strong>g>the</str<strong>on</strong>g> U.S. Department of Commerce and<br />
serves as <str<strong>on</strong>g>the</str<strong>on</strong>g> largest central resource for governmentfunded<br />
scientific, technical, engineering, and business<br />
related informati<strong>on</strong> available today. More informati<strong>on</strong> can<br />
be found at: www.ntis.gov<br />
The Transportati<strong>on</strong> Research Informati<strong>on</strong> Services<br />
(TRIS) c<strong>on</strong>tains over 640,000 records of published<br />
research and almost 25,000 new records are added to<br />
TRIS each year. It is produced and maintained by <str<strong>on</strong>g>the</str<strong>on</strong>g><br />
Transportati<strong>on</strong> Research Board. To review research, go<br />
to: http://ntlsearch.bts.gov/tris/index.do<br />
The following reports address <str<strong>on</strong>g>the</str<strong>on</strong>g> state of repair for <str<strong>on</strong>g>the</str<strong>on</strong>g><br />
nati<strong>on</strong>’s transportati<strong>on</strong> capital assets.<br />
GAO: Physical Infrastructure: Challenges and Investment<br />
Opti<strong>on</strong>s for <str<strong>on</strong>g>the</str<strong>on</strong>g> Nati<strong>on</strong>’s Infrastructure (May 8, 2008).<br />
The report identifies <str<strong>on</strong>g>the</str<strong>on</strong>g> challenges associated with <str<strong>on</strong>g>the</str<strong>on</strong>g><br />
nati<strong>on</strong>’s surface transportati<strong>on</strong> capital assets and <str<strong>on</strong>g>the</str<strong>on</strong>g><br />
principles GAO identified to address those challenges. It<br />
also examines existing and proposed opti<strong>on</strong>s to fund<br />
investments in <str<strong>on</strong>g>the</str<strong>on</strong>g> nati<strong>on</strong>’s capital assets. The report can<br />
be found at: http://www.gao.gov/new.items/d08763t.pdf<br />
49<br />
The Infrastructure Crisis – American Society of Civil<br />
Engineer’s (ASCE) (January 2008). This special report<br />
examines <str<strong>on</strong>g>the</str<strong>on</strong>g> state of <str<strong>on</strong>g>the</str<strong>on</strong>g> nati<strong>on</strong>’s infrastructure in 15<br />
major categories, as outlined in ASCE’s three “report<br />
cards,” as well as <str<strong>on</strong>g>the</str<strong>on</strong>g> various causes and costs<br />
associated with <str<strong>on</strong>g>the</str<strong>on</strong>g> problem, and explores some possible<br />
soluti<strong>on</strong>s. The report can be found at:<br />
http://pubs.asce.org/magazines/CEMag/2008/Issue_01<br />
08/article1.htm<br />
2006 Status of <str<strong>on</strong>g>the</str<strong>on</strong>g> Nati<strong>on</strong>’s Highways, Bridges and<br />
<strong>Transit</strong>: C<strong>on</strong>diti<strong>on</strong>s and Performance <str<strong>on</strong>g>Report</str<strong>on</strong>g> to C<strong>on</strong>gress.<br />
This report is completed every two years.<br />
The latest report can be found at:<br />
https://www.fhwa.dot.gov/policy/2006cpr/index.htm<br />
r FUTURE RESEARCH INITIATIVES<br />
NEEDS/QUESTIONS<br />
What are some of <str<strong>on</strong>g>the</str<strong>on</strong>g> most pressing issues facing <str<strong>on</strong>g>the</str<strong>on</strong>g><br />
transit industry with regard to <strong>SGR</strong>? What “low hanging<br />
fruit” research needs can be addressed immediately?<br />
This paper identifies five major areas of research needs:<br />
Technologies:<br />
n There are technologies and maintenance strategies<br />
that could help support more reliable equipment and<br />
safer infrastructure. The Transportati<strong>on</strong> Technology<br />
Center, Inc., in Pueblo, CO, is just <strong>on</strong>e example of an<br />
organizati<strong>on</strong> that develops such tools. What<br />
technologies will best support better transit<br />
equipment c<strong>on</strong>diti<strong>on</strong>s? (e.g, c<strong>on</strong>diti<strong>on</strong>-based<br />
maintenance, infrastructure health m<strong>on</strong>itoring<br />
systems, etc.)<br />
n Assuming <str<strong>on</strong>g>the</str<strong>on</strong>g> industry can identify and develop <str<strong>on</strong>g>the</str<strong>on</strong>g>se<br />
new technologies, what should be <str<strong>on</strong>g>the</str<strong>on</strong>g> return <strong>on</strong><br />
investment (ROI) or payback time of such<br />
technologies?<br />
Measurement Tools:<br />
n The C<strong>on</strong>diti<strong>on</strong>s and Performance report defines how<br />
to measure <str<strong>on</strong>g>the</str<strong>on</strong>g> c<strong>on</strong>diti<strong>on</strong> of rail and bus maintenance<br />
facilities, operati<strong>on</strong>al performance, safety<br />
performance, and o<str<strong>on</strong>g>the</str<strong>on</strong>g>r transit elements. How do we<br />
define and measure state of good repair for various
Research Needs<br />
transit assets so that it is c<strong>on</strong>sistent with <str<strong>on</strong>g>the</str<strong>on</strong>g><br />
C<strong>on</strong>diti<strong>on</strong>s and Performance <str<strong>on</strong>g>Report</str<strong>on</strong>g>?<br />
n <strong>Transit</strong> agencies are often forced to make funding<br />
decisi<strong>on</strong>s that impact upkeep and maintenance of<br />
<str<strong>on</strong>g>the</str<strong>on</strong>g>ir assets. How does deferred maintenance impact<br />
modeling state of good repair?<br />
n APTA and o<str<strong>on</strong>g>the</str<strong>on</strong>g>r standards development<br />
organizati<strong>on</strong>s have grown and vetted maintenance<br />
standards within <str<strong>on</strong>g>the</str<strong>on</strong>g> transit industry. What are some<br />
potential standards that, if developed, will improve<br />
<strong>SGR</strong>?<br />
n The data for <str<strong>on</strong>g>the</str<strong>on</strong>g> C<strong>on</strong>diti<strong>on</strong>s and Performance <str<strong>on</strong>g>Report</str<strong>on</strong>g><br />
and o<str<strong>on</strong>g>the</str<strong>on</strong>g>r reports comes from transit agencies. Can<br />
FTA’s Transportati<strong>on</strong> Ec<strong>on</strong>omic Requirements Model<br />
(TERM) be adapted for use by transit agencies and<br />
will that lead to better predicti<strong>on</strong>s about future<br />
c<strong>on</strong>diti<strong>on</strong>s and funding needs?<br />
n FTA collects a variety of informati<strong>on</strong> for <str<strong>on</strong>g>the</str<strong>on</strong>g> Nati<strong>on</strong>al<br />
<strong>Transit</strong> Database (NTD) which is published annually.<br />
Does this accident and service delay data correlate<br />
with state of good repair ratings?<br />
n Many transit agencies base <str<strong>on</strong>g>the</str<strong>on</strong>g>ir maintenance<br />
schedule <strong>on</strong> <str<strong>on</strong>g>the</str<strong>on</strong>g> miles a transit vehicle has traveled<br />
or how l<strong>on</strong>g an asset has been utilized. Can a service<br />
to maintenance budget ratio be devised that<br />
correlates to state of good repair ratings?<br />
Case Studies:<br />
n TERM is <str<strong>on</strong>g>the</str<strong>on</strong>g> source for determining <str<strong>on</strong>g>the</str<strong>on</strong>g> current state<br />
of transit c<strong>on</strong>diti<strong>on</strong>s and performance. Should an<br />
evaluati<strong>on</strong> of TERM and o<str<strong>on</strong>g>the</str<strong>on</strong>g>r existing models used<br />
to predict and define <strong>SGR</strong> be c<strong>on</strong>ducted?<br />
n O<str<strong>on</strong>g>the</str<strong>on</strong>g>r transportati<strong>on</strong> modes are facing <str<strong>on</strong>g>the</str<strong>on</strong>g> same<br />
challenge of keeping an aging capital asset safe and<br />
viable for <str<strong>on</strong>g>the</str<strong>on</strong>g> traveling public. What are <strong>SGR</strong> less<strong>on</strong>s<br />
learned and best practices from o<str<strong>on</strong>g>the</str<strong>on</strong>g>r DOT modes<br />
and industries – highway, airports and railroads?<br />
n The challenges faced by transit agencies to maintain<br />
<str<strong>on</strong>g>the</str<strong>on</strong>g> aging transit capital assets didn’t appear<br />
suddenly. What has been attempted thus far to<br />
address <str<strong>on</strong>g>the</str<strong>on</strong>g> issue? Should case studies be<br />
developed <strong>on</strong> what works/doesn’t work to support<br />
<strong>SGR</strong>?<br />
50<br />
n European countries have maintained extensive<br />
transit systems l<strong>on</strong>ger than <str<strong>on</strong>g>the</str<strong>on</strong>g> U.S. What can we<br />
learn from European and Asian countries with regard<br />
to transit <strong>SGR</strong> and asset management?<br />
n Earlier this year FTA heard a presentati<strong>on</strong> from<br />
representatives from <str<strong>on</strong>g>the</str<strong>on</strong>g> L<strong>on</strong>d<strong>on</strong> Underground<br />
regarding its maintenance and operati<strong>on</strong>. What case<br />
studies can be pulled from systems like <str<strong>on</strong>g>the</str<strong>on</strong>g> L<strong>on</strong>d<strong>on</strong><br />
Underground?<br />
Private Sector:<br />
n A few U.S. transit agencies are c<strong>on</strong>sidering<br />
leaseback arrangements. For example, a major<br />
transit authority is nearing agreement to sell and<br />
lease back <strong>on</strong>e of its rapid transit lines. There should<br />
be a life cycle cost examinati<strong>on</strong> or research<br />
c<strong>on</strong>ducted <strong>on</strong> leaseback arrangements such as <str<strong>on</strong>g>the</str<strong>on</strong>g><br />
leasing of transit vehicles or entire lines. Is this a<br />
good model to follow? What are <str<strong>on</strong>g>the</str<strong>on</strong>g> l<strong>on</strong>g-term<br />
benefits and downsides?<br />
n Public Private Partnerships (PPPs) appear to be <str<strong>on</strong>g>the</str<strong>on</strong>g><br />
wave of <str<strong>on</strong>g>the</str<strong>on</strong>g> future with regard to funding transit<br />
needs. What are <str<strong>on</strong>g>the</str<strong>on</strong>g> various ways that PPPs can<br />
help in maintaining <str<strong>on</strong>g>the</str<strong>on</strong>g> transit infrastructure?
n The Design Build Operate Maintain (DBOM) c<strong>on</strong>cept<br />
has proven to be a reliable, cost and time savings<br />
project delivery strategy. In most cases <str<strong>on</strong>g>the</str<strong>on</strong>g> DBOM<br />
c<strong>on</strong>tractor is resp<strong>on</strong>sible for maintaining <str<strong>on</strong>g>the</str<strong>on</strong>g> rail<br />
system assets under c<strong>on</strong>tract. How have DBOM<br />
arrangements worked with regard to maintenance?<br />
An examinati<strong>on</strong> of <str<strong>on</strong>g>the</str<strong>on</strong>g> San Juan Metro and <str<strong>on</strong>g>the</str<strong>on</strong>g> NJT<br />
Huds<strong>on</strong>-Bergen and River Line transit systems<br />
should occur.<br />
O<str<strong>on</strong>g>the</str<strong>on</strong>g>r Research Needs:<br />
n It is important that <str<strong>on</strong>g>the</str<strong>on</strong>g> industry is made aware of any<br />
previous or current examinati<strong>on</strong>s regarding <str<strong>on</strong>g>the</str<strong>on</strong>g> <strong>SGR</strong><br />
so as not to duplicate research. A more rigorous<br />
literature review of <strong>SGR</strong>-related research and an<br />
annotated bibliography should be c<strong>on</strong>sidered.<br />
n With <str<strong>on</strong>g>the</str<strong>on</strong>g> increasing growth of transit ridership, <str<strong>on</strong>g>the</str<strong>on</strong>g><br />
media is spotlighting <str<strong>on</strong>g>the</str<strong>on</strong>g> successes and failures of a<br />
<strong>on</strong>ce overlooked commodity. How does public<br />
percepti<strong>on</strong> play into infrastructure funding and how<br />
can infrastructure needs be better marketed to voters<br />
and decisi<strong>on</strong>-makers?<br />
n Are <strong>Federal</strong> policies and guidelines hindering transit<br />
agencies’ ability to sustain safe and reliable transit<br />
service? Should <strong>Federal</strong> rules be amended to allow<br />
more flexibility with regard to funding <str<strong>on</strong>g>the</str<strong>on</strong>g><br />
maintenance of transit capital assets?<br />
n Fare increases are necessary to maintain a level of<br />
service demanded by <str<strong>on</strong>g>the</str<strong>on</strong>g> public. Service cutbacks<br />
and <str<strong>on</strong>g>the</str<strong>on</strong>g> loss of experienced maintenance pers<strong>on</strong>nel<br />
all impact transit agencies’ ability to provide reliable<br />
operati<strong>on</strong>s. How does deferred maintenance affect<br />
service cutbacks? What’s <str<strong>on</strong>g>the</str<strong>on</strong>g> impact <strong>on</strong> ridership and<br />
public percepti<strong>on</strong>?<br />
r OBSERVATIONS FROM <strong>SGR</strong><br />
WORKSHOP<br />
Participants at <str<strong>on</strong>g>the</str<strong>on</strong>g> <strong>SGR</strong> Workshop highlighted research<br />
needs <strong>on</strong> asset management systems and potential<br />
improvements to FTA’s TERM model during <str<strong>on</strong>g>the</str<strong>on</strong>g> working<br />
sessi<strong>on</strong>, and also indicated research priorities <strong>on</strong> a<br />
written handout. Specific areas of greatest interest to <str<strong>on</strong>g>the</str<strong>on</strong>g><br />
workshop participants included:<br />
51<br />
“TERM Light”: Agencies supported <str<strong>on</strong>g>the</str<strong>on</strong>g> c<strong>on</strong>cept of<br />
developing a simplified agency-level versi<strong>on</strong> of TERM. In<br />
return for supporting FTA in improving TERM’s<br />
capabilities and modeling accuracy, local agencies would<br />
receive a customizable versi<strong>on</strong> of TERM for use by local<br />
agency staff. Many agencies also expressed interest in<br />
participating <strong>on</strong> a Technical Panel to help review <str<strong>on</strong>g>the</str<strong>on</strong>g><br />
assumpti<strong>on</strong>s and methodologies employed by TERM and<br />
to discuss <str<strong>on</strong>g>the</str<strong>on</strong>g> development and use of asset<br />
management decisi<strong>on</strong> support tools in general.<br />
Asset Inventory Development: Similarly, nearly all<br />
resp<strong>on</strong>dents expressed interest in establishing working<br />
groups to share best practices in asset management<br />
techniques. A clear starting point was for agencies to<br />
share <str<strong>on</strong>g>the</str<strong>on</strong>g>ir approaches and rati<strong>on</strong>ale in (1) <str<strong>on</strong>g>the</str<strong>on</strong>g><br />
development of <str<strong>on</strong>g>the</str<strong>on</strong>g>ir asset inventories (what data fields to<br />
include?), in (2) <str<strong>on</strong>g>the</str<strong>on</strong>g> collecti<strong>on</strong> and maintenance of this<br />
asset inventory data, and finally (3) <str<strong>on</strong>g>the</str<strong>on</strong>g> use of this data in<br />
c<strong>on</strong>ducting needs assessments and l<strong>on</strong>g-term capital<br />
planning.<br />
Linear Asset Management Tools: Participants were<br />
particularly interested in learning what o<str<strong>on</strong>g>the</str<strong>on</strong>g>rs had learned<br />
about comprehensive, linear asset management systems.<br />
In particular, a maintenance management system that<br />
could combine all rail asset types (right-of-way, signals,<br />
track, tower, structures, etc.) and that could be used for<br />
both daily practices and l<strong>on</strong>g-term capital programming<br />
was c<strong>on</strong>sidered to be needed.<br />
Maintenance Management Systems: Finally, some<br />
participants stated that <str<strong>on</strong>g>the</str<strong>on</strong>g>re would be some benefit in<br />
developing technical assistance and workshops to help<br />
agencies make better use of <str<strong>on</strong>g>the</str<strong>on</strong>g>ir existing maintenance<br />
management systems. While <str<strong>on</strong>g>the</str<strong>on</strong>g> current systems are<br />
c<strong>on</strong>sidered to provide sufficient functi<strong>on</strong>ality, many<br />
agencies felt <str<strong>on</strong>g>the</str<strong>on</strong>g>y could be deriving more benefits from<br />
<str<strong>on</strong>g>the</str<strong>on</strong>g>se systems by adjusting <str<strong>on</strong>g>the</str<strong>on</strong>g>ir internal management<br />
practices.<br />
In each of <str<strong>on</strong>g>the</str<strong>on</strong>g>se areas, most resp<strong>on</strong>dents agreed <str<strong>on</strong>g>the</str<strong>on</strong>g>re is<br />
a clear role for FTA to offer technical assistance and to<br />
help facilitate disseminati<strong>on</strong> of best practices in asset<br />
management practices and o<str<strong>on</strong>g>the</str<strong>on</strong>g>r approaches to attaining<br />
a state of good repair.