Beginning the Dialogue - Report on SGR - Federal Transit ...
Beginning the Dialogue - Report on SGR - Federal Transit ...
Beginning the Dialogue - Report on SGR - Federal Transit ...

Create successful ePaper yourself
Turn your PDF publications into a flip-book with our unique Google optimized e-Paper software.
Defining and Measuring <strong>SGR</strong><br />
value) that do not exceed <str<strong>on</strong>g>the</str<strong>on</strong>g>ir expected useful life or<br />
(ii) based <strong>on</strong> engineering assessments of <str<strong>on</strong>g>the</str<strong>on</strong>g><br />
proporti<strong>on</strong> of assets that are in “good working order”.<br />
The chart below presents an example of this<br />
measure, showing <str<strong>on</strong>g>the</str<strong>on</strong>g> proporti<strong>on</strong> of U.S. transit<br />
assets, by type, that are less than <str<strong>on</strong>g>the</str<strong>on</strong>g>ir expected<br />
useful life. The chart is based <strong>on</strong> asset data from <str<strong>on</strong>g>the</str<strong>on</strong>g><br />
<strong>Federal</strong> <strong>Transit</strong> Administrati<strong>on</strong>s’ (FTA) <strong>Transit</strong><br />
Ec<strong>on</strong>omic Requirements Model (TERM).<br />
Percent of U.S. <strong>Transit</strong> Assets in <strong>SGR</strong> (Estimate)<br />
Power<br />
Guideway Structures<br />
Trackwork<br />
Elevators / Escalators<br />
Rail (Yards & Shops)<br />
Stati <strong>on</strong>s<br />
Communicati<strong>on</strong>s<br />
Bus Facilities<br />
Revenue Vehi cl es<br />
Signals<br />
0% 20% 40% 60% 80% 100%<br />
While easy to develop and easy to explain to<br />
decisi<strong>on</strong>-makers, percent of assets in <strong>SGR</strong> provides<br />
no informati<strong>on</strong> <strong>on</strong> <str<strong>on</strong>g>the</str<strong>on</strong>g> c<strong>on</strong>diti<strong>on</strong> of assets currently in<br />
<strong>SGR</strong>. For example, are most assets in excellent<br />
shape or will a significant proporti<strong>on</strong> of assets<br />
currently in <strong>SGR</strong> require rehabilitati<strong>on</strong> or replacement<br />
in <str<strong>on</strong>g>the</str<strong>on</strong>g> near future? Percent of assets in <strong>SGR</strong> cannot<br />
shed light <strong>on</strong> <str<strong>on</strong>g>the</str<strong>on</strong>g>se questi<strong>on</strong>s.<br />
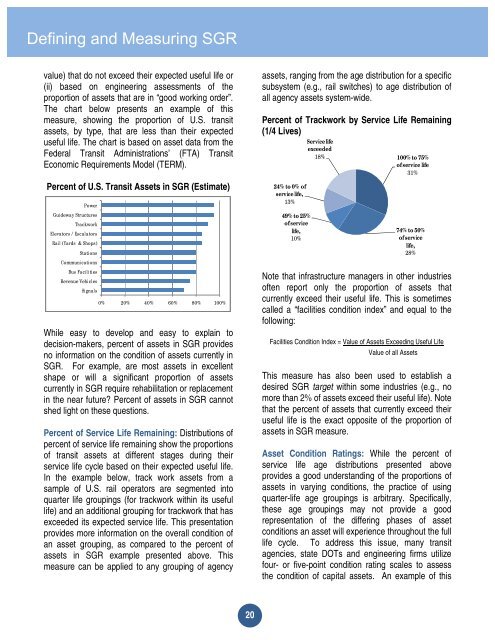
Percent of Service Life Remaining: Distributi<strong>on</strong>s of<br />
percent of service life remaining show <str<strong>on</strong>g>the</str<strong>on</strong>g> proporti<strong>on</strong>s<br />
of transit assets at different stages during <str<strong>on</strong>g>the</str<strong>on</strong>g>ir<br />
service life cycle based <strong>on</strong> <str<strong>on</strong>g>the</str<strong>on</strong>g>ir expected useful life.<br />
In <str<strong>on</strong>g>the</str<strong>on</strong>g> example below, track work assets from a<br />
sample of U.S. rail operators are segmented into<br />
quarter life groupings (for trackwork within its useful<br />
life) and an additi<strong>on</strong>al grouping for trackwork that has<br />
exceeded its expected service life. This presentati<strong>on</strong><br />
provides more informati<strong>on</strong> <strong>on</strong> <str<strong>on</strong>g>the</str<strong>on</strong>g> overall c<strong>on</strong>diti<strong>on</strong> of<br />
an asset grouping, as compared to <str<strong>on</strong>g>the</str<strong>on</strong>g> percent of<br />
assets in <strong>SGR</strong> example presented above. This<br />
measure can be applied to any grouping of agency<br />
20<br />
assets, ranging from <str<strong>on</strong>g>the</str<strong>on</strong>g> age distributi<strong>on</strong> for a specific<br />
subsystem (e.g., rail switches) to age distributi<strong>on</strong> of<br />
all agency assets system-wide.<br />
Percent of Trackwork by Service Life Remaining<br />
(1/4 Lives) Service life<br />
24% to 0% of<br />
service life,<br />
13%<br />
49% to 25%<br />
of service<br />
life,<br />
10%<br />
exceeded<br />
18%<br />
100% to 75%<br />
of service life<br />
31%<br />
74% to 50%<br />
of service<br />
life,<br />
28%<br />
Note that infrastructure managers in o<str<strong>on</strong>g>the</str<strong>on</strong>g>r industries<br />
often report <strong>on</strong>ly <str<strong>on</strong>g>the</str<strong>on</strong>g> proporti<strong>on</strong> of assets that<br />
currently exceed <str<strong>on</strong>g>the</str<strong>on</strong>g>ir useful life. This is sometimes<br />
called a “facilities c<strong>on</strong>diti<strong>on</strong> index” and equal to <str<strong>on</strong>g>the</str<strong>on</strong>g><br />
following:<br />
Facilities C<strong>on</strong>diti<strong>on</strong> Index = Value of Assets Exceeding Useful Life<br />
Value of all Assets<br />
This measure has also been used to establish a<br />
desired <strong>SGR</strong> target within some industries (e.g., no<br />
more than 2% of assets exceed <str<strong>on</strong>g>the</str<strong>on</strong>g>ir useful life). Note<br />
that <str<strong>on</strong>g>the</str<strong>on</strong>g> percent of assets that currently exceed <str<strong>on</strong>g>the</str<strong>on</strong>g>ir<br />
useful life is <str<strong>on</strong>g>the</str<strong>on</strong>g> exact opposite of <str<strong>on</strong>g>the</str<strong>on</strong>g> proporti<strong>on</strong> of<br />
assets in <strong>SGR</strong> measure.<br />
Asset C<strong>on</strong>diti<strong>on</strong> Ratings: While <str<strong>on</strong>g>the</str<strong>on</strong>g> percent of<br />
service life age distributi<strong>on</strong>s presented above<br />
provides a good understanding of <str<strong>on</strong>g>the</str<strong>on</strong>g> proporti<strong>on</strong>s of<br />
assets in varying c<strong>on</strong>diti<strong>on</strong>s, <str<strong>on</strong>g>the</str<strong>on</strong>g> practice of using<br />
quarter-life age groupings is arbitrary. Specifically,<br />
<str<strong>on</strong>g>the</str<strong>on</strong>g>se age groupings may not provide a good<br />
representati<strong>on</strong> of <str<strong>on</strong>g>the</str<strong>on</strong>g> differing phases of asset<br />
c<strong>on</strong>diti<strong>on</strong>s an asset will experience throughout <str<strong>on</strong>g>the</str<strong>on</strong>g> full<br />
life cycle. To address this issue, many transit<br />
agencies, state DOTs and engineering firms utilize<br />
four- or five-point c<strong>on</strong>diti<strong>on</strong> rating scales to assess<br />
<str<strong>on</strong>g>the</str<strong>on</strong>g> c<strong>on</strong>diti<strong>on</strong> of capital assets. An example of this