Beginning the Dialogue - Report on SGR - Federal Transit ...
Beginning the Dialogue - Report on SGR - Federal Transit ...
Beginning the Dialogue - Report on SGR - Federal Transit ...

Create successful ePaper yourself
Turn your PDF publications into a flip-book with our unique Google optimized e-Paper software.
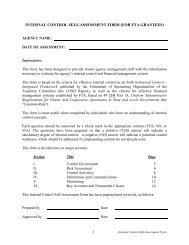
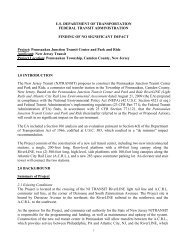
C<strong>on</strong>diti<strong>on</strong>s of <strong>Transit</strong> Infrastructure<br />
Percent of Assets Exceeding Their Useful Life<br />
Asset Type NYCT MBTA TERM<br />
Guideway Elements<br />
(2005) (2006) (2006)<br />
Structures 10% 15% 5%<br />
Trackwork<br />
Facilities<br />
0% 0% 5%<br />
10%<br />
Bus 10% 10% 20%<br />
Rail (Yards &<br />
Shops)<br />
Systems<br />
20% 20% 15%<br />
Signals 25% 30% 30%<br />
Power 10% 10% 5%<br />
Communicati<strong>on</strong>s 0% 40% 20%<br />
Elevators/<br />
0% 25% 15%<br />
Escalators<br />
Stati<strong>on</strong>s 55% 30% 20%<br />
Revenue Vehicles > 5% > 5% 25%<br />
Reinvestment Needs: The table at right presents<br />
agency estimates of <str<strong>on</strong>g>the</str<strong>on</strong>g> level of annual capital<br />
investment as required to address outstanding capital<br />
reinvestment needs for a sample of rail transit<br />
operators, including <str<strong>on</strong>g>the</str<strong>on</strong>g> Bay Area Rapid <strong>Transit</strong><br />
(BART), <str<strong>on</strong>g>the</str<strong>on</strong>g> Chicago <strong>Transit</strong> Authority (CTA), NYCT<br />
and MBTA. 6 The table also shows <str<strong>on</strong>g>the</str<strong>on</strong>g> assumed time<br />
period to address <str<strong>on</strong>g>the</str<strong>on</strong>g> outstanding needs, which<br />
varies significantly across operators, as well as each<br />
agency’s expected (or recent) funding levels and <str<strong>on</strong>g>the</str<strong>on</strong>g><br />
gap between expected funding and unc<strong>on</strong>strained<br />
needs. Finally, <str<strong>on</strong>g>the</str<strong>on</strong>g> table also presents TERM’s<br />
nati<strong>on</strong>al level estimates.<br />
It is clear that unc<strong>on</strong>strained needs (i.e., <str<strong>on</strong>g>the</str<strong>on</strong>g> level of<br />
expenditures required to address both deferred<br />
investments and normal replacements) over various<br />
time periods is less than expected funding levels.<br />
This finding implies that <str<strong>on</strong>g>the</str<strong>on</strong>g> c<strong>on</strong>diti<strong>on</strong> of <str<strong>on</strong>g>the</str<strong>on</strong>g> nati<strong>on</strong>’s<br />
transit assets is likely to decline in <str<strong>on</strong>g>the</str<strong>on</strong>g> absence of<br />
new funding capacity.<br />
6 The data presented here were derived from BART’s FY08 Short<br />
Range <strong>Transit</strong> Plan and Capital Improvement Program, CTA’s 2007<br />
Unfunded Capital Needs, NYCT’s Twenty Year Needs Assessment<br />
2005-2024 and MBTA’s State of Good Repair <str<strong>on</strong>g>Report</str<strong>on</strong>g>: 2006 Editi<strong>on</strong>.<br />
14<br />
Annual Unc<strong>on</strong>strained Needs* vs. Expected<br />
Funding* ($Milli<strong>on</strong>s)<br />
Agency Average Time Expected<br />
Annual Period Annual<br />
Needs (yrs) Funding Gap<br />
BART $386 25 $151 $235<br />
CTA $1,536 5 $376 $1,160<br />
MBTA $620 20 $470 $150<br />
NYCT $2,406 20 $2,162 $244<br />
* Excludes expansi<strong>on</strong> investments<br />
r IMPACT ON PERFORMANCE<br />
The analysis referenced has c<strong>on</strong>sidered <str<strong>on</strong>g>the</str<strong>on</strong>g> current<br />
c<strong>on</strong>diti<strong>on</strong> of <str<strong>on</strong>g>the</str<strong>on</strong>g> nati<strong>on</strong>’s transit assets and estimates<br />
of <str<strong>on</strong>g>the</str<strong>on</strong>g> level of investment required to address both<br />
outstanding and normal replacement needs. The<br />
questi<strong>on</strong> remains, <str<strong>on</strong>g>the</str<strong>on</strong>g>n, as to how current transit<br />
c<strong>on</strong>diti<strong>on</strong>s are impacting service performance (e.g.,<br />
service reliability, mean time/distance between<br />
failures, track operating speeds)? Similarly, how<br />
would attaining a state of good repair improve service<br />
performance and/or reduce operating and<br />
maintenance costs? This secti<strong>on</strong> c<strong>on</strong>siders <str<strong>on</strong>g>the</str<strong>on</strong>g><br />
known relati<strong>on</strong>ships between transit c<strong>on</strong>diti<strong>on</strong>s and<br />
each of <str<strong>on</strong>g>the</str<strong>on</strong>g> following:<br />
n Maintenance costs<br />
n Service disrupti<strong>on</strong>s<br />
n Slow speed z<strong>on</strong>es<br />
n O<str<strong>on</strong>g>the</str<strong>on</strong>g>r service quality measures<br />
Given limitati<strong>on</strong>s in data and <str<strong>on</strong>g>the</str<strong>on</strong>g> existing research,<br />
this discussi<strong>on</strong> focuses primarily (but not exclusively)<br />
<strong>on</strong> vehicle c<strong>on</strong>diti<strong>on</strong>s and performance, with <str<strong>on</strong>g>the</str<strong>on</strong>g><br />
understanding that similar issues are encountered<br />
with most o<str<strong>on</strong>g>the</str<strong>on</strong>g>r asset types. Moreover, <str<strong>on</strong>g>the</str<strong>on</strong>g><br />
discussi<strong>on</strong> below <strong>on</strong>ly serves to help emphasize <str<strong>on</strong>g>the</str<strong>on</strong>g><br />
relati<strong>on</strong>ships between c<strong>on</strong>diti<strong>on</strong> and performance; it<br />
does not assess current performance or quantify <str<strong>on</strong>g>the</str<strong>on</strong>g><br />
expected improvement to performance from a<br />
significant reinvestment program.<br />
Operating and Maintenance Costs: Older assets –<br />
including vehicles, roadbeds and facilities – tend to