

here. - Ministry of Forests, Lands and Natural Resource Operations
here. - Ministry of Forests, Lands and Natural Resource Operations
here. - Ministry of Forests, Lands and Natural Resource Operations

You also want an ePaper? Increase the reach of your titles
YUMPU automatically turns print PDFs into web optimized ePapers that Google loves.
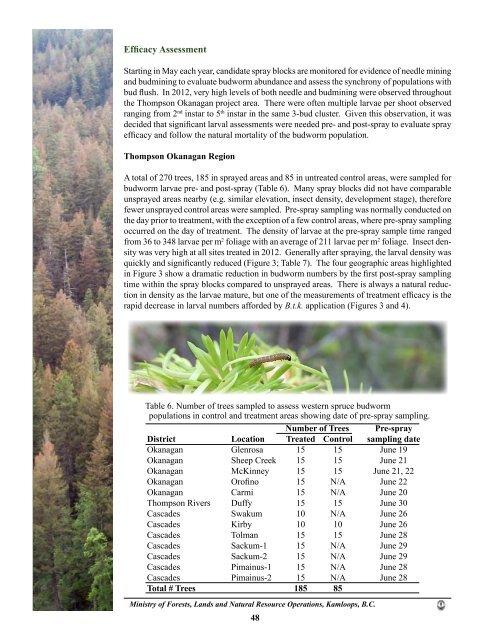
Efficacy Assessment<br />
Starting in May each year, c<strong>and</strong>idate spray blocks are monitored for evidence <strong>of</strong> needle mining<br />
<strong>and</strong> budmining to evaluate budworm abundance <strong>and</strong> assess the synchrony <strong>of</strong> populations with<br />
bud flush. In 2012, very high levels <strong>of</strong> both needle <strong>and</strong> budmining were observed throughout<br />
the Thompson Okanagan project area. T<strong>here</strong> were <strong>of</strong>ten multiple larvae per shoot observed<br />
ranging from 2 nd instar to 5 th instar in the same 3-bud cluster. Given this observation, it was<br />
decided that significant larval assessments were needed pre- <strong>and</strong> post-spray to evaluate spray<br />
efficacy <strong>and</strong> follow the natural mortality <strong>of</strong> the budworm population.<br />
Thompson Okanagan Region<br />
A total <strong>of</strong> 270 trees, 185 in sprayed areas <strong>and</strong> 85 in untreated control areas, were sampled for<br />
budworm larvae pre- <strong>and</strong> post-spray (Table 6). Many spray blocks did not have comparable<br />
unsprayed areas nearby (e.g. similar elevation, insect density, development stage), t<strong>here</strong>fore<br />
fewer unsprayed control areas were sampled. Pre-spray sampling was normally conducted on<br />
the day prior to treatment, with the exception <strong>of</strong> a few control areas, w<strong>here</strong> pre-spray sampling<br />
occurred on the day <strong>of</strong> treatment. The density <strong>of</strong> larvae at the pre-spray sample time ranged<br />
from 36 to 348 larvae per m 2 foliage with an average <strong>of</strong> 211 larvae per m 2 foliage. Insect density<br />
was very high at all sites treated in 2012. Generally after spraying, the larval density was<br />
quickly <strong>and</strong> significantly reduced (Figure 3; Table 7). The four geographic areas highlighted<br />
in Figure 3 show a dramatic reduction in budworm numbers by the first post-spray sampling<br />
time within the spray blocks compared to unsprayed areas. T<strong>here</strong> is always a natural reduction<br />
in density as the larvae mature, but one <strong>of</strong> the measurements <strong>of</strong> treatment efficacy is the<br />
rapid decrease in larval numbers afforded by B.t.k. application (Figures 3 <strong>and</strong> 4).<br />
Table 6. Number <strong>of</strong> trees sampled to assess western spruce budworm<br />
populations in control <strong>and</strong> treatment areas showing date <strong>of</strong> pre-spray sampling.<br />
Number <strong>of</strong> Trees Pre-spray<br />
District Location Treated Control sampling date<br />
Okanagan Glenrosa 15 15 June 19<br />
Okanagan Sheep Creek 15 15 June 21<br />
Okanagan McKinney 15 15 June 21, 22<br />
Okanagan Or<strong>of</strong>ino 15 N/A June 22<br />
Okanagan Carmi 15 N/A June 20<br />
Thompson Rivers Duffy 15 15 June 30<br />
Cascades Swakum 10 N/A June 26<br />
Cascades Kirby 10 10 June 26<br />
Cascades Tolman 15 15 June 28<br />
Cascades Sackum-1 15 N/A June 29<br />
Cascades Sackum-2 15 N/A June 29<br />
Cascades Pimainus-1 15 N/A June 28<br />
Cascades Pimainus-2 15 N/A June 28<br />
Total # Trees 185 85<br />
<strong>Ministry</strong> <strong>of</strong> <strong>Forests</strong>, <strong>L<strong>and</strong>s</strong> <strong>and</strong> <strong>Natural</strong> <strong>Resource</strong> <strong>Operations</strong>, Kamloops, B.C.<br />
48


