History in the new South Africa: an introduction - Det danske ...
History in the new South Africa: an introduction - Det danske ...
History in the new South Africa: an introduction - Det danske ...
Create successful ePaper yourself
Turn your PDF publications into a flip-book with our unique Google optimized e-Paper software.
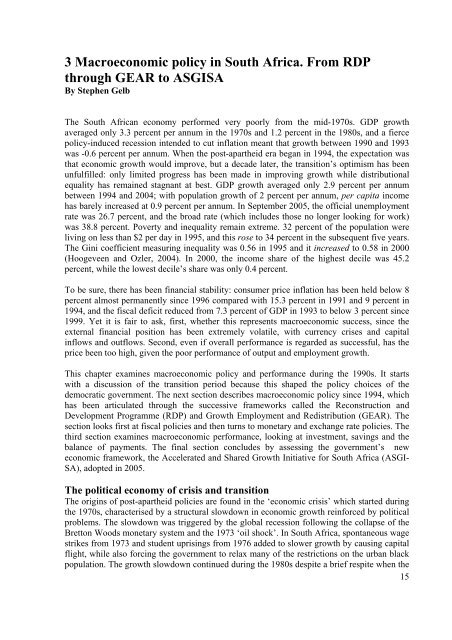
3 Macroeconomic policy <strong>in</strong> <strong>South</strong> <strong>Africa</strong>. From RDP<br />
through GEAR to ASGISA<br />
By Stephen Gelb<br />
The <strong>South</strong> <strong>Africa</strong>n economy performed very poorly from <strong>the</strong> mid-1970s. GDP growth<br />
averaged only 3.3 percent per <strong>an</strong>num <strong>in</strong> <strong>the</strong> 1970s <strong>an</strong>d 1.2 percent <strong>in</strong> <strong>the</strong> 1980s, <strong>an</strong>d a fierce<br />
policy-<strong>in</strong>duced recession <strong>in</strong>tended to cut <strong>in</strong>flation me<strong>an</strong>t that growth between 1990 <strong>an</strong>d 1993<br />
was -0.6 percent per <strong>an</strong>num. When <strong>the</strong> post-apar<strong>the</strong>id era beg<strong>an</strong> <strong>in</strong> 1994, <strong>the</strong> expectation was<br />
that economic growth would improve, but a decade later, <strong>the</strong> tr<strong>an</strong>sition’s optimism has been<br />
unfulfilled: only limited progress has been made <strong>in</strong> improv<strong>in</strong>g growth while distributional<br />
equality has rema<strong>in</strong>ed stagn<strong>an</strong>t at best. GDP growth averaged only 2.9 percent per <strong>an</strong>num<br />
between 1994 <strong>an</strong>d 2004; with population growth of 2 percent per <strong>an</strong>num, per capita <strong>in</strong>come<br />
has barely <strong>in</strong>creased at 0.9 percent per <strong>an</strong>num. In September 2005, <strong>the</strong> official unemployment<br />
rate was 26.7 percent, <strong>an</strong>d <strong>the</strong> broad rate (which <strong>in</strong>cludes those no longer look<strong>in</strong>g for work)<br />
was 38.8 percent. Poverty <strong>an</strong>d <strong>in</strong>equality rema<strong>in</strong> extreme. 32 percent of <strong>the</strong> population were<br />
liv<strong>in</strong>g on less th<strong>an</strong> $2 per day <strong>in</strong> 1995, <strong>an</strong>d this rose to 34 percent <strong>in</strong> <strong>the</strong> subsequent five years.<br />
The G<strong>in</strong>i coefficient measur<strong>in</strong>g <strong>in</strong>equality was 0.56 <strong>in</strong> 1995 <strong>an</strong>d it <strong>in</strong>creased to 0.58 <strong>in</strong> 2000<br />
(Hoogeveen <strong>an</strong>d Ozler, 2004). In 2000, <strong>the</strong> <strong>in</strong>come share of <strong>the</strong> highest decile was 45.2<br />
percent, while <strong>the</strong> lowest decile’s share was only 0.4 percent.<br />
To be sure, <strong>the</strong>re has been f<strong>in</strong><strong>an</strong>cial stability: consumer price <strong>in</strong>flation has been held below 8<br />
percent almost perm<strong>an</strong>ently s<strong>in</strong>ce 1996 compared with 15.3 percent <strong>in</strong> 1991 <strong>an</strong>d 9 percent <strong>in</strong><br />
1994, <strong>an</strong>d <strong>the</strong> fiscal deficit reduced from 7.3 percent of GDP <strong>in</strong> 1993 to below 3 percent s<strong>in</strong>ce<br />
1999. Yet it is fair to ask, first, whe<strong>the</strong>r this represents macroeconomic success, s<strong>in</strong>ce <strong>the</strong><br />
external f<strong>in</strong><strong>an</strong>cial position has been extremely volatile, with currency crises <strong>an</strong>d capital<br />
<strong>in</strong>flows <strong>an</strong>d outflows. Second, even if overall perform<strong>an</strong>ce is regarded as successful, has <strong>the</strong><br />
price been too high, given <strong>the</strong> poor perform<strong>an</strong>ce of output <strong>an</strong>d employment growth.<br />
This chapter exam<strong>in</strong>es macroeconomic policy <strong>an</strong>d perform<strong>an</strong>ce dur<strong>in</strong>g <strong>the</strong> 1990s. It starts<br />
with a discussion of <strong>the</strong> tr<strong>an</strong>sition period because this shaped <strong>the</strong> policy choices of <strong>the</strong><br />
democratic government. The next section describes macroeconomic policy s<strong>in</strong>ce 1994, which<br />
has been articulated through <strong>the</strong> successive frameworks called <strong>the</strong> Reconstruction <strong>an</strong>d<br />
Development Programme (RDP) <strong>an</strong>d Growth Employment <strong>an</strong>d Redistribution (GEAR). The<br />
section looks first at fiscal policies <strong>an</strong>d <strong>the</strong>n turns to monetary <strong>an</strong>d exch<strong>an</strong>ge rate policies. The<br />
third section exam<strong>in</strong>es macroeconomic perform<strong>an</strong>ce, look<strong>in</strong>g at <strong>in</strong>vestment, sav<strong>in</strong>gs <strong>an</strong>d <strong>the</strong><br />
bal<strong>an</strong>ce of payments. The f<strong>in</strong>al section concludes by assess<strong>in</strong>g <strong>the</strong> government’s <strong>new</strong><br />
economic framework, <strong>the</strong> Accelerated <strong>an</strong>d Shared Growth Initiative for <strong>South</strong> <strong>Africa</strong> (ASGI-<br />
SA), adopted <strong>in</strong> 2005.<br />
The political economy of crisis <strong>an</strong>d tr<strong>an</strong>sition<br />
The orig<strong>in</strong>s of post-apar<strong>the</strong>id policies are found <strong>in</strong> <strong>the</strong> ‘economic crisis’ which started dur<strong>in</strong>g<br />
<strong>the</strong> 1970s, characterised by a structural slowdown <strong>in</strong> economic growth re<strong>in</strong>forced by political<br />
problems. The slowdown was triggered by <strong>the</strong> global recession follow<strong>in</strong>g <strong>the</strong> collapse of <strong>the</strong><br />
Bretton Woods monetary system <strong>an</strong>d <strong>the</strong> 1973 ‘oil shock’. In <strong>South</strong> <strong>Africa</strong>, spont<strong>an</strong>eous wage<br />
strikes from 1973 <strong>an</strong>d student upris<strong>in</strong>gs from 1976 added to slower growth by caus<strong>in</strong>g capital<br />
flight, while also forc<strong>in</strong>g <strong>the</strong> government to relax m<strong>an</strong>y of <strong>the</strong> restrictions on <strong>the</strong> urb<strong>an</strong> black<br />
population. The growth slowdown cont<strong>in</strong>ued dur<strong>in</strong>g <strong>the</strong> 1980s despite a brief respite when <strong>the</strong><br />
15


