History in the new South Africa: an introduction - Det danske ...
History in the new South Africa: an introduction - Det danske ...
History in the new South Africa: an introduction - Det danske ...

Create successful ePaper yourself
Turn your PDF publications into a flip-book with our unique Google optimized e-Paper software.
The <strong>an</strong>alysis is confirmed by two features. Firstly <strong>the</strong> evidence is that it is also true that<br />
“household services grew at a much faster rate between 1993 to 1999 <strong>an</strong>d <strong>the</strong>n slowed down<br />
<strong>in</strong> <strong>the</strong> period 1999 to 2004 (Bhorat et al, 2006: 11). The much criticized GEAR policy came<br />
on stream effectively <strong>in</strong> <strong>the</strong> second period, a feature which will be commented on fur<strong>the</strong>r<br />
below. Secondly <strong>the</strong> figures show that <strong>the</strong> backlogs <strong>in</strong> services are also disproportionally<br />
represented by <strong>the</strong>se poorest. Among <strong>the</strong> poorest, for <strong>in</strong>st<strong>an</strong>ce, more th<strong>an</strong> 70 per cent lacked<br />
access to a flush toilet <strong>an</strong>d 60 per cent of households did not have access to piped water <strong>in</strong><br />
2004 (Bhorat et al, 2006: 14). The most pro-poor service delivery (unexpectedly because it is<br />
probably <strong>the</strong> most costly to poor people as prepaid meters are extensively used) is <strong>in</strong><br />
electricity which is fairly evenly spread among <strong>the</strong> poor <strong>an</strong>d <strong>the</strong> poorest.<br />
The lags <strong>in</strong> delivery evidenced by slower delivery over time <strong>an</strong>d <strong>the</strong> cont<strong>in</strong>u<strong>in</strong>g backlogs help<br />
confirm that <strong>the</strong> phenomenal percentage <strong>in</strong>creases <strong>in</strong> delivery have to be measured aga<strong>in</strong>st<br />
actual numbers. Although <strong>the</strong> percentage of people <strong>in</strong> <strong>the</strong> backlogs has decl<strong>in</strong>ed over time, <strong>in</strong><br />
a number of sectors <strong>the</strong> number has <strong>in</strong>creased. The lags <strong>in</strong> delivery particularly focus on <strong>the</strong><br />
problems <strong>in</strong> effectively upgrad<strong>in</strong>g <strong>the</strong> lives of <strong>the</strong> poorest <strong>an</strong>d challenge <strong>the</strong> assertion that<br />
targets <strong>in</strong> delivery will be met.<br />
While <strong>the</strong>re cont<strong>in</strong>ues to be general reports of social progress based on uncerta<strong>in</strong> statistics<br />
<strong>the</strong>re is also <strong>in</strong>creas<strong>in</strong>g disclosure, partial <strong>an</strong>d slow, but disclosure none<strong>the</strong>less of difficulties<br />
<strong>in</strong> delivery which po<strong>in</strong>t to subst<strong>an</strong>tial problems. The M<strong>in</strong>ister of Hous<strong>in</strong>g, for <strong>in</strong>st<strong>an</strong>ce, speaks<br />
of ris<strong>in</strong>g delivery but at <strong>the</strong> same time acknowledges that shack hous<strong>in</strong>g is <strong>in</strong>creas<strong>in</strong>g <strong>an</strong>d<br />
<strong>in</strong>creas<strong>in</strong>g at a faster pace th<strong>an</strong> before.<br />
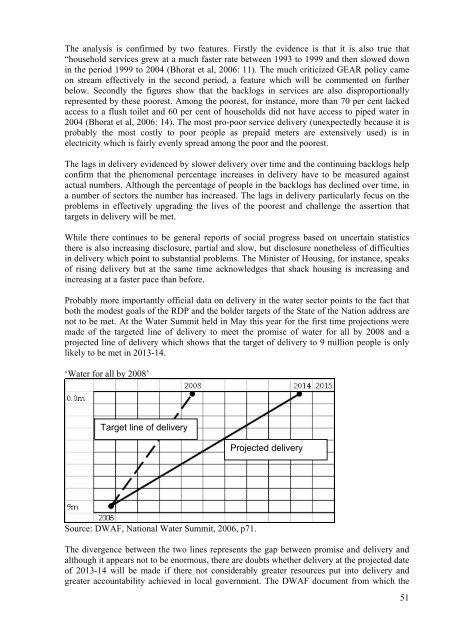
Probably more import<strong>an</strong>tly official data on delivery <strong>in</strong> <strong>the</strong> water sector po<strong>in</strong>ts to <strong>the</strong> fact that<br />
both <strong>the</strong> modest goals of <strong>the</strong> RDP <strong>an</strong>d <strong>the</strong> bolder targets of <strong>the</strong> State of <strong>the</strong> Nation address are<br />
not to be met. At <strong>the</strong> Water Summit held <strong>in</strong> May this year for <strong>the</strong> first time projections were<br />
made of <strong>the</strong> targeted l<strong>in</strong>e of delivery to meet <strong>the</strong> promise of water for all by 2008 <strong>an</strong>d a<br />
projected l<strong>in</strong>e of delivery which shows that <strong>the</strong> target of delivery to 9 million people is only<br />
likely to be met <strong>in</strong> 2013-14.<br />
‘Water for all by 2008’<br />
Target l<strong>in</strong>e of delivery<br />
Source: DWAF, National Water Summit, 2006, p71.<br />
Projected delivery<br />
The divergence between <strong>the</strong> two l<strong>in</strong>es represents <strong>the</strong> gap between promise <strong>an</strong>d delivery <strong>an</strong>d<br />
although it appears not to be enormous, <strong>the</strong>re are doubts whe<strong>the</strong>r delivery at <strong>the</strong> projected date<br />
of 2013-14 will be made if <strong>the</strong>re not considerably greater resources put <strong>in</strong>to delivery <strong>an</strong>d<br />
greater accountability achieved <strong>in</strong> local government. The DWAF document from which <strong>the</strong><br />
51