History in the new South Africa: an introduction - Det danske ...
History in the new South Africa: an introduction - Det danske ...
History in the new South Africa: an introduction - Det danske ...

Create successful ePaper yourself
Turn your PDF publications into a flip-book with our unique Google optimized e-Paper software.
Fem<br />
ale<br />
Dwelli<br />
Pove<br />
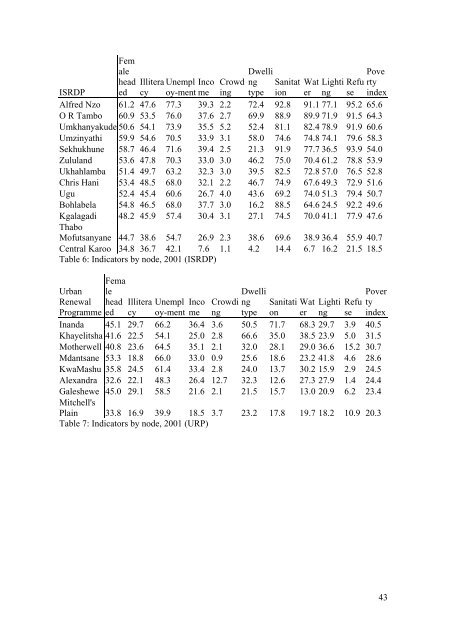
head Illitera Unempl Inco Crowd ng S<strong>an</strong>itat Wat Lighti Refu rty<br />
ISRDP ed cy oy-ment me <strong>in</strong>g type ion er ng se <strong>in</strong>dex<br />
Alfred Nzo 61.2 47.6 77.3 39.3 2.2 72.4 92.8 91.1 77.1 95.2 65.6<br />
O R Tambo 60.9 53.5 76.0 37.6 2.7 69.9 88.9 89.9 71.9 91.5 64.3<br />
Umkh<strong>an</strong>yakude 50.6 54.1 73.9 35.5 5.2 52.4 81.1 82.4 78.9 91.9 60.6<br />
Umz<strong>in</strong>yathi 59.9 54.6 70.5 33.9 3.1 58.0 74.6 74.8 74.1 79.6 58.3<br />
Sekhukhune 58.7 46.4 71.6 39.4 2.5 21.3 91.9 77.7 36.5 93.9 54.0<br />
Zulul<strong>an</strong>d 53.6 47.8 70.3 33.0 3.0 46.2 75.0 70.4 61.2 78.8 53.9<br />
Ukhahlamba 51.4 49.7 63.2 32.3 3.0 39.5 82.5 72.8 57.0 76.5 52.8<br />
Chris H<strong>an</strong>i 53.4 48.5 68.0 32.1 2.2 46.7 74.9 67.6 49.3 72.9 51.6<br />
Ugu 52.4 45.4 60.6 26.7 4.0 43.6 69.2 74.0 51.3 79.4 50.7<br />
Bohlabela 54.8 46.5 68.0 37.7 3.0 16.2 88.5 64.6 24.5 92.2 49.6<br />
Kgalagadi<br />
Thabo<br />
48.2 45.9 57.4 30.4 3.1 27.1 74.5 70.0 41.1 77.9 47.6<br />
Mofuts<strong>an</strong>y<strong>an</strong>e 44.7 38.6 54.7 26.9 2.3 38.6 69.6 38.9 36.4 55.9 40.7<br />
Central Karoo 34.8 36.7 42.1 7.6 1.1 4.2 14.4 6.7 16.2 21.5 18.5<br />
Table 6: Indicators by node, 2001 (ISRDP)<br />
Urb<strong>an</strong><br />
Fema<br />
le<br />
Dwelli<br />
Pover<br />
Re<strong>new</strong>al head Illitera Unempl Inco Crowdi ng S<strong>an</strong>itati Wat Lighti Refu ty<br />
Programme ed cy oy-ment me ng type on er ng se <strong>in</strong>dex<br />
In<strong>an</strong>da 45.1 29.7 66.2 36.4 3.6 50.5 71.7 68.3 29.7 3.9 40.5<br />
Khayelitsha 41.6 22.5 54.1 25.0 2.8 66.6 35.0 38.5 23.9 5.0 31.5<br />
Mo<strong>the</strong>rwell 40.8 23.6 64.5 35.1 2.1 32.0 28.1 29.0 36.6 15.2 30.7<br />
Md<strong>an</strong>ts<strong>an</strong>e 53.3 18.8 66.0 33.0 0.9 25.6 18.6 23.2 41.8 4.6 28.6<br />
KwaMashu 35.8 24.5 61.4 33.4 2.8 24.0 13.7 30.2 15.9 2.9 24.5<br />
Alex<strong>an</strong>dra 32.6 22.1 48.3 26.4 12.7 32.3 12.6 27.3 27.9 1.4 24.4<br />
Galeshewe 45.0 29.1 58.5<br />
Mitchell's<br />
21.6 2.1 21.5 15.7 13.0 20.9 6.2 23.4<br />
Pla<strong>in</strong> 33.8 16.9 39.9 18.5 3.7 23.2 17.8 19.7 18.2 10.9 20.3<br />
Table 7: Indicators by node, 2001 (URP)<br />
43