History in the new South Africa: an introduction - Det danske ...
History in the new South Africa: an introduction - Det danske ...
History in the new South Africa: an introduction - Det danske ...

You also want an ePaper? Increase the reach of your titles
YUMPU automatically turns print PDFs into web optimized ePapers that Google loves.
Umz<strong>in</strong>yathi, Sekhukhune <strong>an</strong>d Zulul<strong>an</strong>d all have poverty levels above <strong>the</strong> ISRDP average<br />
of 53.7%. And <strong>the</strong> relative poverty among ISRDP n odes is marked: poverty levels <strong>in</strong><br />
Central Karoo are 3 times lower th<strong>an</strong> <strong>in</strong> <strong>the</strong> poorest 4 nodes.<br />
In <strong>the</strong> URP, poverty levels are above <strong>the</strong> programme average <strong>in</strong> In<strong>an</strong>da, Md<strong>an</strong>ts<strong>an</strong>e <strong>an</strong>d<br />
Khayelitsha. In In<strong>an</strong>da (us<strong>in</strong>g <strong>the</strong> 2001 node-specific data which is more reliable th<strong>an</strong><br />
that of 1996, as we have noted), 4 <strong>in</strong> 10 residents live <strong>in</strong> high poverty, well above o<strong>the</strong>r<br />
urb<strong>an</strong> nodes <strong>an</strong>d mak<strong>in</strong>g it looks far more like a rural th<strong>an</strong> <strong>an</strong> urb<strong>an</strong> node. The 2001 data<br />
suggest that In<strong>an</strong>da should be a priority node with<strong>in</strong> <strong>the</strong> URP.<br />
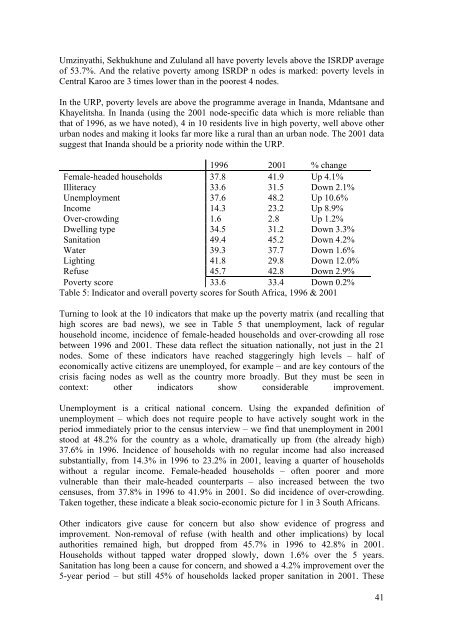
1996 2001 % ch<strong>an</strong>ge<br />
Female-headed households 37.8 41.9 Up 4.1%<br />
Illiteracy 33.6 31.5 Down 2.1%<br />
Unemployment 37.6 48.2 Up 10.6%<br />
Income 14.3 23.2 Up 8.9%<br />
Over-crowd<strong>in</strong>g 1.6 2.8 Up 1.2%<br />
Dwell<strong>in</strong>g type 34.5 31.2 Down 3.3%<br />
S<strong>an</strong>itation 49.4 45.2 Down 4.2%<br />
Water 39.3 37.7 Down 1.6%<br />
Light<strong>in</strong>g 41.8 29.8 Down 12.0%<br />
Refuse 45.7 42.8 Down 2.9%<br />
Poverty score 33.6 33.4 Down 0.2%<br />
Table 5: Indicator <strong>an</strong>d overall poverty scores for <strong>South</strong> <strong>Africa</strong>, 1996 & 2001<br />
Turn<strong>in</strong>g to look at <strong>the</strong> 10 <strong>in</strong>dicators that make up <strong>the</strong> poverty matrix (<strong>an</strong>d recall<strong>in</strong>g that<br />
high scores are bad <strong>new</strong>s), we see <strong>in</strong> Table 5 that unemployment, lack of regular<br />
household <strong>in</strong>come, <strong>in</strong>cidence of female-headed households <strong>an</strong>d over-crowd<strong>in</strong>g all rose<br />
between 1996 <strong>an</strong>d 2001. These data reflect <strong>the</strong> situation nationally, not just <strong>in</strong> <strong>the</strong> 21<br />
nodes. Some of <strong>the</strong>se <strong>in</strong>dicators have reached stagger<strong>in</strong>gly high levels – half of<br />
economically active citizens are unemployed, for example – <strong>an</strong>d are key contours of <strong>the</strong><br />
crisis fac<strong>in</strong>g nodes as well as <strong>the</strong> country more broadly. But <strong>the</strong>y must be seen <strong>in</strong><br />
context: o<strong>the</strong>r <strong>in</strong>dicators show considerable improvement.<br />
Unemployment is a critical national concern. Us<strong>in</strong>g <strong>the</strong> exp<strong>an</strong>ded def<strong>in</strong>ition of<br />
unemployment – which does not require people to have actively sought work <strong>in</strong> <strong>the</strong><br />
period immediately prior to <strong>the</strong> census <strong>in</strong>terview – we f<strong>in</strong>d that unemployment <strong>in</strong> 2001<br />
stood at 48.2% for <strong>the</strong> country as a whole, dramatically up from (<strong>the</strong> already high)<br />
37.6% <strong>in</strong> 1996. Incidence of households with no regular <strong>in</strong>come had also <strong>in</strong>creased<br />
subst<strong>an</strong>tially, from 14.3% <strong>in</strong> 1996 to 23.2% <strong>in</strong> 2001, leav<strong>in</strong>g a quarter of households<br />
without a regular <strong>in</strong>come. Female-headed households – often poorer <strong>an</strong>d more<br />
vulnerable th<strong>an</strong> <strong>the</strong>ir male-headed counterparts – also <strong>in</strong>creased between <strong>the</strong> two<br />
censuses, from 37.8% <strong>in</strong> 1996 to 41.9% <strong>in</strong> 2001. So did <strong>in</strong>cidence of over-crowd<strong>in</strong>g.<br />
Taken toge<strong>the</strong>r, <strong>the</strong>se <strong>in</strong>dicate a bleak socio-economic picture for 1 <strong>in</strong> 3 <strong>South</strong> <strong>Africa</strong>ns.<br />
O<strong>the</strong>r <strong>in</strong>dicators give cause for concern but also show evidence of progress <strong>an</strong>d<br />
improvement. Non-removal of refuse (with health <strong>an</strong>d o<strong>the</strong>r implications) by local<br />
authorities rema<strong>in</strong>ed high, but dropped from 45.7% <strong>in</strong> 1996 to 42.8% <strong>in</strong> 2001.<br />
Households without tapped water dropped slowly, down 1.6% over <strong>the</strong> 5 years.<br />
S<strong>an</strong>itation has long been a cause for concern, <strong>an</strong>d showed a 4.2% improvement over <strong>the</strong><br />
5-year period – but still 45% of households lacked proper s<strong>an</strong>itation <strong>in</strong> 2001. These<br />
41