Trained Scientific Women Power: How Much are we Losing and Why?
Trained Scientific Women Power: How Much are we Losing and Why?
Trained Scientific Women Power: How Much are we Losing and Why?

Create successful ePaper yourself
Turn your PDF publications into a flip-book with our unique Google optimized e-Paper software.
A majority of the group has reported attending<br />
conferences <strong>and</strong> workshops twice or more than<br />
twice a year (50.0 per cent). Among those who<br />
attended it, the highest stated reason for attending*<br />
was to keep themselves updated <strong>and</strong> gain more<br />
knowledge (35.9 per cent). The second most<br />
stated response was due to interest in the topic<br />
covered in the conference (19.5 per cent).<br />
Approximately similar number of responses has also<br />
been obtained for Networking (19.2 per cent).<br />
(Refer Appendix II, table 26 for more details).<br />
(16.9 per cent). (Refer Appendix II, table 28<br />
for details).<br />
Perceptions Regarding Drop- out from Science<br />
<strong>and</strong> Provisions to Retain <strong>Women</strong> in Science<br />
Note: The question was a multiple response question <strong>and</strong> the total<br />
number of responses received exceed the actual number of<br />
respondents<br />
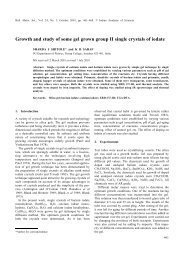
With respect to provisions to retain women in<br />
Science*, as with other groups, the majority of<br />
responses given by the group indicate flexibility<br />
in timings 7 to be the most useful provision (31.1<br />
per cent responses). <strong>How</strong>ever, the second most<br />
frequently stated response differs from the other<br />
groups, it being better HR policies (16.8 per cent<br />
responses).<br />
Note: The question was a multiple response question <strong>and</strong> the total<br />
number of responses received exceed the actual number of<br />
respondents<br />
52.7 per cent of WNR reported that women drop<br />
out of Science more frequently. A higher proportion<br />
of this group (13.7 per cent) comp<strong>are</strong>d to the other<br />
two groups has also reported that men drop out<br />
of Science more often. With respect to reasons why<br />
women drop out of Science*, a majority of 50.9<br />
responses indicate family responsibilities to be<br />
a significant reason, follo<strong>we</strong>d by disenabling<br />
organizational factors 6 (19.4 per cent). Given<br />
the fact, that existing literature particularly in the<br />
Indian context has always upheld that societal <strong>and</strong><br />
family reasons <strong>are</strong> responsible for women leaving<br />
Science, the study has brought to the fore the role<br />
of disenabling organizational factors. Recent<br />
sociological studies in India corroborate this finding<br />
(Gupta <strong>and</strong> Sharma 2003; Subramanian, 2007;<br />
Kumar, 2009; etc.). A majority of responses by<br />
women in the group also indicate that men drop out<br />
of Science* for other lucrative c<strong>are</strong>er options<br />
(47.5 per cent) follo<strong>we</strong>d by the reason of lack of<br />
dedication <strong>and</strong> patience for c<strong>are</strong>ers in Science<br />
Category III: <strong>Women</strong> Not Working (WNW)<br />
<strong>Women</strong> scientists classified under Category III <strong>are</strong><br />
currently unemployed, though they may be engaged<br />
in activities <strong>and</strong> interests of non-occupational nature.<br />
It is important to note that women in category III<br />
belonged to two different views: on the one h<strong>and</strong><br />
women who had voluntarily chosen to leave their<br />
professions with the desire to spend more time with<br />
family <strong>and</strong> children. On the other h<strong>and</strong>, this group<br />
also comprised those who had given up their c<strong>are</strong>ers<br />
involuntarily due to organizational or personal<br />
hurdles. A total of 74 women scientists (13.0 per<br />
cent of the total women intervie<strong>we</strong>d) <strong>we</strong>re surveyed.<br />
While the total registered number of women<br />
scientists who <strong>we</strong>re not employed at the time<br />
of registration was much higher (144), many<br />
had obtained temporary posts (such as on DST<br />
women scientist schemes) by the time of the<br />
survey, <strong>and</strong> several others <strong>we</strong>re unwilling to<br />
participate in the survey.<br />
29