Modeling deforestation baselines using GEOMOD - Instituto ...
Modeling deforestation baselines using GEOMOD - Instituto ...
Modeling deforestation baselines using GEOMOD - Instituto ...

Create successful ePaper yourself
Turn your PDF publications into a flip-book with our unique Google optimized e-Paper software.
Finalizing Avoided Deforestation Baselines<br />
boundary information includes the three ejido forest extension zones of Dzibalchen, Hopelchen and<br />
Champoton . In the North the highest agreement between the simulated and the actual maps was achieved<br />
in the municipio of Champoton, which is also the region with the highest <strong>deforestation</strong> rate. Most of the<br />
area of analysis in the southern region lies in the municipio of Calakmul. In both the Calakmul (north and<br />
south) and the small portion of Escarcega intersecting our study area the percent of cells simulated<br />
correctly (see Appendix Table 2), was very high (98.09 – 98.68), but the kappa statistic very low (– 0.0079<br />
to 0.0498). A kappa of 0 indicates the <strong>GEOMOD</strong> with the information provided by that driver map is not<br />
able to forecast the year 2000 landscape any better than if the model had no information, i.e. was operating<br />
on chance alone. A kappa less than 0 indicates that the model is doing worse than it would do with no<br />
information. Normally a low kappa or one less than zero is an indication that the pattern of <strong>deforestation</strong> is<br />
random and not predictable. Frequently this is seen in areas of clandestine <strong>deforestation</strong> or chaotic<br />
settlement patterns, such as those with a high refugee influx.<br />
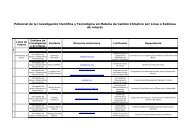
Table 4. ‘Kappa-for-location’ results for each <strong>deforestation</strong> pattern driver and combination of drivers<br />
tested, for a) northern analysis, b) southern analysis (the cells colored red, blue and yellow indicate<br />
the three drivers, in importance from high to low respectively, giving the highest Kappa.<br />
Total Region Hopelchen Champoton Calakmul Escarcega<br />
DRIVERS Map Name Kappa Kappa Kappa Kappa Kappa<br />
NORTH<br />
1 Dist. Agric_70 0.13 0.10 0.16 0.00 0.01<br />
2 Dist. All Wat. Srcs. 0.04 0.07 0.03 0.00 0.02<br />
3 Elevation 0.17 0.05 0.23 0.00 0.00<br />
4 Ejidos 0.05 0.01 0.05 0.05 0.01<br />
5 Dist. Arq.Sites 0.23 0.09 0.30 0.00 0.02<br />
6 Dist. Roads 0.05 0.03 0.06 0.00 0.04<br />
7 Dens. Sect.1 Pop. 0.07 0.03 0.09 0.00 0.01<br />
8 Dist.Perm. Strms 0.12 0.19 0.12 0.01 -0.01<br />
9 Dist. Towns 0.17 0.16 0.19 0.01 0.02<br />
10 Dist. Perm. Wat. Src. 0.02 0.00 0.03 -0.01 0.01<br />
11 Perm. Wetl. 0.00 0.00 0.00 0.00 0.01<br />
12 Seas. Wetl. 0.02 0.09 0.00 0.00 0.01<br />
13 All Wetl. 0.02 0.09 0.01 0.00 0.01<br />
Combinations<br />
5, 3 2 drivers 0.26 0.04 0.35 0.02 0.02<br />
5, 3, 9 3 drivers 0.25 0.17 0.29 0.03 0.05<br />
5, 3, 9, 1 4 drivers 0.26 0.15 0.32 0.03 0.05<br />
5, 3, 9, 1, 8 5 drivers 0.28 0.17 0.34 0.05 0.03<br />
5, 3, 9, 1, 8, 7 6 drivers 0.27 0.17 0.33 0.06 0.03<br />
5, 3, 9, 1, 8, 7, 6, 4 8 drivers 0.27 0.18 0.33 0.05 0.03<br />
SOUTH Map Name Kappa Kappa Kappa<br />
1 Dist. Agric_70 0.0121 0.0782 0.0098<br />
2 Dist. All Wat. Srcs. 0.0064 0.1257 0.0022<br />
3 Elevation 0.0161 0.0753 0.0140<br />
4 Ejidos 0.0927 0.1043 0.0923<br />
5 Dist. Arq.Sites 0.0229 0.1682 0.0177<br />
6 Dist. Roads 0.0244 0.0301 0.0242<br />
A- 16<br />
Winrock International


![John Ganzi [Modo de compatibilidad]](https://img.yumpu.com/22669860/1/190x132/john-ganzi-modo-de-compatibilidad.jpg?quality=85)