Modeling deforestation baselines using GEOMOD - Instituto ...
Modeling deforestation baselines using GEOMOD - Instituto ...
Modeling deforestation baselines using GEOMOD - Instituto ...

Create successful ePaper yourself
Turn your PDF publications into a flip-book with our unique Google optimized e-Paper software.
Finalizing Avoided Deforestation Baselines<br />
Changes in carbon stocks<br />
The carbon density estimates used per vegetation type are summarized in Table 19 (from A. Ordoñez,<br />
2003, personal communication).<br />
Table 19. Carbon density estimates for vegetation found in the region Purepecha.<br />
Vegetation Type<br />
T C/ha<br />
Agriculture 4<br />
Pasture 5<br />
Shrubs 7<br />
Forest Plantation 39<br />
Permanent Crops (Orchards) 42<br />
Pine-Oak Forest 77<br />
Pine Forests 84<br />
Oak Forests 95<br />
Oyamel Forest 110<br />
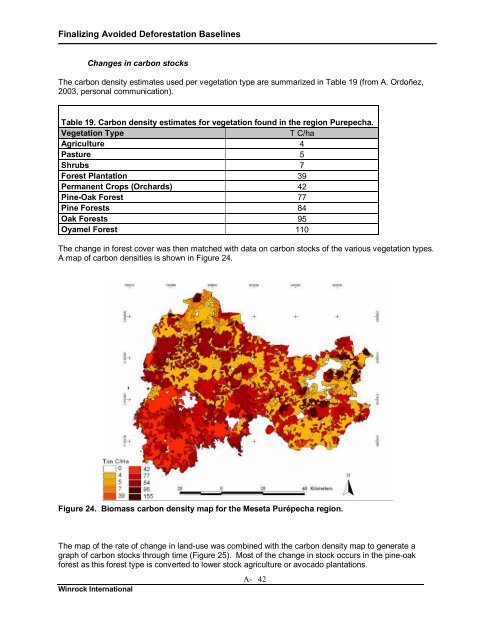
The change in forest cover was then matched with data on carbon stocks of the various vegetation types.<br />
A map of carbon densities is shown in Figure 24.<br />
Figure 24. Biomass carbon density map for the Meseta Purépecha region.<br />
The map of the rate of change in land-use was combined with the carbon density map to generate a<br />
graph of carbon stocks through time (Figure 25). Most of the change in stock occurs in the pine-oak<br />
forest as this forest type is converted to lower stock agriculture or avocado plantations.<br />
Winrock International<br />
A- 42


![John Ganzi [Modo de compatibilidad]](https://img.yumpu.com/22669860/1/190x132/john-ganzi-modo-de-compatibilidad.jpg?quality=85)