Modeling deforestation baselines using GEOMOD - Instituto ...
Modeling deforestation baselines using GEOMOD - Instituto ...
Modeling deforestation baselines using GEOMOD - Instituto ...

You also want an ePaper? Increase the reach of your titles
YUMPU automatically turns print PDFs into web optimized ePapers that Google loves.
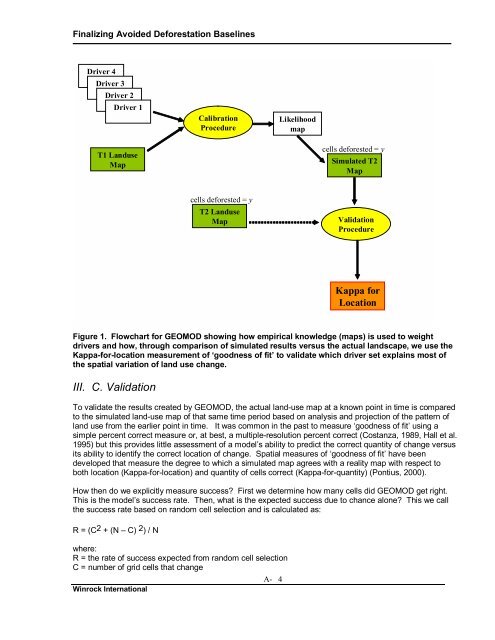
Finalizing Avoided Deforestation Baselines<br />
Driver 4<br />
Driver 3<br />
Driver 2<br />
Driver 1<br />
Calibration<br />
Procedure<br />
Likelihood<br />
map<br />
T1 Landuse<br />
Map<br />
cells deforested = y<br />
Simulated T2<br />
Map<br />
cells deforested = y<br />
T2 Landuse<br />
Map<br />
Validation<br />
Procedure<br />
Kappa for<br />
Location<br />
Figure 1. Flowchart for <strong>GEOMOD</strong> showing how empirical knowledge (maps) is used to weight<br />
drivers and how, through comparison of simulated results versus the actual landscape, we use the<br />
Kappa-for-location measurement of ‘goodness of fit’ to validate which driver set explains most of<br />
the spatial variation of land use change.<br />
III. C. Validation<br />
To validate the results created by <strong>GEOMOD</strong>, the actual land-use map at a known point in time is compared<br />
to the simulated land-use map of that same time period based on analysis and projection of the pattern of<br />
land use from the earlier point in time. It was common in the past to measure ‘goodness of fit’ <strong>using</strong> a<br />
simple percent correct measure or, at best, a multiple-resolution percent correct (Costanza, 1989, Hall et al.<br />
1995) but this provides little assessment of a model’s ability to predict the correct quantity of change versus<br />
its ability to identify the correct location of change. Spatial measures of ‘goodness of fit’ have been<br />
developed that measure the degree to which a simulated map agrees with a reality map with respect to<br />
both location (Kappa-for-location) and quantity of cells correct (Kappa-for-quantity) (Pontius, 2000).<br />
How then do we explicitly measure success? First we determine how many cells did <strong>GEOMOD</strong> get right.<br />
This is the model’s success rate. Then, what is the expected success due to chance alone? This we call<br />
the success rate based on random cell selection and is calculated as:<br />
R = (C2 + (N – C) 2) / N<br />
where:<br />
R = the rate of success expected from random cell selection<br />
C = number of grid cells that change<br />
Winrock International<br />
A- 4


![John Ganzi [Modo de compatibilidad]](https://img.yumpu.com/22669860/1/190x132/john-ganzi-modo-de-compatibilidad.jpg?quality=85)