
You also want an ePaper? Increase the reach of your titles
YUMPU automatically turns print PDFs into web optimized ePapers that Google loves.
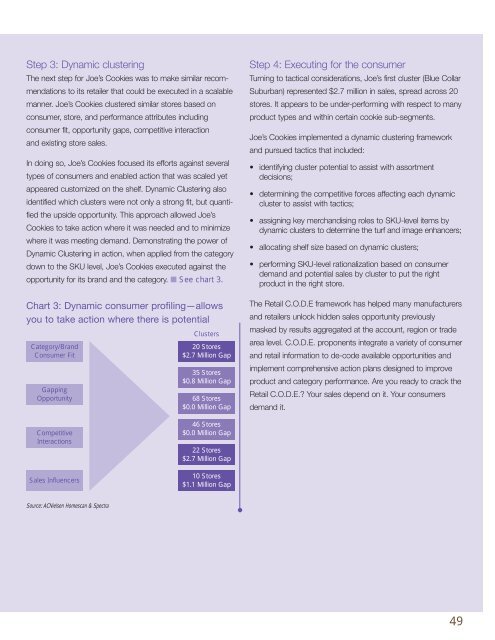
Step 3: Dynamic clustering<br />
The next step for Joe’s Cookies was to make similar recommendations<br />
to its retailer that could be executed in a scalable<br />
manner. Joe’s Cookies clustered similar stores based on<br />
consumer, store, and performance attributes including<br />
consumer fit, opportunity gaps, competitive interaction<br />
and existing store sales.<br />
In doing so, Joe’s Cookies focused its efforts against several<br />
types of consumers and enabled action that was scaled yet<br />
appeared customized on the shelf. Dynamic Clustering also<br />
identified which clusters were not only a strong fit, but quantified<br />
the upside opportunity. This approach allowed Joe’s<br />
Cookies to take action where it was needed and to minimize<br />
where it was meeting demand. Demonstrating the power of<br />
Dynamic Clustering in action, when applied from the category<br />
down to the SKU level, Joe’s Cookies executed against the<br />
opportunity for its brand and the category. ■ See chart 3.<br />
Chart 3: Dynamic consumer profiling—allows<br />
you to take action where there is potential<br />
Category/Brand<br />
Consumer Fit<br />
Gapping<br />
Opportunity<br />
Clusters<br />
20 Stores<br />
$2.7 Million Gap<br />
35 Stores<br />
$0.8 Million Gap<br />
68 Stores<br />
$0.0 Million Gap<br />
Step 4: Executing for the consumer<br />
Turning to tactical considerations, Joe’s first cluster (Blue Collar<br />
Suburban) represented $2.7 million in sales, spread across 20<br />
stores. It appears to be under-performing with respect to many<br />
product types and within certain cookie sub-segments.<br />
Joe’s Cookies implemented a dynamic clustering framework<br />
and pursued tactics that included:<br />
• identifying cluster potential to assist with assortment<br />
decisions;<br />
• determining the competitive forces affecting each dynamic<br />
cluster to assist with tactics;<br />
• assigning key merchandising roles to SKU-level items by<br />
dynamic clusters to determine the turf and image enhancers;<br />
• allocating shelf size based on dynamic clusters;<br />
• performing SKU-level rationalization based on consumer<br />
demand and potential sales by cluster to put the right<br />
product in the right store.<br />
The Retail C.O.D.E framework has helped many manufacturers<br />
and retailers unlock hidden sales opportunity previously<br />
masked by results aggregated at the account, region or trade<br />
area level. C.O.D.E. proponents integrate a variety of consumer<br />
and retail information to de-code available opportunities and<br />
implement comprehensive action plans designed to improve<br />
product and category performance. Are you ready to crack the<br />
Retail C.O.D.E.? Your sales depend on it. Your consumers<br />
demand it.<br />
Competitive<br />
Interactions<br />
Sales Influencers<br />
46 Stores<br />
$0.0 Million Gap<br />
22 Stores<br />
$2.7 Million Gap<br />
10 Stores<br />
$1.1 Million Gap<br />
Source: ACNielsen Homescan & Spectra<br />
49